Bart Pattern [LuxAlgo]As a sequel to our 'meme indicator' series... The Bart Pattern Detector identifies confirmed regular and inverted Bart patterns using edge detection.
Settings
Median Lookback: Lookback period of the median filter used for the edge detection, with a shorter period allowing to detect shorter-term and less spaced patterns.
Edge Detection Sensitivity: Sensitivity of the edge detection method, with higher values making the method less sensible to edges of low magnitude.
Range To Edges Threshold: Threshold for the range to edges ratio, with lower values detecting Bart patterns with flatter ranges between the edges.
Show Inverted Barts: Show inverted Bart patterns.
Mode: Determines how detected Bart patterns are displayed.
Usage
This indicator can be used to study past Bart patterns and how the market responded to them. Their detection is not done in real-time. Additionally detected edges are used to indicate the current market sentiment.
If you don't want a meme on your chart, you can also use the simple mode - but don't worry, we won't judge you if you don't...
Details
The origins of Bart patterns can be hard to pinpoint but most likely originate from social media around 2018. This pattern has been mostly covered in the cryptocurrency market similarly to how the McDonald's Pattern became a popular meme within the community. See our McDonald's Pattern Indicator that was created by us as our first 'meme indicator' in the series
The Bart pattern as its name suggests occurs when price forms a structure resembling the head of the Simpson character "Bart Simpson". This is characterized by a rectangular structure, which is a sideways market delimited by sharp volatile edges.
The Bart pattern is sometimes traded before completion, waiting for a breakout of a support/resistance located within the sideway part of the pattern.
The cause of this pattern is still discussed by traders, with some attributing it to over-leveraged market participants and while others attributing it to exchanges themselves through spoofing.
Notes
Barts patterns are very volatile structures, characterized by sudden price jumps, be careful when trading them.
Shout to the famous alien @lilmayo and our good pal @scheplick for the suggestion to create this work of art.
And don't forget to eat your shorts.
"2018年+黄金价格+历史数据" için komut dosyalarını ara

NormalizedOscillatorsLibrary "NormalizedOscillators"
Collection of some common Oscillators. All are zero-mean and normalized to fit in the -1..1 range. Some are modified, so that the internal smoothing function could be configurable (for example, to enable Hann Windowing, that John F. Ehlers uses frequently). Some are modified for other reasons (see comments in the code), but never without a reason. This collection is neither encyclopaedic, nor reference, however I try to find the most correct implementation. Suggestions are welcome.
rsi2(upper, lower) RSI - second step
Parameters:
upper : Upwards momentum
lower : Downwards momentum
Returns: Oscillator value
Modified by Ehlers from Wilder's implementation to have a zero mean (oscillator from -1 to +1)
Originally: 100.0 - (100.0 / (1.0 + upper / lower))
Ignoring the 100 scale factor, we get: upper / (upper + lower)
Multiplying by two and subtracting 1, we get: (2 * upper) / (upper + lower) - 1 = (upper - lower) / (upper + lower)
rms(src, len) Root mean square (RMS)
Parameters:
src : Source series
len : Lookback period
Based on by John F. Ehlers implementation
ift(src) Inverse Fisher Transform
Parameters:
src : Source series
Returns: Normalized series
Based on by John F. Ehlers implementation
The input values have been multiplied by 2 (was "2*src", now "4*src") to force expansion - not compression
The inputs may be further modified, if needed
stoch(src, len) Stochastic
Parameters:
src : Source series
len : Lookback period
Returns: Oscillator series
ssstoch(src, len) Super Smooth Stochastic (part of MESA Stochastic) by John F. Ehlers
Parameters:
src : Source series
len : Lookback period
Returns: Oscillator series
Introduced in the January 2014 issue of Stocks and Commodities
This is not an implementation of MESA Stochastic, as it is based on Highpass filter not present in the function (but you can construct it)
This implementation is scaled by 0.95, so that Super Smoother does not exceed 1/-1
I do not know, if this the right way to fix this issue, but it works for now
netKendall(src, len) Noise Elimination Technology by John F. Ehlers
Parameters:
src : Source series
len : Lookback period
Returns: Oscillator series
Introduced in the December 2020 issue of Stocks and Commodities
Uses simplified Kendall correlation algorithm
Implementation by @QuantTherapy:
rsi(src, len, smooth) RSI
Parameters:
src : Source series
len : Lookback period
smooth : Internal smoothing algorithm
Returns: Oscillator series
vrsi(src, len, smooth) Volume-scaled RSI
Parameters:
src : Source series
len : Lookback period
smooth : Internal smoothing algorithm
Returns: Oscillator series
This is my own version of RSI. It scales price movements by the proportion of RMS of volume
mrsi(src, len, smooth) Momentum RSI
Parameters:
src : Source series
len : Lookback period
smooth : Internal smoothing algorithm
Returns: Oscillator series
Inspired by RocketRSI by John F. Ehlers (Stocks and Commodities, May 2018)
rrsi(src, len, smooth) Rocket RSI
Parameters:
src : Source series
len : Lookback period
smooth : Internal smoothing algorithm
Returns: Oscillator series
Inspired by RocketRSI by John F. Ehlers (Stocks and Commodities, May 2018)
Does not include Fisher Transform of the original implementation, as the output must be normalized
Does not include momentum smoothing length configuration, so always assumes half the lookback length
mfi(src, len, smooth) Money Flow Index
Parameters:
src : Source series
len : Lookback period
smooth : Internal smoothing algorithm
Returns: Oscillator series
lrsi(src, in_gamma, len) Laguerre RSI by John F. Ehlers
Parameters:
src : Source series
in_gamma : Damping factor (default is -1 to generate from len)
len : Lookback period (alternatively, if gamma is not set)
Returns: Oscillator series
The original implementation is with gamma. As it is impossible to collect gamma in my system, where the only user input is length,
an alternative calculation is included, where gamma is set by dividing len by 30. Maybe different calculation would be better?
fe(len) Choppiness Index or Fractal Energy
Parameters:
len : Lookback period
Returns: Oscillator series
The Choppiness Index (CHOP) was created by E. W. Dreiss
This indicator is sometimes called Fractal Energy
er(src, len) Efficiency ratio
Parameters:
src : Source series
len : Lookback period
Returns: Oscillator series
Based on Kaufman Adaptive Moving Average calculation
This is the correct Efficiency ratio calculation, and most other implementations are wrong:
the number of bar differences is 1 less than the length, otherwise we are adding the change outside of the measured range!
For reference, see Stocks and Commodities June 1995
dmi(len, smooth) Directional Movement Index
Parameters:
len : Lookback period
smooth : Internal smoothing algorithm
Returns: Oscillator series
Based on the original Tradingview algorithm
Modified with inspiration from John F. Ehlers DMH (but not implementing the DMH algorithm!)
Only ADX is returned
Rescaled to fit -1 to +1
Unlike most oscillators, there is no src parameter as DMI works directly with high and low values
fdmi(len, smooth) Fast Directional Movement Index
Parameters:
len : Lookback period
smooth : Internal smoothing algorithm
Returns: Oscillator series
Same as DMI, but without secondary smoothing. Can be smoothed later. Instead, +DM and -DM smoothing can be configured
doOsc(type, src, len, smooth) Execute a particular Oscillator from the list
Parameters:
type : Oscillator type to use
src : Source series
len : Lookback period
smooth : Internal smoothing algorithm
Returns: Oscillator series
Chande Momentum Oscillator (CMO) is RSI without smoothing. No idea, why some authors use different calculations
LRSI with Fractal Energy is a combo oscillator that uses Fractal Energy to tune LRSI gamma, as seen here: www.prorealcode.com
doPostfilter(type, src, len) Execute a particular Oscillator Postfilter from the list
Parameters:
type : Oscillator type to use
src : Source series
len : Lookback period
Returns: Oscillator series

[blackcat] L2 Ehlers Fisherized Deviation Scaled OscillatorLevel: 2
Background
John F. Ehlers introuced Fisherized Deviation Scaled Oscillator in Oct, 2018.
Function
In “Probability—Probably A Good Thing To Know,” John Ehlers introduces a procedure for measuring an indicator’s probability distribution to determine if it can be used as part of a reversion-to-the-mean trading strategy. Dr. Ehlers demonstrates this method with several of his existing indicators and presents a new indicator that he calls a deviation-scaled oscillator with Fisher transform. It charts the probability density of an oscillator to evaluate its applicability to swing trading.
Key Signal
FisherFilt --> Ehlers Fisherized Deviation Scaled Oscillator fast line
Trigger --> Ehlers Fisherized Deviation Scaled Oscillator slow line
Pros and Cons
100% John F. Ehlers definition translation, even variable names are the same. This help readers who would like to use pine to read his book.
Remarks
The 91th script for Blackcat1402 John F. Ehlers Week publication.
Readme
In real life, I am a prolific inventor. I have successfully applied for more than 60 international and regional patents in the past 12 years. But in the past two years or so, I have tried to transfer my creativity to the development of trading strategies. Tradingview is the ideal platform for me. I am selecting and contributing some of the hundreds of scripts to publish in Tradingview community. Welcome everyone to interact with me to discuss these interesting pine scripts.
The scripts posted are categorized into 5 levels according to my efforts or manhours put into these works.
Level 1 : interesting script snippets or distinctive improvement from classic indicators or strategy. Level 1 scripts can usually appear in more complex indicators as a function module or element.
Level 2 : composite indicator/strategy. By selecting or combining several independent or dependent functions or sub indicators in proper way, the composite script exhibits a resonance phenomenon which can filter out noise or fake trading signal to enhance trading confidence level.
Level 3 : comprehensive indicator/strategy. They are simple trading systems based on my strategies. They are commonly containing several or all of entry signal, close signal, stop loss, take profit, re-entry, risk management, and position sizing techniques. Even some interesting fundamental and mass psychological aspects are incorporated.
Level 4 : script snippets or functions that do not disclose source code. Interesting element that can reveal market laws and work as raw material for indicators and strategies. If you find Level 1~2 scripts are helpful, Level 4 is a private version that took me far more efforts to develop.
Level 5 : indicator/strategy that do not disclose source code. private version of Level 3 script with my accumulated script processing skills or a large number of custom functions. I had a private function library built in past two years. Level 5 scripts use many of them to achieve private trading strategy.

13612WThis script is a 13612W momentum filter used in the Vigilant Asset Allocation (VAA) and Defensive Asset Allocation (DAA) created by Wouter J. Keller and Jan Willem Keuning.
This asset allocation strategy was uploaded to SSRN in 2017 and 2018.
13612W Calculation Method
(Profitability in Last 1 months * 12 +
Profitability in Last 3 months * 4 +
Profitability in Last 6 months * 2 +
Profitability in Last 12 months)/4
Let me briefly explain one of the VAAs, VAA-G4.
The VAA-G4 has an annualized return of 17.7%, a Sharpe ratio of 1.07% and Max Drawdown of 16.1%.
(It's too long and complicated to describe all VAA, DAA strategies. Above all, the translator performance is not good.)
VAA Global 4 Universe: SPY, EFA, EEM, AGG
Cash Universe: SHY , IEF, LQD
If 13612W of VAA Global 4 Universe is negative at least one
>> 100% of assets hold one of the highest 13612W of Cash Universe
If all 13612W of VAA Global 4 Universe are positive
>> 100% of assets hold one of the highest 13612W of VAA Global 4 Universe
Rebalancing is done every month according to this method.

BTC and ETH Long strategy - version 1I will start with a small introduction about myself. I'm now trading cryto currencies manually for almost 2 years. I decided to start after watching a documentary on the TV showing people who made big money during the Bitcoin pump which happened at the end of 2017.
The next day, I asked myself "Why should I not give it a try and learn how to trade".
This was in February 2018 and the price of Bitcoin was around 11500USD.
I didn't know how to trade. In fact, I didn't know the trading industry at all.
So, my first step into trading was to open an account with a broken. Then I directly bought 200$ worst of BTC . At that time, I saw the graph and thought "This can only go back in the upward direction!" :)
I didn't know anything about Stop loss, Take profit and Risk management.
Today, almost 2 years after, I think that I know how to trade and can also confirm that I still hold this bag of 200$ of bitcoin from 2018 :)
I did spend the 2 last years to learn technical analysis , risk management and leverage trading.
Today (14/05/2020), I know what I'm doing and I'm happy to see that the 2 last years have been positive in terms of gains. Of course, I did not make crazy money with my saving but at least I made more than if I would have kept it in my bank account.
Even if I like trading, I have a full time job which requires my full energy and lots of focus, so, the biggest problem I had is that I didn't have enough time to look at the charts.
Also, I realized that sometimes, neither technical analysis , nor fundamentals worked with crypto currency (at least for short time trading). So, as I have a developer background I decided to try to have a look at algo trading.
The goal for me was neither to make complex algos nor to beat the market but just to automate my trading with simple bot catching the big waves.
I then started to take a look at TV pine script and played with it.
I did my first LONG script in February 2020 to Long the BTC Market. It has some limitations but works well enough for me for the time being. Even if the real trades will bring me half of what the back testing shows, this will still be a lot more than what I was used to win during the last 2 years with my manual trading.
So, here we are! Below you will find some details about my first LONG script. I'm happy to share it with you.
Feel free to play with it, give your comments and bring improvements to it.
But please note that it only works fine with the candle size and crypto pair that I have mentioned below. If you use other settings this algo might loose money!
- Crypto pairs : XBTUSD and ETHXBT
- Candle size: 2 Hours
- Indicator used: Volatility , MACD (12, 26, 7), SMA (100), SMA (200), EMA (20)
- Default StopLoss: -1.5%
- Entry in position if: Volatility < 2%
AND MACD moving up
AND AME (20) moving up
AND SMA (100) moving up
AND SMA (200) moving up
AND EMA (20) > SAM (100)
AND SMA (100) > SMA (200)
- Exit the postion if: Stoploss is reached
OR EMA (20) crossUnder SMA (100)
Here is a summary of the results for this script:
XBTUSD : 01/01/2019 --> 14/05/2020 = +107%
ETHXBT : 01/01/2019 --> 14/05/2020 = +39%
ETHUSD : 01/01/2019 --> 14/05/2020 = +112%
It is far away from being perfect. There are still plenty of things which can be done to improve it but I just wanted to share it :) .
Enjoy playing with it....

Realized Volatility IIR Filters with BandsDISCLAIMER:
The Following indicator/code IS NOT intended to be a formal investment advice or recommendation by the author, nor should be construed as such. Users will be fully responsible by their use regarding their own trading vehicles/assets.
The following indicator was made for NON LUCRATIVE ACTIVITIES and must remain as is following TradingView's regulations. Use of indicator and their code are published by Invitation Only for work and knowledge sharing. All access granted over it, their use, copy or re-use should mention authorship(s) and origin(s).
WARNING NOTICE!
THE INCLUDED FUNCTION MUST BE CONSIDERED AS TESTING. The models included in the indicator have been taken from open sources on the web and some of them has been modified by the author, problems could occur at diverse data sceneries.
WHAT'S THIS...?
Work derived by previous own research for study:
This is mainly an INFINITE IMPULSE RESPONSE FILTERING INDICATOR , it's purpose is to catch trend given by the nature of lag given by a VOLATILITY ESTIMATION ALGORITHM as it's coefficient. It provides as well an INFINITE IMPULSE RESPONSE DEVIATION FILTER that uses the same coefficients of the main filter to plot deviation bands as an auxiliary tool.
The given Filter based indicator provides my own Multi Volatility-Estimators Function with only 3 models:
ELASTIC VOLUME WEIGHTED VOLATILITY : This is a Modified Daigler & Padungsaksawasdi "Volume Weighted Volatility" as on DOI: 10.1504/IJBAAF.2018.089423 but with Elastic Volume Weighted Moving Average instead of VWAP (intraday) for faster (but inaccurate) calculation. A future version is planned on the way using intra-bar inspection for intraday timeframe as described in original paper.
GARMAN & KLASS / YANG-ZANG EXTENSION : As one of the best range based (OHLC) with open gaps inclusion in a single bar.
PETER MARTIN'S ULCER INDEX : This is a better approach to measure realized volatility than standard deviation of log returns given it's proven convex risk metric for DrawDowns as shown in Chekhlov et al. (2005) . Regarding this particular model, I take a different approach to use it as coefficient feed: Given that the UI only takes in consideration DrawDawns, I code myself the inverse of this to compute Draw-Ups as well and use both of them to filter minimums volatility levels in order to create a SLOW version of the IIR filter, and maximums of both to calculate as FAST variation. This approach can be used as a better proxy instead of any other common moving average given that with NO COMPOUND IN TIME AT ALL (N=1) or only using as long as N=3 bars of compund, the filter can catch a trend easily, making the indicator nearly a NON PARAMETRIC FILTER.
NOTES:
This version DO NOT INCLUDE ALERTS.
This version DO NOT INCLUDE STRATEGY: ALL Feedback welcome.
DERIVED WORK:
Incremental calculation of weighted mean and variance by Tony Finch (fanf2@cam. ac .uk) (dot@dotat.at), 2009.
Volume weighted volatility: empirical evidence for a new realised volatility measure by Chaiyuth Padungsaksawasdi & Robert T. Daigler, 2018.
Basic DSP Tips & Trics by TradingView user @alexgrover
CHEERS!
@XeL_Arjona 2020.

.BXBT IndexThe current .BXBT index weighted as close as possible to BitMEX's with updates as BitMEX refreshes their index.
Difference between this and the script titled '2020 March 27 .BXBT Index': this one will receive updates because it doesn't have a date in its title.
Methodology
www.bitmex.com
"BitMEX Index Weights, assuming no constituent exchanges have been excluded due to Index Protection Rules, last updated 27 December 2019 at 12:00:05 UTC."
Binance: -
Bitstamp: 10.61%
Bittrex: 2.53%
Coinbase: 52.30%
Gemini: 6.89%
Huobi: -
Itbit: 4.21%
Kraken: 23.46%
Poloniex: -
ItBit's weight is combined with Gemini's due to ItBit not being on TradingView as of now. BITTREX:BTCUSD substituted with BITTREX:BTCUSDT*POLONIEX:USDTUSD to backfill because Bittrex only recently (late 2018) started to offer a fiat BTC/USD pair. Not that it matters since the index used in 2018 didn't include Bittrex if I remember correctly.
What is actually used for 27/12/2019 to 27/03/2020:
Binance: -
Bitstamp: 10.61%
Bittrex: 2.53%
Coinbase: 52.30%
Gemini: 11.10%
Huobi: -
Itbit: -
Kraken: 23.46%
Poloniex: -
Options:
Toggle candlesticks or close line
Change price source to be used for indicators
To be added: Change quarter to show indexes for different times, with labels that apply to the appropriate index used
Reasons to use this vs. the index itself: (not many)
It is helpful as a reference for other indicators or creation of an index.

Stability Max OverloadStability Max Overload was created in another script I have been working on found below.
I have broken the code down to only display the Stability features.
What this is:
I was trying to find a way that could in some form display the Stability or Instability of the US Treasuries Bond Market. To try and help me do that, I came up with 3 values.
*Stability
*Stability Overload
*Stability Max Overload.
I started with STABILITY. This value is generated based off the number of side by side inversions in the Bond Market. I wanted this value to range between 0 and 1 while 1 equaling all Bonds inverted and 0 equaling no Bonds inverted and any number of inversions in between would equal a percentage value based off the actual number.
STABILITY OVERLOAD was created based off the average of each inversion.
STABILITY MAX OVERLOAD was then created based off the total of each inversion.
The most stable Yield Curve would have no inversions and therefore would generate a 0 for Stability, Stability Overload and Stability Max Overload. The more inversions the Yield Curve has the higher in value Stability itself would have as Stability is weighted more per inversion. With each inversion, data is taken based off the amount with which the Yields are inverted.
This display shows where we currently stand since Dec 2018. It's a telling story so say the least. I do plan on continuing the mentioned above script but again wanted to release a standalone of the data generated.
Hope you enjoy,
OpptionsOnly

Filtered Waves [NXT2017] #Linda Raschke #basics on Arthur MerrilHI BIG PLAYERS,
this script I wrote for an enquiry of a tradingview-user. It should represent the Filtered Waves idea from Arthur Merril and used by Linda Raschke.
It's similar like a visualization of Elliott Waves.
On YouTube title "MTA UK Chapter Presentation with Linda Raschke" between 34-36 minutes Linda Raschke shows the rules for her Filterd Waves.
Any questions? Ask me!
King regards
NXT2017
========
TO MY PERSON
I'm the second winner of the official German Forex Trading Competition in 2018.
Look here to the ranks:
deutsche-trading-meisterschaften.de
I speak german, english and russian.
My strength in trading are Wolfe Wave pattern.

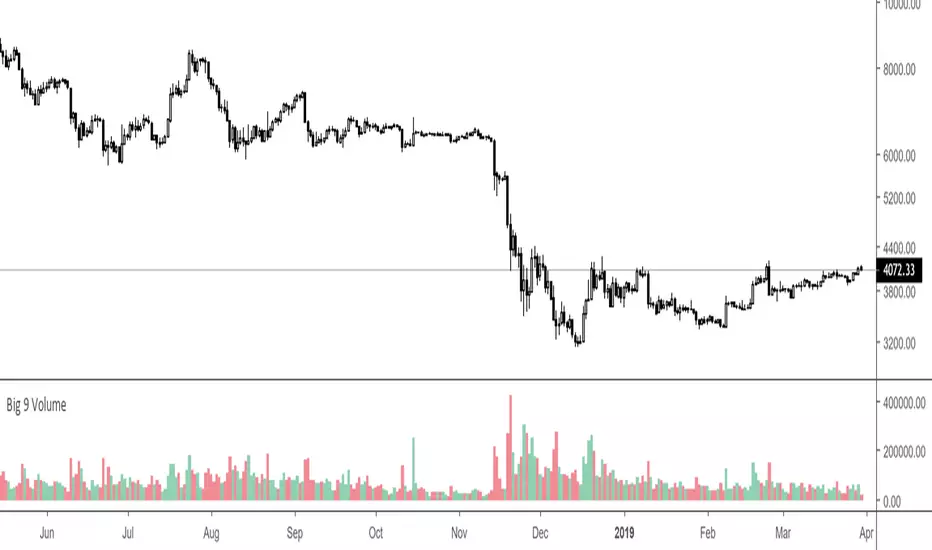
Big 9 Volume - Volume indicator from exchanges with real volumeHere is a very basic indicator combining the volumes of the 9 biggest exchanges trading BTC/USD or BTC/USDT. These 9 exchanges were chosen based on the report by Bitwise Invest stating that 95% of the volume on CoinMarketCap is fake. On these 9 exchanges, however, volume data appears to be reliable. Please note BitFlyer was not included because it does not trade in USD. Please note also that data on all 9 exchanges is only available from June 2018.
Anyone is welcome to modify this and make it more elegant, this was just a quick implementation.
ATR Volatility Spectrum
This indicator estimates price volatility and it is based on ATR only.
The advantage of this indicator is that it can be used with any pair, any time frame.
The fluctuations of a short period ATR with respect to a gently ATR with high period
are calculated.
The only parameters are the periods of the reference ATR and fast ATR, which could be
safely let untouched and modified by experts.
RED areas depict low volatility
GREEN areas depict high volatility.
When the clouds are outside the region delimited by the aqua lines we have
extreme conditions:
Extremely low volatility = red cloud outside the aqua bands
Extremely high volatility = green cloud outside the aqua bands
Vitelot/yanez/Vts December 2018.
Hitting the like button is free act of gratitude

Synergy StatsSynergy Stats
This indicator is intended to complement the Synergy indicator. It provides the following statistics:
A percentage showing how often the two assets move in the opposite direction over a given lookback period.
Similarly, another percentage showing how often the two assets move in the same direction over the same lookback period.
Count the number of times (occurrences) when the two assets move in the same direction for more than 4 bars.
Count the number of times the alternative asset moves more than x%
Count the number of times that chart asset moved in the same direction of the alternative asset when the alternative asset moved more than x%
Both indicators were developed for use in an investigation/tutorial using Pine Script to analyse Gold and US Dollar Index correlation.
The full free post can be found here: backtest-rookies.com

SynergySynergy
This indicator was developed for use in an investigation/tutorial using Pine Script to analyse Gold and US Dollar Index correlation.
The first indicator shall measure the percentage change between the open and close of each bar and compare it to the same percentage change of an alternative asset. Additionally, we shall color the background when the two assets move in the same direction. This should allow us to more easily see when the two assets move together and spot trends in their moment.
The yellow bars show use the percentage change in the price of gold. The blue bars show the percentage change in the price of the US Dollar index. If the bar is above zero, it means that the asset closed up. Conversely, if it is below zero, it means the asset closed down. Finally, the grey bars show bars in which the two assets closed in the same direction.
It can be used in conjunction with a second indicator (to be published soon) that provides statistics generated from this indicator.
The full free post can be found here: backtest-rookies.com

Yope BTC tops channelAn empiric channel function that has held BTCUSD price from the beginning up to 2018. Possible extrapolation to the future.
Best used with the BLX ticker.

[astropark] MACD & RSI+//******************************************************************************
// Copyright by astropark v2.0
// RSI+
// 24/10/2018 Added RSI with Center line to have clear glue of current trend
// 10/12/2018 Added MACD
//******************************************************************************

@WACC Volatility Weighted PUT/CALL Positions [SPX]This indicator is based on Volatility and Market Sentiment. When volatility is high, and market sentiment is positive, the indicator is in a low or 'buy state'. When volatility is low and market sentiment is poor, the indicator is high.
The indicator uses the VIX as it's volatility input.
The indicator uses the spread between the Call Volume on SPX/SPY and the Put Volume.
This is pulled from CVSPX and PVSPX.
When volatility and put/call reaches a critical level, such as the levels present in a crisis or a sell off, the line will be green. See Sept 2015, 2008, and Feb 2018.
This level can be edited in the source code.
As the indicator is based on Put/Call, the indicator works best on larger time frames as the put/call ratio becomes a more discernible measure of sentiment over time.

Build A BotThis is the Robot we built during the 60 Minute Build-A-Bot webinar on September 12, 2018. We had a great time, and a lot of participation and the best part was that we finished up this robot and even ran a backtest in exactly 60 minutes! We built this robot based on recommendations and suggestions from those who were attending live. Lots of pieces in this robot, but you can always tinker with it, remove stuff, add things, whatever you want!
This version uses the CCI as a trigger for trade entry. The other version uses the Hull Moving Average as a trigger for trade entry.

Build A Bot Hull TriggerThis is the automated trading system we built during the 60-Minute Build-A-Bot webinar on September 12, 2018. We had a lot of fun, and implemented a TON of indicators LIVE during this webinar! And the best part is that as a group we researched, designed, and built a profitable robot in exactly 60 minutes!
We started by voting on the type of trading system, and this is a trend following system because it got the most votes. Then, the attendees in the webinar sent in their suggestions for indicators and settings during the live webinar (still counting toward the 60 minutes). Once we had the indicators on the chart, and we discussed various settings we could use, we got to work building the robot, and ran the first strategy test...and it was profitable!
This version uses the Hull Moving Average as a trigger for initiating the trade, and everything else is the same for the filters. The other version uses the CCI as a trigger for the trade, and many other indicators as filters.

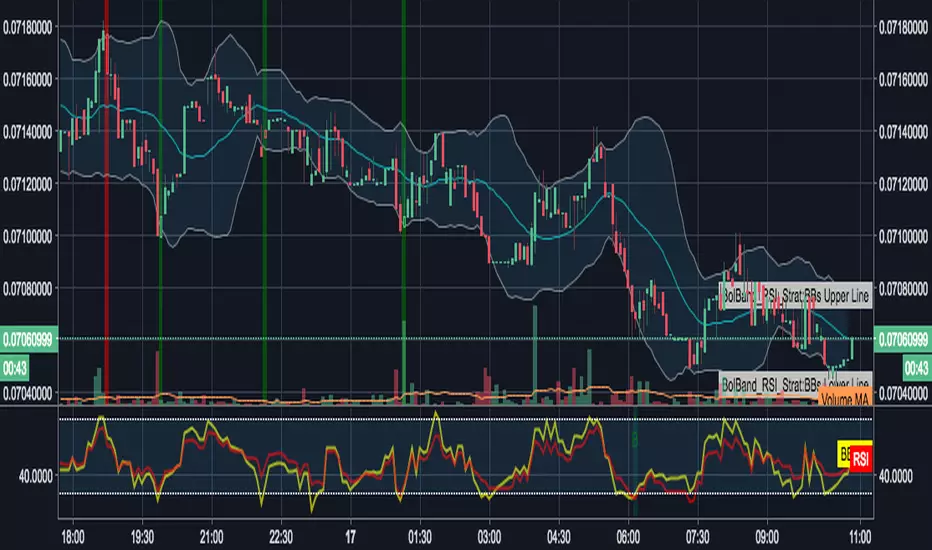
Bollinger Bands + RSI Double Strategy (by SlumdogTrader)
// SlumdogTrader's Bollinger Bands + RSI Double Strategy - Profit Trailer
//
// Version 1.0
// Script by SlumdogTrader on July Fri 13(!), 2018.
//
// This strategy uses a normalise Bollinger Bands + RSI.
//
// Bollinger Band triggers
// SELL - when the price is above the upper band.
// BUY - when the price is below the lower band.
//
// RSI triggers
// SELL - when the price is above 55.
// BUY - when the price is below 45.
//
// This simple strategy only triggers when
// both the BB and the RSI
// indicators, at the same time, are in
// a overbought or oversold condition.
//
// Visit my TradingView work at:
// www.tradingview.com
//
// Visit my website at:
// www.slumdogtrader.com
boot2thrill - Pivot Reversal Strategy with Alert//Notes:
//Version by boot2thrill on 04-16-2018.
//Version includes "BUY" and "SELL" uppercase text with directional triangle shape indicators.
//Based on original PRS.
//***Recommended use on BTCUSD 1h/4h/1d chart.***

ETCUSDSHORTS ETCUSDLONGS - Bitfinex ETC Shorts & Longs// Created by titanlyy
// This script was inspired by @autemox who created the BTC version of this.
// Expecting the coinbase pump in Q3 2018, I was looking for an easy indicator script to display ETC Longs vs Shorts
// Hope this helps. Peace out.
// 12th July 2018

Stiffness IndexStiffness Index Indicator
Overview
The Stiffness Index is a technical analysis indicator created by Markos Katsanos and first introduced in the November 2018 issue of Technical Analysis of Stocks & Commodities magazine. This indicator attempts to recognize strong price trends by counting the number of times price was above the 100-day moving average during the indicator period.
Core Philosophy
The premise is the fewer number of times price penetrates the MA, the stronger the trend. The philosophy behind this indicator is that traders should trade when the trend is at its strongest point - when the trend is at its "stiffest". Based on the observation that in strong long-lasting uptrends, price seldom penetrates the 100-bar simple moving average, this indicator helps assess the quality and strength of an uptrend.
How It Works
The Stiffness Index operates through several key components:
1. Moving Average Baseline: Uses a 100-period moving average as the primary reference level
2. Volatility Threshold: Includes a volatility threshold to eliminate minor movements - typically 0.2 standard deviations to reject minimal penetrations above the moving average
3. Counting Mechanism: Calculates the stiffness coefficient as the ratio of the number of times the price has closed above the moving average during the indicator period to the length of that period
4. Smoothing: Applies additional smoothing to the final result for cleaner signals
Key Components
Input Parameters
- Period 1 (100): The moving average period for the baseline calculation
- MA Method 1: Type of moving average for the baseline (SMA, EMA, SMMA, LWMA)
- Summation Period (60): The lookback period for counting closes above the moving average
- Period 2 (3): Smoothing period for the final signal line
- MA Method 2: Smoothing method for the signal line
- Threshold Level (80): Reference level for identifying strong trends
Visual Elements
- Blue Signal Line: The main stiffness reading showing trend strength
- Dotted Line: Adjustable threshold level for reference
Interpretation and Trading Applications
Signal Readings
- High Values (Above Threshold): Indicates a "stiff" trend where price consistently stays above the moving average with minimal penetrations
- Low Values (Below Threshold): Suggests a weaker trend with frequent penetrations of the moving average
- Original threshold levels mentioned in research range from 75-95
Trading Strategy
The original strategy suggests entering long positions when the stiffness reading reaches 90 or higher, with exits when the reading drops below 50. Some implementations use a threshold of 75 for entry confirmation.
Key Characteristics
- Designed primarily for stocks and instruments with upward bias
- Trades infrequently - typically about once per year when using strict parameters
- Best suited for trend-following strategies in strongly trending markets
Advantages
- Trend Quality Assessment: Quantifies the "stiffness" or quality of trends
- Volatility Filtering: Built-in volatility threshold reduces false signals from minor price movements
- Objective Measurement: Provides a numerical assessment of trend strength
- Customizable: Multiple parameters allow adaptation to different markets and timeframes
Best Practices
- Use in conjunction with baseline trend indicators for confirmation
- Most effective in markets with strong directional bias
- Consider the low frequency of signals when developing trading strategies
- May not be suitable for instruments that "twitch up and down" frequently
*Note: This indicator is specifically designed to identify and trade the strongest trending periods, which naturally results in fewer but potentially higher-quality trading opportunities.*

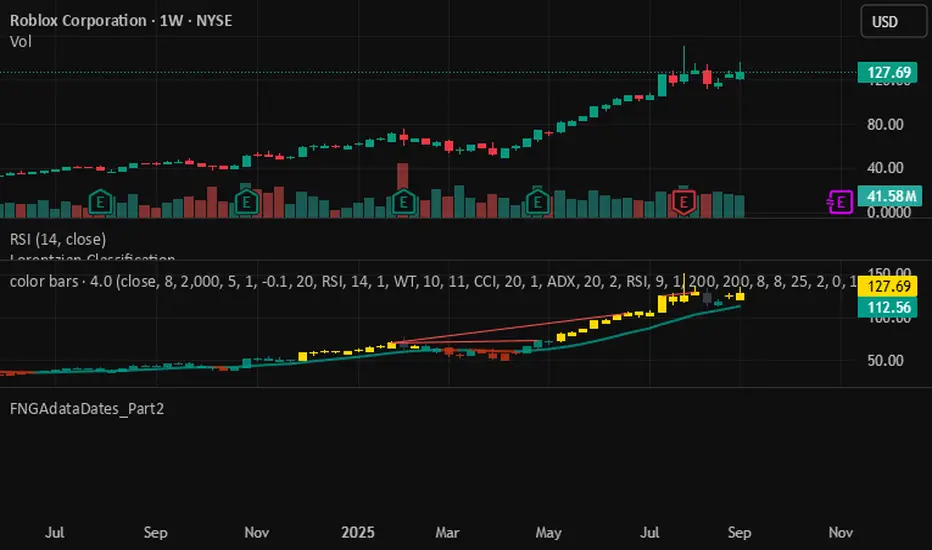
FNGAdataDates_Part2FNGAdataDates_Part2 provides the second part of historical trading dates for a financial instrument (e.g., FNGA index or related asset), covering approximately mid-2021 to January 22, 2018, with 896 trading days. The dates are organized into 18 chunks (dates_19 to dates_36), with 50 dates per chunk for 19–35 and 46 dates for chunk 36 (excluding weekends and possibly holidays). This library complements FNGAdataDates_Part1 to complete the 1,846-date dataset and is designed to align with the FNGAopenPrices and FNGAclosePrices libraries for backtesting, analysis, or visualization in Pine Script.