Zen MIG Reversal V1**Zen MIG Reversal V1**
Zen MIG Reversal is a pattern-based indicator that highlights rare reversal setups.
It’s designed to support traders in visually identifying potential turning points, especially following strong momentum or gap-style moves.
**How it works:**
- **Bullish Reversal:**
Detects 3 consecutive bullish candles. The third bar must have a low above the high of the first bar and below the 20 EMA. When this occurs, a light blue box is drawn across the 3-bar range, from high to the current bar’s low. A blue arrow appears below the prior bar.
- **Bearish Reversal:**
Detects 3 consecutive bearish candles. The third bar must have a high below the low of the first bar and above the 20 EMA. A light red box is drawn from low to the current bar’s high. A red arrow appears above the prior bar.
- Optional settings allow you to:
- Show or hide the EMA line
- Toggle the arrows
- Adjust smoothing settings for context
**Purpose:**
It’s best used for discretionary analysis, journaling, or studying price behavior in momentum-driven environments.
**Disclaimer:**
This script is for educational and informational purposes only. It does not provide financial advice or trade recommendations. Always backtest and use proper risk management before applying any indicator to live trading.
Komut dosyalarını "20蒙古币兑换人民币" için ara

The Mayan CalendarThis indicator displays the current date in the Mayan Calendar, based on real-time UTC time. It calculates and presents:
🌀 Long Count (Baktun.Katun.Tun.Uinal.Kin) – A linear count of days since the Mayan epoch (August 11, 3114 BCE).
🔮 Tzolk'in Date – A 260-day sacred cycle combining a number (1–13) and one of 20 day names (e.g., 4 Ajaw).
🌾 Haab' Date – A 365-day civil cycle divided into 18 months of 20 days + 5 "nameless" days (Wayeb').
The calculations follow Smithsonian standards and align with the Maya Calendar Converter from the National Museum of the American Indian:
👉 maya.nmai.si.edu
The results are shown in a table overlay on your chart's top-right corner. This indicator is great for symbolic traders, astro enthusiasts, or anyone interested in ancient timekeeping systems woven into financial timeframes. Enjoy, time travelers! ⌛

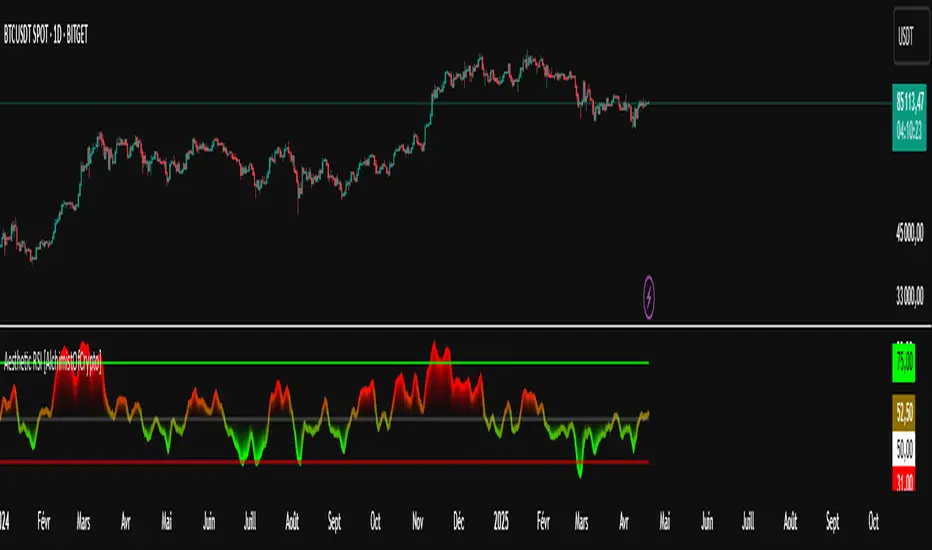
Aesthetic RSI [AlchimistOfCrypto]🌌 Aesthetic RSI – Unveiling the Fractal Forces of Markets 🌌
Category: Momentum Indicators 📈
"The RSI oscillator, formalized through an advanced mathematical prism, reveals the underlying fractal structures of price movements. This indicator draws inspiration from quantum principles of divergence-convergence where the probability of a return to equilibrium increases proportionally to the distance from the median point. Our implementation employs sophisticated algorithmic smoothing to filter out the stochastic noise inherent in financial markets, allowing visualization of the true momentum forces according to thermodynamic entropy principles applied to trading systems."
📊 Professional Trading Application
The Aesthetic RSI is a visually stunning and mathematically refined take on the classic Relative Strength Index. With customizable settings, advanced smoothing, and eight unique visual palettes, it empowers traders to detect momentum shifts and divergences with unparalleled clarity.
⚙️ Indicator Configuration
- Length 📏
The core parameter (default: 20) that determines the calculation period.
- Lower values (8-14): Increase sensitivity for short-term trading.
- Higher values (21-34): Provide stronger signals for position trading.
- OverBought/OverSold Thresholds 🎯
Customizable boundaries (default: 75/25) to identify extreme market conditions.
- Calibrate based on asset volatility: Higher volatility assets may need wider thresholds (80/20) to reduce false signals.
- Style 🎨
Eight meticulously crafted visual palettes optimized for pattern recognition:
- Miami Vice (default): High-contrast cyan/magenta scheme for spotting divergences.
- Cyberpunk: Yellow/purple combo to highlight momentum shifts.
- Classic: Traditional green/red for conventional analysis.
- High Contrast: Maximum visual separation for traders with visual impairments.
- Specialized palettes (Forest, Ocean, Fire, Monochrome): Tailored for diverse market conditions.
- Mode Selection 🔄
- Full: Displays a complete gradient spectrum across the RSI range, emphasizing momentum transitions between 35-65.
- OverZone: Focuses on actionable extreme zones, reducing noise in ranging markets.
🚀 How to Use
1. Adjust Length ⏰: Set the period based on your trading style (short-term or long-term).
2. Fine-Tune Thresholds 🎚️: Customize overbought/oversold levels to match the asset’s volatility.
3. Select a Palette 🌈: Choose a visual style that enhances your pattern recognition.
4. Choose Mode 🔍: Use "Full" for detailed momentum analysis or "OverZone" for extreme zone focus.
5. Spot Divergences ✅: Look for price-RSI divergences to anticipate reversals.
6. Trade with Precision 🛡️: Combine with other indicators for high-probability setups.
📅 Release Notes (April 2025)
Aesthetic RSI blends quantum-inspired mathematics with artistic visualization, redefining momentum analysis. Stay tuned for future enhancements! ✨
🏷️ Tags
#Trading #TechnicalAnalysis #RSI #Momentum #Divergence #MultiTimeframe #TradingStrategy #RiskManagement #Forex #Stocks #Crypto #Bitcoin #AlgoTrading #DayTrading #SwingTrading #TheAlchimist #QuantumTrading #VisualTrading #PatternRecognition
Session Breakouts & Trend Indicator# Session Breakouts & Trend Indicator
This indicator identifies high-probability trading opportunities by tracking key intraday sessions and their breakouts while aligning them with the overall market trend direction.
## What Makes This Indicator Unique
Unlike standard breakout indicators that only identify when price crosses a threshold, this indicator:
- Dynamically identifies and tracks important daily sessions (default: AM 09:00-10:00 and PM 15:00-16:00)
- Determines trend direction using a triple EMA system (20/50/200)
- Shows when breakouts align with the overall trend (higher probability setups)
- Provides visual confirmation with session ranges, breakout levels, and background highlighting
- Includes a comprehensive information panel showing trend/session alignment
## How It Works
The indicator tracks two important daily sessions:
1. **AM Session**: Typically the first hour of trading (default: 09:00-10:00)
2. **PM Session**: Typically the last hour of trading (default: 15:00-16:00)
For each session, it:
- Marks the high and low range
- Establishes breakout levels above/below these ranges
- Detects when price breaks beyond these levels
- Determines if the breakout aligns with the prevailing trend
The trend is calculated using three EMAs (20, 50, 200) for reliable trend identification.
## How To Use
1. Apply the indicator to your chart (works best on 5-minute timeframes)
2. Adjust session times to match your trading schedule if needed
3. Watch for breakouts above session highs (bullish) or below session lows (bearish)
4. Check the information panel to see if the breakout aligns with the trend
5. Enter trades in the direction of trend-aligned breakouts for higher probability setups
6. Set stop losses below the opposite side of the session range
## Settings
- **Session Times**: Customize AM and PM session times
- **EMA Lengths**: Adjust trend determination sensitivity
- **Visualization Options**: Toggle display of sessions, breakouts, and VWAP
- **Alert Settings**: Configure alerts for breakouts and trend-aligned conditions
This indicator is valuable for day traders and swing traders looking for objective entry points with higher probability of success.

TASC 2025.05 Trading The Channel█ OVERVIEW
This script implements channel-based trading strategies based on the concepts explained by Perry J. Kaufman in the article "A Test Of Three Approaches: Trading The Channel" from the May 2025 edition of TASC's Traders' Tips . The script explores three distinct trading methods for equities and futures using information from a linear regression channel. Each rule set corresponds to different market behaviors, offering flexibility for trend-following, breakout, and mean-reversion trading styles.
█ CONCEPTS
Linear regression
Linear regression is a model that estimates the relationship between a dependent variable and one or more independent variables by fitting a straight line to the observed data. In the context of financial time series, traders often use linear regression to estimate trends in price movements over time.
The slope of the linear regression line indicates the strength and direction of the price trend. For example, a larger positive slope indicates a stronger upward trend, and a larger negative slope indicates the opposite. Traders can look for shifts in the direction of a linear regression slope to identify potential trend trading signals, and they can analyze the magnitude of the slope to support trading decisions.
One caveat to linear regression is that most financial time series data does not follow a straight line, meaning a regression line cannot perfectly describe the relationships between values. Prices typically fluctuate around a regression line to some degree. As such, analysts often project ranges above and below regression lines, creating channels to model the expected extent of the data's variability. This strategy constructs a channel based on the method used in Kaufman's article. It measures the maximum distances from points on the linear regression line to historical price values, then adds those distances and the current slope to the regression points.
Depending on the trading style, traders might look for prices to move outside an established channel for breakout signals, or they might look for price action to reach extremes within the channel for potential mean reversion opportunities.
█ STRATEGY CALCULATIONS
Primary trade rules
This strategy implements three distinct sets of rules for trend, breakout, and mean-reversion trades based on the methods Kaufman describes in his article:
Trade the trend (Rule 1) : Open new positions when the sign of the slope changes, indicating a potential trend reversal. Close short trades and enter a long trade when the slope changes from negative to positive, and do the opposite when the slope changes from positive to negative.
Trade channel breakouts (Rule 2) : Open new positions when prices cross outside the linear regression channel for the current sample. Close short trades and enter a long trade when the price moves above the channel, and do the opposite when the price moves below the channel.
Trade within the channel (Rule 3) : Open new positions based on price values within the channel's range. Close short trades and enter a long trade when the price is near the channel's low, within a specified percentage of the channel's range, and do the opposite when the price is near the channel's high. With this rule, users can also filter the trades based on the channel's slope. When the filter is active, long positions are allowed only when the slope is positive, and short positions are allowed only when it is negative.
Position sizing
Kaufman's strategy uses specific trade sizes for equities and futures markets:
For an equities symbol, the number of shares traded is $10,000 divided by the current price.
For a futures symbol, the number of contracts traded is based on a volatility-adjusted formula that divides $25,000 by the product of the 20-bar average true range and the instrument's point value.
By default, this script automatically uses these sizes for its trade simulation on equities and futures symbols and does not simulate trading on other symbols. However, users can control position sizes from the "Settings/Properties" tab and enable trade simulation on other symbol types by selecting the "Manual" option in the script's "Position sizing" input.
Stop-loss
This strategy includes the option to place an accompanying stop-loss order for each trade, which users can enable from the "SL %" input in the "Settings/Inputs" tab. When enabled, the strategy places a stop-loss order at a specified percentage distance from the closing price where the entry order occurs, allowing users to compare how the strategy performs with added loss protection.
█ USAGE
This strategy adapts its display logic for the three trading approaches based on the rule selected in the "Trade rule" input:
For all rules, the script plots the linear regression slope in a separate pane. The plot is color-coded to indicate whether the current slope is positive or negative.
When the selected rule is "Trade the trend", the script plots triangles in the separate pane to indicate when the slope's direction changes from positive to negative or vice versa. Additionally, it plots a color-coded SMA on the main chart pane, allowing visual comparison of the slope to directional changes in a moving average.
When the rule is "Trade channel breakouts" or "Trade within the channel", the script draws the current period's linear regression channel on the main chart pane, and it plots bands representing the history of the channel values from the specified start time onward.
When the rule is "Trade within the channel", the script plots overbought and oversold zones between the bands based on a user-specified percentage of the channel range to indicate the value ranges where new trades are allowed.
Users can customize the strategy's calculations with the following additional inputs in the "Settings/Inputs" tab:
Start date : Sets the date and time when the strategy begins simulating trades. The script marks the specified point on the chart with a gray vertical line. The plots for rules 2 and 3 display the bands and trading zones from this point onward.
Period : Specifies the number of bars in the linear regression channel calculation. The default is 40.
Linreg source : Specifies the source series from which to calculate the linear regression values. The default is "close".
Range source : Specifies whether the script uses the distances from the linear regression line to closing prices or high and low prices to determine the channel's upper and lower ranges for rules 2 and 3. The default is "close".
Zone % : The percentage of the channel's overall range to use for trading zones with rule 3. The default is 20, meaning the width of the upper and lower zones is 20% of the range.
SL% : If the checkbox is selected, the strategy adds a stop-loss to each trade at the specified percentage distance away from the closing price where the entry order occurs. The checkbox is deselected by default, and the default percentage value is 5.
Position sizing : Determines whether the strategy uses Kaufman's predefined trade sizes ("Auto") or allows user-defined sizes from the "Settings/Properties" tab ("Manual"). The default is "Auto".
Long trades only : If selected, the strategy does not allow short positions. It is deselected by default.
Trend filter : If selected, the strategy filters positions for rule 3 based on the linear regression slope, allowing long positions only when the slope is positive and short positions only when the slope is negative. It is deselected by default.
NOTE: Because of this strategy's trading rules, the simulated results for a specific symbol or channel configuration might have significantly fewer than 100 trades. For meaningful results, we recommend adjusting the start date and other parameters to achieve a reasonable number of closed trades for analysis.
Additionally, this strategy does not specify commission and slippage amounts by default, because these values can vary across market types. Therefore, we recommend setting realistic values for these properties in the "Cost simulation" section of the "Settings/Properties" tab.

Weighted Ichimoku StrategyLSE:HSBA
The Ichimoku Kinko Hyo indicator is a comprehensive tool that combines multiple signals to identify market trends and potential buying/selling opportunities. My weighted variant of this strategy attempts to assign specific weights to each signal, allowing for a more nuanced and customizable approach to trend identification. The intent is to try and make a more informed trading decision based on the cumulative strength of various signals.
I've tried not to make it a mishmash of this and that + MACD + RSI and on and on; most people have their preferred indicator that focuses on just that that they can use in conjunction.
The signals used can be grouped into two groups the 'Core Ichimoku Signals' & the 'Additional Signals' (at the end you will find the signals and their assigned weights followed by the thresholds where they align).
The Core Ichimoku Signals are the primary signals used in Ichimoku analysis, including Kumo Breakout, Chikou Cross, Kijun Cross, Tenkan Cross, and Kumo Twist.
While the Additional Signals provide further insights and confirmations, such as Kijun Confirmation, Tenkan-Kijun Above Cloud, Chikou Above Cloud, Price-Kijun Cross, Chikou Span Signal, and Price Positioning.
Entries are triggered when the cumulative weight of bullish signals exceeds a specified buy threshold, indicating a strong uptrend or potential trend reversal.
Exits are initiated when the cumulative weight of bearish signals surpasses a specified sell threshold, or when additional conditions such as consolidation patterns or ATR-based targets are met.
There are various exit types that you can choose between, which can be used separately or in conjunction with one another. As an example you might want to exit on a different condition during consolidation periods than during other periods or just use ATR with some other backstop.
They are listed in evaluation order i.e. ATR trumps all, Consolidation exit trumps the regular Kumo sell and so on:
**ATR Sell**: Exits trades based on ATR-based profit targets and stop-losses.
**Consolidation Exit**: Exits trades during consolidation periods to reduce drawdown.
**Sell Below Kumo**: Exits trades when the price is below the Kumo, indicating a potential downtrend.
**Sell Threshold**: Exits trades when the cumulative weight of bearish signals surpasses a specified sell threshold.
There are various 'filters' which are really behavior modifiers:
**Kumo Breakout Filter**: Requires price to close above the Kumo for buy signals (essentially a entry delay).
**Whipsaw Filter**: Ensures trend strength over specified days to reduce false signals.
**Buy Cooldown**: Prevents new entries until half the Kijun period passes after an exit (prevents flapping).
**Chikou Filter**: Delays exits unless the previous close is below the Chikou Span.
**Consolidation Trend Filter**: Prevents consolidation exits if the trend is bullish (rare, but happens).
Then there are some debugging options. Ichimoku periods have some presets (personally I like 8/22/44/22) but are freely configurable, preset to the traditional values for purists.
The list of signals and most thresholds follow, play around with them. Thats all.
Cheers,
**Core Ichimoku Signals**
**Kumo Breakout**
- 30 (Bullish) / -30 (Bearish)
- Indicates a strong trend when the price breaks above (bullish) or below (bearish) the Kumo (cloud). This signal suggests a significant shift in market sentiment.
**Chikou Cross**
- 20 (Bullish) / -20 (Bearish)
- Shows the relationship between the Chikou Span (lagging span) and the current price. A bullish signal occurs when the Chikou Span is above the price, indicating a potential uptrend. Conversely, a bearish signal occurs when the Chikou Span is below the price, suggesting a downtrend.
**Kijun Cross**
- 15 (Bullish) / -15 (Bearish)
- Signals trend changes when the Tenkan-sen (conversion line) crosses above (bullish) or below (bearish) the Kijun-sen (base line). This crossover is often used to identify potential trend reversals.
**Tenkan Cross**
- 10 (Bullish) / -10 (Bearish)
- Indicates short-term trend changes when the price crosses above (bullish) or below (bearish) the Tenkan-sen. This signal helps identify minor trend shifts within the broader trend.
**Kumo Twist**
- 5 (Bullish) / -5 (Bearish)
- Shows changes in the Kumo's direction, indicating potential trend shifts. A bullish Kumo Twist occurs when Senkou Span A crosses above Senkou Span B, and a bearish twist occurs when Senkou Span A crosses below Senkou Span B.
**Additional Signals**
**Kijun Confirmation**
- 8 (Bullish) / -8 (Bearish)
- Confirms the trend based on the price's position relative to the Kijun-sen. A bullish signal occurs when the price is above the Kijun-sen, and a bearish signal occurs when the price is below it.
**Tenkan-Kijun Above Cloud**
- 5 (Bullish) / -5 (Bearish)
- Indicates a strong bullish trend when both the Tenkan-sen and Kijun-sen are above the Kumo. Conversely, a bearish signal occurs when both lines are below the Kumo.
**Chikou Above Cloud**
- 5 (Bullish) / -5 (Bearish)
- Shows the Chikou Span's position relative to the Kumo, indicating trend strength. A bullish signal occurs when the Chikou Span is above the Kumo, and a bearish signal occurs when it is below.
**Price-Kijun Cross**
- 2 (Bullish) / -2 (Bearish)
- Signals short-term trend changes when the price crosses above (bullish) or below (bearish) the Kijun-sen. This signal is similar to the Kijun Cross but focuses on the price's direct interaction with the Kijun-sen.
**Chikou Span Signal**
- 10 (Bullish) / -10 (Bearish)
- Indicates the trend based on the Chikou Span's position relative to past price highs and lows. A bullish signal occurs when the Chikou Span is above the highest high of the past period, and a bearish signal occurs when it is below the lowest low.
**Price Positioning**
- 10 (Bullish) / -10 (Bearish)
- Shows indecision when the price is between the Tenkan-sen and Kijun-sen, indicating a potential consolidation phase. A bullish signal occurs when the price is above both lines, and a bearish signal occurs when the price is below both lines.
**Confidence Level**: Highly Sensitive
- **Buy Threshold**: 50
- **Sell Threshold**: -50
- **Notes / Significance**: ~2–3 signals, very early trend detection. High sensitivity, may capture noise and false signals.
**Confidence Level**: Entry-Level
- **Buy Threshold**: 58
- **Sell Threshold**: -58
- **Notes / Significance**: ~3–4 signals, often Chikou Cross or Kumo Breakout. Very sensitive, risks noise (e.g., false buys in choppy markets).
**Confidence Level**: Entry-Level
- **Buy Threshold**: 60
- **Sell Threshold**: -60
- **Notes / Significance**: ~3–4 signals, Kumo Breakout or Chikou Cross anchors. Entry point for early trends.
**Confidence Level**: Moderate
- **Buy Threshold**: 65
- **Sell Threshold**: -65
- **Notes / Significance**: ~4–5 signals, balances sensitivity and reliability. Suitable for moderate risk tolerance.
**Confidence Level**: Conservative
- **Buy Threshold**: 70
- **Sell Threshold**: -70
- **Notes / Significance**: ~4–5 signals, emphasizes stronger confirmations. Reduces false signals but may miss some opportunities.
**Confidence Level**: Very Conservative
- **Buy Threshold**: 75
- **Sell Threshold**: -75
- **Notes / Significance**: ~5–6 signals, prioritizes high confidence. Minimizes risk but may enter trades late.
**Confidence Level**: High Confidence
- **Buy Threshold**: 80
- **Sell Threshold**: -80
- **Notes / Significance**: ~6–7 signals, very strong confirmations needed. Suitable for cautious traders.
**Confidence Level**: Very High Confidence
- **Buy Threshold**: 85
- **Sell Threshold**: -85
- **Notes / Significance**: ~7–8 signals, extremely high confidence required. Minimizes false signals significantly.
**Confidence Level**: Maximum Confidence
- **Buy Threshold**: 90
- **Sell Threshold**: -90
- **Notes / Significance**: ~8–9 signals, maximum confidence level. Ensures trades are highly reliable but may result in fewer trades.
**Confidence Level**: Ultra Conservative
- **Buy Threshold**: 100
- **Sell Threshold**: -100
- **Notes / Significance**: ~9–10 signals, ultra-high confidence. Trades are extremely reliable but opportunities are rare.
**Confidence Level**: Extreme Confidence
- **Buy Threshold**: 110
- **Sell Threshold**: -110
- **Notes / Significance**: All signals align, extreme confidence. Trades are almost certain but very few opportunities.

AI-123's BTC vs Gold (Lag Correlation)
DISCLAIMER
I made this indicator with the help of ChatGPT and using what I have learned so far from The Pine Script Mastery Course, LOTS of edits based on what I have learned so far had to be made as well as additions and modifications to my liking thanks to what I have learned so far. I am aware this already exists but I have done my best to make a first ever script/indicator while learning how to properly publish as well, so please bear that in mind.
Overview
This indicator analyzes the correlation between Bitcoin (BTC) and Gold (XAUUSD), with a customizable lag applied to the Gold price, providing insight into the macro relationship between these two assets.
It is designed for traders and investors who want to track how Bitcoin and Gold move in relation to each other, particularly when Gold is lagged by a specific number of days.
Key Features:
BTC and Gold (Lagged) Price Overlay: Display Bitcoin (BTC) and Gold (XAUUSD) prices on the chart, with an adjustable lag applied to the Gold price.
Rolling Correlation Calculation: Measures the correlation between Bitcoin and lagged Gold prices over a customizable lookback period.
Adjustable Lag: The number of days that Gold is lagged relative to Bitcoin is fully customizable (default: 20 days).
Customizable Correlation Length: Allows you to choose the lookback period for the correlation (default: 50 days), providing flexibility for short-term or long-term analysis.
Normalized Plotting: Prices of Bitcoin and Gold are normalized for better visual alignment with the correlation values. BTC is divided by 1000, and Gold by 100.
Correlation Scaling: The correlation value is amplified by 10 for better visual clarity and comparison with price data.
Zero Line: Horizontal line representing a correlation of 0, making it easier to identify positive or negative correlation shifts.
Maximum Correlation Lines: Horizontal lines at +10 and -10 values for extreme correlation scenarios.
Input Settings:
Gold Symbol: Customize the Gold ticker (default: OANDA:XAUUSD).
Bitcoin Symbol: Customize the Bitcoin ticker (default: BINANCE:BTCUSDT).
Lag (in trading days): Adjust the number of trading days to lag the Gold price relative to Bitcoin (default: 20).
Correlation Length (days): Set the number of days over which the rolling correlation is calculated (default: 50).
How to Use:
Price Comparison: The BTC (Spot) and Lagged Gold plots give you a side-by-side visual comparison of the two assets, normalized for clarity.
Correlation Line: The correlation line helps you gauge the strength and direction of the relationship between BTC and lagged Gold. Positive values indicate a strong positive correlation, while negative values indicate a negative correlation.
Visual Analysis: Watch how the correlation shifts with changes in lag and correlation length to identify potential market dynamics between Bitcoin and Gold.
Potential Applications:
Macro Trading: Track how Bitcoin and Gold behave in relation to each other during periods of economic uncertainty or inflation.
Sentiment Analysis: Use the correlation data to understand the sentiment between digital and traditional assets.
Strategic Timing: Identify potential opportunities where Bitcoin and Gold show a strong correlation or diverge based on the lag adjustment.
Understanding Macro Trends/Correlations.
Disclaimer:
This indicator is for informational purposes only. The correlation between Bitcoin and Gold does not guarantee future performance, and users should conduct their own research and use risk management strategies when making trading decisions.
Notes: This script uses historical data, so results may vary across different timeframes.
Customization options allow users to adjust the lag and correlation length to better fit their trading strategy.
Future Enhancements: Additional Correlation Line: A second correlation line for different lengths of lag or different assets.
Color-Coding of Correlation: Future updates may include color-coded correlation strength, visually indicating positive or negative correlation more effectively.

Triple Confirmation Scalper v2 - Alarm CompatibleTriple Confirmation Scalper Strategy
A high-probability scalping strategy combining trend momentum, overbought/sold conditions, and volume confirmation to filter low-noise signals.
📊 Strategy Logic
Trend Direction
Dual EMA crossover (9 & 21 periods) for momentum and trend bias.
Overbought/Oversold Zones
RSI (14-period) to avoid entries at extremes.
Volume Spike Filter
OBV + 20-period volume average to confirm breakout validity.
Dynamic Risk Management
Stop-loss: Adaptive to recent price action (5-candle low/high ±1%).
Take-profit: 1.5% target (1.5:1 risk/reward).
🔍 Advanced Features
Precision VWAP (20-period, HLC3-based) for dynamic S/R levels.
Visual Aids:
EMA/VWAP bands + trend-colored background.
Volume spike alerts.
TradingView Alerts pre-configured for long/short signals.
⚙️ Default Settings
Commission: 0.1% factored into backtests.
Mode: Supports both long/short positions.
⚠️ Disclaimer
This is a technical analysis tool, not financial advice.
Past performance ≠ future results. Test thoroughly in a demo account.
Adjust parameters (e.g., EMA periods, RSI thresholds) to match your risk tolerance.
✅ TradingView Compliance Notes:
No exaggerated claims (e.g., "100% win rate").
Clear disclaimer included.
Focus on objective strategy logic (no promotional language).

Balancelink : Partition Function 1.0This script computes the partition function values 𝑝(𝑛) using Euler’s Pentagonal Number Theorem and displays them in a horizontally wrapped table directly on the chart. The partition function is a classic function in number theory that counts the number of ways an integer 𝑛 can be expressed as a sum of positive integers, disregarding the order of the summands.
Key Features
Efficient Calculation:
The script computes 𝑝(𝑛) for all orders from 0 up to a user-defined maximum (set by the "End Order" input). The recursive computation leverages Euler’s Pentagonal Number Theorem, ensuring the function is calculated correctly for each order.
Display Range Selection:
Users can select a specific range of orders (for example, from 𝑛 = 100 to 𝑛 = 200 to display.) This means you can focus on a particular segment of the partition function results without cluttering the chart.
Horizontally Wrapped Table:
The partition values are organized into a clean, horizontal table with a customizable number of columns per row (default is 20). When the number of values exceeds the maximum columns, the table automatically wraps onto a new set of rows for better readability.
Medium Text Size:
The table cells use a medium (normal) text size for easy viewing and clarity.
How to Use
Inputs:
Start Order (n): The starting index from which you want to display the partition function (default is 100).
End Order (n): The ending index up to which the partition function values will be displayed (default is 200).
Max Columns Per Row: Determines how many results are shown per row before wrapping to the next (default is 20).
Calculation:
The script calculates all 𝑝(𝑛) values from 0 up to the specified "End Order". It then extracts and displays only the values in the chosen range.
Visualization:
The computed values are shown in a neatly arranged table at the top right of your TradingView chart, making it simple to scroll through and inspect the partition function values.
Use Cases
Educational & Research:
Ideal for educators and students exploring concepts of integer partitions and number theory.
Data Analysis & Pattern Recognition:
Useful for those interested in the behavior and growth of partition numbers as 𝑛 increases.

Fractal Pattern AnalysisFractal Pattern Key Elements and How to Read Them
1. Williams Fractals (Triangle Markers)
Red Triangles Pointing Down: Bearish fractals - potential resistance points and selling opportunities
Green Triangles Pointing Up: Bullish fractals - potential support points and buying opportunities
When to Act: Look for bullish fractals forming during uptrends and bearish fractals during downtrends
2. Moving Averages
Yellow Line (20 EMA): Short-term trend
Blue Line (50 EMA): Medium-term trend
Red Line (200 EMA): Long-term trend
Interpretation: When shorter MAs cross above longer MAs, it's bullish; when they cross below, it's bearish
Key Signal: The alignment of all three MAs (stacked in order) confirms a strong trend
3. Background Color
Green Background: Uptrend (all MAs aligned bullishly)
Red Background: Downtrend (all MAs aligned bearishly)
Yellow Background: Sideways/neutral market (MAs not clearly aligned)
4. Market Structure Markers (Small Circles)
Green Circles: Higher highs and higher lows (bullish structure)
Red Circles: Lower highs and lower lows (bearish structure)
Pattern Recognition: Multiple green circles suggest continuing uptrend; multiple red circles suggest continuing downtrend
5. Reversal Diamonds ("Rev" Markers)
Yellow Diamonds: Potential trend reversal points
Usage: These mark where the current trend might be changing direction
Confirmation: Wait for price to close beyond the diamond before acting
6. Bollinger Bands (Blue Lines with Fill)
Middle Band: 20-period SMA
Upper/Lower Bands: Volatility channels
Signals: Price touching upper band in uptrend is strength; touching lower band in downtrend is weakness
Squeeze: When bands narrow, expect a volatility breakout soon
7. Status Table (Top Right)
Shows current trend, volume direction, and overall signal at a glance
"BUY" signal appears when multiple bullish conditions align
"SELL" signal appears when multiple bearish conditions align

RSI VWAP POC [Uncle Sam Trading]Category: Oscillators, Volume, Market Profile
Timeframe: Suitable for all timeframes
Markets: Crypto, Forex, Stocks, Commodities
Overview
The RSI VWAP POC indicator is a powerful and innovative oscillator that combines the Relative Strength Index (RSI), Volume-Weighted Average Price (VWAP), and Point of Control (POC) from market profile analysis. Designed to provide traders with clear, high-probability trading signals, this indicator helps you identify key market levels, spot overbought/oversold conditions, and time your entries and exits with precision. Whether you’re a day trader, swing trader, or scalper, this free tool adds significant value to your trading strategy by offering a unique blend of momentum, volume, and market profile insights.
How It Works
This indicator integrates three core components to deliver actionable insights:
RSI (Relative Strength Index): Measures momentum to identify overbought (above 70) and oversold (below 30) conditions, helping you anticipate potential reversals.
VWAP (Volume-Weighted Average Price): Calculates a volume-weighted price benchmark, which is used to compute a more accurate, volume-sensitive RSI. This ensures the indicator reflects true market dynamics.
POC (Point of Control): Derived from market profile analysis, the POC represents the price level with the highest traded volume in a session, acting as a critical support or resistance level.
The indicator plots a smoothed RSI based on VWAP, overlaid with market profile data on a user-defined higher timeframe (default: 4H). The POC is displayed as a red line, with aqua bars indicating the value area where the majority of trading volume occurred. When the RSI crosses the POC, the indicator generates clear buy and sell signals:
Strong Buy (SBU): RSI crosses above the POC in an oversold zone.
Strong Sell (SBD): RSI crosses below the POC in an overbought zone.
Additional features include:
Background colors to highlight bullish (green) or bearish (red) trends.
Shaded zones for overbought (70/60) and oversold (30/40) levels.
Customizable settings to fit your trading style and timeframe.
How This Indicator Adds Value
The RSI VWAP POC indicator offers several key benefits that enhance your trading performance:
High-Probability Signals: By combining RSI, VWAP, and POC, this indicator identifies trades at key market levels where price is likely to react, increasing your win rate.
Improved Timing: Clear buy and sell signals, such as ‘SBU’ and ‘SBD’, help you enter and exit trades at optimal points, maximizing profitability.
Risk Management: Overbought/oversold zones and trend confirmation via background colors help you avoid false signals, protecting your capital.
Versatility: Suitable for all markets (crypto, forex, stocks) and timeframes, making it a valuable tool for traders of all experience levels.
Time Efficiency: The indicator does the heavy lifting by analyzing momentum, volume, and market profile data, allowing you to focus on executing trades.
Real-World Performance Example: On a 1-hour Bitcoin chart with a 4-hour higher timeframe, this indicator identified a strong sell signal on April 6th at 12:00 ($82,000), leading to a 9% drop to $74,600. A subsequent strong buy signal on April 7th at 04:00 ($76,200) captured a 6% rise to $81,200 – a potential 25% profit with 5x leverage if exited at 5%.
How to Use
Add the Indicator: Search for “RSI VWAP POC ” in TradingView’s indicator library and add it to your chart.
Set Your Timeframe: The indicator works on any timeframe but is optimized for a 1-hour chart with a 4-hour higher timeframe (set in the settings).
Interpret Signals:
Look for ‘SBU’ (strong buy) labels when the RSI crosses above the POC in an oversold zone, indicating a potential buying opportunity.
Look for ‘SBD’ (strong sell) labels when the RSI crosses below the POC in an overbought zone, signaling a potential selling opportunity.
Use the background colors (green for bullish, red for bearish) to confirm the trend.
Combine with Your Strategy: Use the indicator alongside your existing analysis (e.g., support/resistance, candlestick patterns) for best results.
Settings and Customization
The indicator is highly customizable to suit your trading needs:
RSI Length (Default: 14): Adjust the sensitivity of the RSI. Use a shorter length (e.g., 10) for scalping, or a longer length (e.g., 20) for smoother signals.
EMA Smoothing Length (Default: 3): Smooths the RSI line. Increase to 5 or 7 for less choppy signals in volatile markets.
Higher Timeframe (Default: 240 minutes): Set to 240 (4 hours) for a 1-hour chart. Adjust based on your chart’s timeframe (e.g., 60 minutes for a 15-minute chart).
Value Area Percentage (Default: 100%): Defines the size of the value area around the POC. Lower to 70% for a tighter focus on key levels.
Overbought/Oversold Thresholds (Defaults: 70/30): Adjust these levels to match market conditions (e.g., 80/20 for trending markets).
Show POC Line (Default: True): Toggle the red POC line on or off.
Show Buy/Sell Signals: Enable ‘Show Strong Breakup Signals’ and ‘Show Strong Breakdown Signals’ to focus on high-probability trades.
Why Choose This Indicator?
The RSI VWAP POC indicator stands out by offering a unique combination of momentum, volume, and market profile analysis in a single, easy-to-use tool. It’s designed to help traders of all levels make informed decisions, reduce risk, and increase profitability. Whether you’re trading Bitcoin, forex pairs, or stocks, this indicator provides the clarity and precision you need to succeed.

RSI + MA + Divergence + SnR + Price levelOverview
This indicator combines several technical analysis tools to give traders a comprehensive view based on the RSI indicator. Its main features include:
RSI & Moving Averages on RSI:
RSI: Calculates the RSI based on the closing price (or a user-selected source) with a configurable period (default is 14).
EMA and WMA: Computes and plots an Exponential Moving Average (EMA with a period of 9) and a Weighted Moving Average (WMA with a period of 45) on the RSI, helping to smooth out signals and better identify trends.
Price Ladder Based on RSI:
Draws horizontal lines at specified target RSI levels (from targetRSI1 to targetRSI7, default levels ranging from 20 to 80).
Calculates a target price based on the price change relative to the averaged gains and losses, providing an estimated price level when the RSI reaches those critical levels.
Divergence Detection:
Identifies divergence between price and RSI:
Bullish Divergence: Detected when the price forms a lower low but RSI fails to confirm with a corresponding lower low, with the RSI falling under a configurable threshold (d_below).
Bearish Divergence: Detected when the price forms a higher high while the RSI does not, with the RSI exceeding a configurable upper threshold (d_upper).
Optionally displays labels on the chart to alert the trader when divergence signals are detected.
Auto Support & Resistance on RSI:
Automatically calculates and plots support and resistance lines based on the RSI over different lookback periods (e.g., 34, 89, 200 bars).
Helps traders identify key RSI levels where price reversals or breakouts might occur.
Benefits for the Trader
This indicator is designed to assist traders in their decision-making process by integrating multiple technical analysis elements:
Identifying Market Trends:
By combining the RSI with its moving averages (EMA, WMA), traders can better assess market trends and the strength of these trends, thereby improving trade entry accuracy.
Early Reversal Signals via Divergence:
Divergence signals (both bullish and bearish) can help forecast potential reversals in the market, allowing traders to adjust their strategies timely.
Determining RSI-Based Support/Resistance Levels:
Automatic identification of support and resistance levels on the RSI provides key areas where a price reversal or breakout may occur, assisting traders in setting stop-loss and take-profit levels strategically.
Price Target Forecasting with the Price Ladder:
The target price labels calculated at important RSI levels provide insights into potential price objectives, aiding in risk management and profit planning.
Flexible Configuration:
Traders can customize key parameters such as the RSI period, lengths for EMA and WMA, target RSI levels, divergence conditions, and support/resistance settings. This flexibility allows the indicator to adapt to different trading styles and strategies.
How to read data
Some use-cases
Used to estimate price according to the RSI level.
When you trade using RSI, you want to set your stop-loss or take-profit levels based on RSI. By looking at the price ladder, you know the corresponding price level to enter a trade.
Used to determine the entry zone.
RSI often reacts to its own previously established support/resistance levels. Use the Auto SnR feature to identify those zones.
Used to determine the trend.
RSI and its moving averages help identify the price trend:
Uptrend: 3 lines separate and point upward.
Downtrend: 3 lines separate and point downward.
Use WMA45 to determine the trend:
Uptrend: WMA45 is moving upward or trading above the 50 level.
Downtrend: WMA45 is moving downward or trading below the 50 level.
Sideways: WMA45 is trading around the 50 level.
Use EMA9 to confirm the trend: A crossover of EMA9 through WMA45 confirms the formation of a new trend.
Configuration
The script allows users to configure a number of important parameters to suit their analytical preferences:
RSI Settings:
RSI Length (rsiLengthInput): The number of periods used to compute the RSI (default is 14, adjustable as needed).
RSI Source (rsiSourceInput): Select the price source (default is the closing price).
RSI Color (rsiClr): The color used to display the RSI line.
Moving Averages on RSI:
EMA Length (emaLength): The period for calculating the EMA on RSI (default is 9).
WMA Length (wmaLength): The period for calculating the WMA on RSI (default is 45).
EMA Color (emaClr) and WMA Color (wmaClr): Customize the colors of the EMA and WMA lines.
Price Ladder Settings:
Toggle Price Ladder (showPrice): Enable or disable the display of the price ladder.
Target RSI Levels: targetRSI1 through targetRSI7: RSI values at which target prices are calculated (default values range from 20, 30, 40, 50, 60, 70 to 80).
Price Label Color (priceColor): The text color for displaying the target price labels.
Divergence Settings:
Divergence Toggle (calculateDivergence): Option to enable or disable divergence calculation and display.
Divergence Conditions:
d_below: RSI level below which bullish divergence is considered.
d_upper: RSI level above which bearish divergence is considered.
Display Divergence Labels (showDivergenceLabel): Option to display labels on the chart when divergence is detected.
Auto Support & Resistance on RSI:
Toggle Auto S&R (enableAutoSnR): Enable or disable automatic plotting of support and resistance levels.
Lookback Periods for Support/Resistance:
L1_lookback: Lookback period for level 1 (e.g., 34 bars).
L2_lookback: Lookback period for level 2 (e.g., 89 bars).
L3_lookback: Lookback period for level 3 (e.g., 200 bars).
Support and Resistance Colors:
rsiSupportClr: Color for the support line.
rsiResistanceClr: Color for the resistance line.
Alerts:
Divergence Alerts: Alert conditions are set up to notify the trader when bullish or bearish divergence is detected, aiding in timely decision-making.

Pino Trend Pack (SMA/EMA + Bollinger)🔹 Pino Trend Pack is a compact trend-following and volatility indicator that includes:
📈 Moving Averages:
- SMA 10, SMA 30
- EMA 21, EMA 55, EMA 89
(All configured for short-term to mid-term trend analysis by default, but fully adjustable for user preference.)
📊 Bollinger Bands:
- Period: 20
- Standard Deviation: 2.0
- Includes Upper Band, Lower Band, and Basis (SMA 20)
This pack is designed for traders who want a clean visual of price dynamics across multiple short-term trend layers, combined with volatility tracking. It helps you identify compression, expansion, and trend shifts at a glance.
🧠 Ideal for swing trading, short- to mid-term setups, or as a supporting tool in any confluence-based strategy.

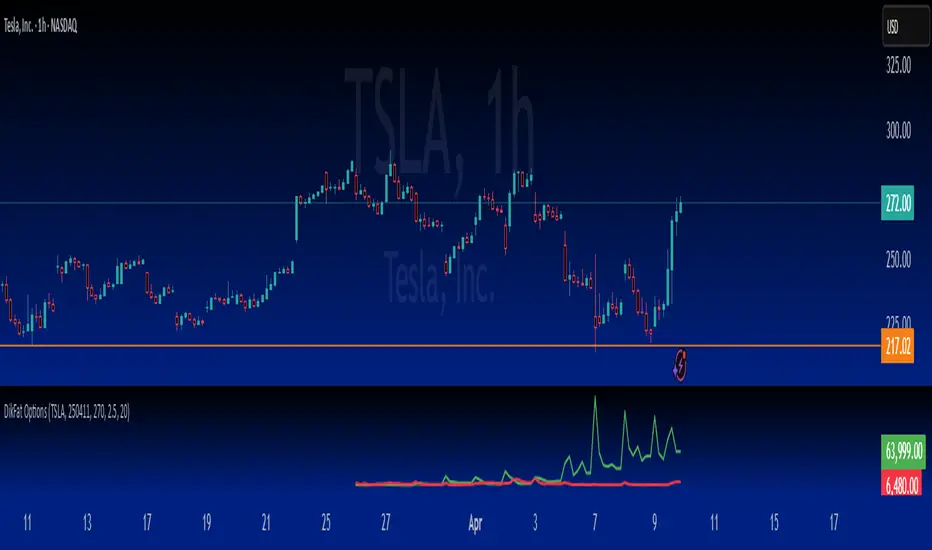
Unusual Whale - Unusual Options Volume Data ScreenerHow to Use:
Custom Expiration Date: Use the calendar/date picker to select the expiration date. The chosen date is automatically converted to the "YYMMDD" format.
Custom Base Strike: Enter a round strike value from the options chain (for example, "270"). This value serves as the starting point (at-the-money) for the scan.
Strike Increment: Select the increment (e.g., 0.50, 1.00, 2.5, 5, or 10) to determine how the scan moves outward from the custom base strike.
Options per Side (Max 20): Choose the number of valid option strikes to scan on each side. The script scans downward (for calls) and upward (for puts) from the custom base strike.
Base Symbol: The base symbol is always taken from the chart (using syminfo.ticker); no manual entry is needed.
Scanning & Aggregation: The script automatically constructs option symbols using the base symbol, custom expiration date, option type (C or P), and the formatted strike. It retrieves volume data for these options and aggregates the cumulative volume for calls and puts separately.
Plotting: Cumulative call volume is plotted in green, and cumulative put volume is plotted in red—only if the required number of valid options is found.
Benefits of Scanning Options Volume for Unusual Activity:
Offers a comprehensive view of volume across multiple strikes, making unusual or extreme volume patterns easier to detect.
Helps gauge market sentiment by comparing aggregated call and put volumes, which may signal shifts in investor behavior.
Aggregating volume from several strike levels provides smoother, more reliable data than using a single strike, enhancing your analytical insights.
What to Do If Combinations Don't Yield Results:
Verify Your Inputs: Ensure that the Custom Base Symbol, Expiration Date, and Custom Base Strike are entered correctly and correspond to an active options chain.
Adjust Strike Increment: If the options aren’t loading as expected, try selecting a different strike increment that more closely matches the spacing in your options chain.
Reduce Options per Side: Lower the number of Options per Side (e.g., from 20 to a lower value) if the scan fails to find enough valid strikes.
Review Your Options Chain: Confirm that the contracts for the specified expiration and strike range exist and are available in your data feed.
Check Data Subscription: Make sure your TradingView plan includes access to the options data required for the selected symbols.
Cumulative Call Volume is Green, Put Volume is Red
Dynamic Volume Profile PoC SwiftedgeOverview
The Dynamic Volume Profile PoC is a powerful and visually intuitive indicator designed to help traders identify key support and resistance levels using a unique combination of pivot points, volume analysis, and dynamic Point of Control (PoC) levels. This script overlays directly on your chart, providing clear visual cues for potential breakout and rejection zones, making it easier to spot high-probability trading opportunities.
What It Does
This indicator combines three core components to deliver actionable insights:
Pivot Points: Identifies significant swing highs and lows to establish potential support and resistance levels.
Volume Oscillator: Measures volume momentum to confirm the strength of price movements, ensuring that breakouts or rejections are backed by significant volume.
Dynamic Point of Control (PoC): Calculates the midpoint between consecutive pivot points to create dynamic PoC levels, which act as key areas where price is likely to either break through (breakout) or reverse (rejection).
These components work together to highlight critical price levels where the market is likely to react, giving traders a clear framework for decision-making.
How It Works
Pivot Detection: The script uses pivot highs and lows (based on user-defined Left Bars and Right Bars) to identify significant price levels. These pivots form the foundation for calculating PoC levels.
PoC Calculation: Each time a new pivot is detected, the script calculates the midpoint between the current pivot and the previous pivot, creating a dynamic PoC level. These levels are plotted as horizontal lines on the chart, with a maximum of Max PoC Lines to Show (default: 2) visible at any time.
Volume Confirmation: A volume oscillator (short EMA of volume minus long EMA of volume) is used to filter breakouts and rejections. Breakouts or rejections are only signaled if the volume oscillator exceeds the Volume Threshold (default: 20), ensuring that price movements are supported by strong volume.
Visual Cues:
PoC levels are drawn as cyan lines with optional semi-transparent zones (controlled by Show PoC Zones). These zones are colored green for potential breakouts (price above PoC) and red for potential rejections (price below PoC).
Labels above and below each PoC level indicate trading opportunities: "Long if breakout"/"Long if rejected" (green) and "Short if breakout"/"Short if rejected" (red), depending on the price's direction relative to the PoC.
Break signals ("B") are plotted above or below bars when price crosses a pivot level with sufficient volume, colored red for downward breaks and green for upward breaks.
How to Use
Add the Indicator: Add the "Dynamic Volume Profile PoC " to your chart in TradingView.
Adjust Settings:
Left Bars and Right Bars (default: 15): Control the sensitivity of pivot detection. Lower values make the script more sensitive to smaller price swings.
Volume Threshold (default: 20): Set the minimum volume oscillator value required to confirm breakouts or rejections. Increase this for stricter confirmation.
Max PoC Lines to Show (default: 2): Define how many PoC levels are displayed at once.
Show PoC Zones (default: true): Toggle semi-transparent zones around PoC levels for better visualization.
Label Spacing Factor (default: 0.5): Adjust the vertical spacing between labels and the PoC box. Increase this value (e.g., to 1.0 or 2.0) for more spacing, or decrease it (e.g., to 0.3) for less.
Interpret the Signals:
Look for PoC levels (cyan lines) as key areas of interest.
Use the labels to identify potential trades: "Long if breakout" indicates a buy opportunity if price breaks above the PoC, while "Short if rejected" suggests a sell if price fails to break through.
Watch for "B" signals to confirm breakouts or rejections with volume support.
Combine with Your Strategy: Use the PoC levels and break signals as part of your broader trading strategy, such as trend-following or mean-reversion setups.
Why This Script is Unique
The Dynamic Volume Profile PoC stands out by combining pivot points, volume analysis, and dynamic PoC levels into a single, cohesive tool. Unlike traditional volume profile indicators that require a fixed range, this script dynamically updates PoC levels based on recent price action, making it more responsive to current market conditions. The addition of volume confirmation ensures that signals are backed by market participation, reducing false breakouts. The visually appealing design, with customizable spacing and semi-transparent zones, makes it easy to interpret key levels at a glance, even for traders unfamiliar with Pine Script.
Notes
This script works best on timeframes where pivot points are meaningful (e.g., 1H, 4H, or daily charts).
Adjust the Label Spacing Factor to ensure labels are well-spaced for your chart's zoom level and instrument.
For instruments with high volatility, you may need to increase the Volume Threshold to filter out noise.

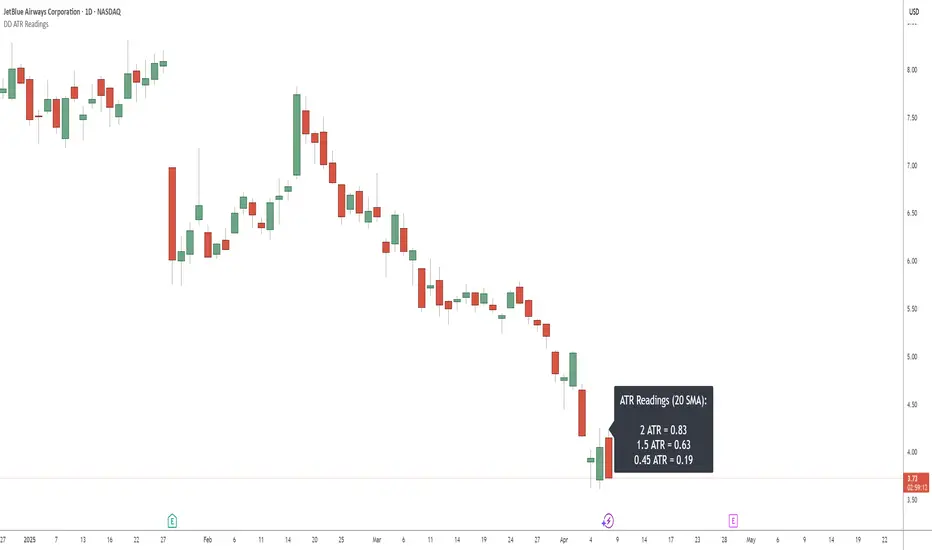
DD ATR ReadingsThe DD ATR Readings indicator displays customizable Average True Range (ATR) multiplier values directly on your chart. Unlike standard ATR indicators that only show a line, this indicator calculates and displays the exact numeric values for three different ATR multipliers, giving you precise volatility measurements for your trading decisions.
It's specifically created for people taking the "Deep Dip Buy" stock trading course, and attempts to provide a ready-to-go solution to allow easy position size calculations as per the course, with the required ATR values visible at a glance.
The default values of 2.0, 1.5 and 0.45 are the same values used by the course instructor in his charting software, but you can change these values to any multiplier you choose.
Any input from students or the instructor is welcome to improve this indicator so it offers more value to those looking to learn how to trade.
Features
Displays three customizable ATR multiplier values (default: 2.0, 1.5, and 0.45 from the course)
Uses either SMA or EMA for ATR calculation (20-period default)
Fully customizable label appearance (position, color, size)
Real-time value updates as you move through the chart
Clean, unobtrusive display that doesn't clutter your chart with additional lines
Customization Options
ATR Length: Number of bars used in the ATR calculation (default: 20)
ATR Multipliers: Three customizable multiplier values
SMA/EMA: Choose your preferred moving average type for ATR calculation
Label Style: Multiple positioning options for the text display
Colors and Size: Fully customizable appearance
RSI + ADX + ATR Combo Indicator: RSI + ADX + ATR Combo Filter
This indicator is a confluence filter tool that combines RSI, ADX, and ATR into a single, easy-to-read chart overlay. It is designed to help traders identify low-volatility, non-trending zones with balanced momentum—ideal for strategies that rely on breakouts or reversals.
🔍 Core Components:
RSI (Relative Strength Index)
Standard RSI with custom upper and lower bounds (default: 60 and 40).
Filters out extreme overbought/oversold regions and focuses on price consolidation zones.
ADX (Average Directional Index)
Measures trend strength.
When ADX is below a custom threshold (default: 20), it indicates a weak or range-bound trend.
ATR (Average True Range)
Represents volatility.
Low ATR values (default threshold: 2.5) are used to filter out high-volatility environments, helping refine entries.
🟣 Signal Logic:
A signal is highlighted with a background color when all three conditions are met:
RSI is between lower and upper bounds (e.g., 40 < RSI < 60) ✅
ADX is below the trend threshold (e.g., ADX < 20) ✅
ATR is below the volatility threshold (e.g., ATR < 2.5) ✅
These combined conditions suggest a low-volatility, low-trend strength, and balanced momentum zone—perfect for anticipating breakouts or strong directional moves.

Statistical OHLC Projections [neo|]█ OVERVIEW
Statistical OHLC Projections is an indicator designed to offer users a customizable deep-dive on measuring historical price levels for any timeframe. The indicator separates price into two distinct levels, "Manipulation" and "Distribution", where the idea is that for higher timeframe candles, e.g. an up-close candle, the distance from the open to the bottom of the wick would constitute the Manipulation, and the rest would be considered the Distribution. By measuring out these levels, we can gain insight on how far the market may move from higher timeframe opens to their manipulations and distributions, and apply this knowledge to our analysis.
IMPORTANT: Since levels are based on the lookback available on your chart, if the levels aren't being displayed this likely means you don't have enough lookback for your selected timeframe. To check this, enable the stat table to see how many values are available for your timeframe, and either reduce the lookback or increase your chart timeframe.
█ CONCEPTS
The core concept revolves around understanding market behavior through the lens of historical candle structure. The indicator dissects OHLC data to provide statistical boundaries of expected price movement.
- Manipulation Levels: These represent the areas typically seen as liquidity grabs or false moves where price extends in one direction before reversing.
- Distribution Levels: These highlight where the bulk of directional movement tends to occur, often following the manipulation move.
The tool aggregates this data across your selected timeframe to inform you of potential levels associated with it.
█ FEATURES
Multiple Display Types: Display statistical data through two sleek styles, areas or lines. Where areas represent the area between two customizable lookback values, and lines represent one average value.
Adjustable Timeframe Selection: Whether you want to see data based on the 1D chart, or the 1W chart, anything is possible. Simply change the timeframe on the dropdown menu and if there is sufficient lookback the indicator will adjust to your requested timeframe.
Customizable Historical Lookback: By default, the indicator will measure the average 60 values of your requested timeframe, however this may be adjusted to be higher or lower based on your preference. If you want to measure recent moves, 10-20 lookback may be better for you, or if you want more data for less volatile instruments, a value of 100 may be better.
Historical Display: Prevent historical levels from being removed by unchecking the "Remove Previous Drawings" option, this will allow you to examine how the levels previously interacted with price.
NY Midnight Anchoring: By checking the "Use NY Midnight" option, you may see the projection anchored to the New York midnight open time, which is often a significant level on indices.
Alerts: You may enable alerts for any of the indicator's provided levels to stay informed, even when off the charts.
█ How to use
To use the indicator, simply apply it to your chart and modify any of your desired inputs.
By default, the indicator will provide levels for the "1D" timeframe, with a desired lookback of 60, on most instruments and plans this can be gotten when you are on the 30 minute timeframe or above.
When price reaches or extends beyond a manipulation level, observe how it reacts and whether it rejects from that level, if it does this may be an indication that the candle for the timeframe you selected may be reversing.
█ SETTINGS AND OPTIONS
Customize the indicator’s behavior, timeframe sources, and visual appearance to fit your analysis style. Each setting has been designed with flexibility in mind, whether you're working on lower or higher timeframes.
Display Mode: Switch between different display styles for levels: - Default: Shows all statistical levels as individual lines.
- Areas: Plots filled zones between two customizable lookbacks to represent the range between them.
This is ideal for visually mapping high-probability zones of price activity.
Timeframe Settings:
- Show First/Second Timeframe: Choose to show one or both timeframe projections simultaneously.
- First Timeframe / Second Timeframe: Define the higher timeframe candle you want to base calculations on (e.g., 1D, 1W).
- Use NY Midnight: When enabled and using the daily timeframe, the levels will be anchored to the New York Midnight Open (00:00 EST), a key institutional timing reference, especially useful for indices and forex.
Calculation Settings:
- Main Lookback Period: The number of historical candles used in the statistical calculations. A lower number focuses on recent price action, while a higher number smooths results across broader history.
- First Lookback / Second Lookback: Used when “Areas” mode is selected to define the range of the shaded zone. For example, an area from 20 to 60 candles creates a band between short- and long-term price behavior averages.
Visual Settings:
- Line Style: Set your preferred visual style: Solid, Dashed, or Dotted.
- Remove Previous Drawings: When enabled, only the most recent projection is shown on the chart. Disable to retain previous levels and visually backtest their reactions over time.
Color Settings:
Customize each level independently to match your chart theme:
- Manipulation High/Low
- Distribution High/Low
- Open Level
- Label Text Color
Premium/Discount Zones:
- Enable Premium/Discount Zones: Overlay price zones above and below equilibrium to visualize potential overbought (premium) and oversold (discount) areas.
- Premium/Discount Colors: Fully customizable zone colors for clarity and emphasis.
Table Settings:
- Show Statistics Table: Adds an on-chart table summarizing key levels from your active timeframe(s).
- Table Cell Color: Set the background color of the table cells for visibility.
- Table Position: Choose from preset chart locations to position the table where it works best for your layout.
Alerts:
Stay on top of price interactions with key levels even when you're away from the charts.
- Manipulation Hits (High)
- Manipulation Hits (Low)
- Distribution Hits (High)
- Distribution Hits (Low)

Sahid Strategy v2This script identifies potential buy/sell signals using:
Pivot Points - Detects swing highs/lows (price reversals)
Confirmation Filters - Reduces false signals using:
RSI (momentum)
Moving Average (trend direction)
Optional MACD (trend confirmation)
Key Features
Signal Type Trigger Conditions
BUY - Price makes a swing low (pivot)
Copy
- RSI ≤ 30 (oversold)
- Price above trend MA
- MACD bullish (optional) |
| SELL | - Price makes a swing high (pivot)
- RSI ≥ 70 (overbought)
- Price below trend MA
- MACD bearish (optional) |
Visual Signals
Green "BUY" labels below price bars
Red "SELL" labels above price bars
Purple trend line (20-period EMA/SMA)
Orange/blue circles showing raw pivot points
Optional Tools
Debug Table (top-right): Shows real-time:
RSI value
Price vs MA position
MACD status
Alerts - Triggers audible/visual notifications
Customization
Adjust in settings:
Pivot sensitivity (left/right bars)
RSI levels (30/70 by default)
MA type/length (20-period EMA/SMA)
Toggle MACD filter on/off
Best For: Swing trading in trending markets (1H-4H timeframes). Signals appear faster than classic pivot strategies but still require confirmation from other analysis tools.
NasyI## NasyI - Multi-Timeframe Technical Analysis Toolkit
### English Description
**NasyI** is a comprehensive technical analysis indicator designed to provide traders with a complete view of market dynamics across multiple timeframes. This indicator combines the power of Exponential Moving Averages (EMAs), Simple Moving Averages (MAs), Volume Weighted Average Price (VWAP), and key support/resistance levels to help traders identify trend direction, potential reversal points, and optimal entry/exit opportunities.
#### Key Features
1. **Multi-Timeframe Analysis System**
- 2-minute EMAs (13, 48) for ultra-short-term trend identification
- 5-minute EMAs (9, 13, 21, 48, 200) for short-term trend confirmation
- Daily EMAs (5, 13, 21, 48, 100, 200) and MAs (20, 50, 100, 200) for longer-term perspective
- Color-coded bands between key EMAs to visually identify trend strength and direction
2. **Advanced VWAP Integration**
- Daily VWAP for intraday support/resistance
- Weekly VWAP for medium-term price reference
- Monthly VWAP for long-term institutional price levels
- All VWAPs properly reset at their respective time period boundaries
3. **Critical Price Level Identification**
- Previous day high/low lines for identifying key breakout and breakdown levels
- Pre-market high/low tracking to identify potential intraday support/resistance zones
- All levels displayed with distinct line styles for easy identification
4. **Dynamic Trend Analysis**
- Color-coded bands between EMAs display trend strength and direction:
- Green bands indicate uptrend conditions (9 EMA > 21 EMA > 48 EMA)
- Red bands indicate downtrend conditions (9 EMA < 21 EMA < 48 EMA)
- Yellow bands indicate neutral/confused market conditions
- Visual representation makes trend changes immediately apparent
5. **Comprehensive Customization Options**
- Fully customizable colors for all indicators and bands
- Adjustable transparency settings for visual clarity
- Optional price labels with customizable placement and appearance
- Ability to show/hide specific components based on trading preferences
#### Trading Applications
This indicator is particularly valuable for:
1. **Day Trading & Scalping**: The 2-minute and 5-minute EMAs with color bands provide clear short-term trend direction and potential reversal signals.
2. **Swing Trading**: Daily EMAs and MAs offer perspective on the larger trend, helping to align short-term trades with the broader market direction.
3. **Gap Trading**: Previous day and pre-market levels help identify potential gap fill scenarios and breakout/breakdown opportunities.
4. **VWAP Trading Strategies**: Multiple timeframe VWAPs allow for identifying institutional participation levels and potential reversal zones.
5. **EMA Cross Systems**: The various EMAs can be used to identify golden crosses and death crosses across multiple timeframes.
#### How the Components Work Together
The power of NasyI comes from the integration of these different technical elements:
1. The short-timeframe EMAs (2m, 5m) provide immediate trend information, while the daily EMAs/MAs provide context about the larger market structure.
2. The color bands between EMAs offer instant visual confirmation of trend alignment or divergence across timeframes.
3. Previous day and pre-market levels add horizontal support/resistance zones to complement the dynamic moving averages.
4. Multiple timeframe VWAPs provide additional confirmation of institutional activity levels and potential reversal points.
By combining these elements, traders can develop a comprehensive market view that integrates price action, trend direction, and key support/resistance levels all in one indicator.
#### Usage Instructions
1. Apply the NasyI indicator to your chart (works best on intraday timeframes from 1-minute to 30-minute).
2. Observe the relationship between price and the various EMAs:
- Price above the 2m/5m EMAs with green bands indicates bullish short-term conditions
- Price below the 2m/5m EMAs with red bands indicates bearish short-term conditions
3. Use the daily EMAs/MAs and VWAPs as targets for potential price movements and reversal zones.
4. Previous day and pre-market high/low lines provide key levels to watch for breakouts or breakdowns.
5. Customize the appearance according to your preferences using the extensive settings options.
This indicator represents a unique approach to technical analysis by combining multiple timeframe perspectives into a single, visually intuitive display that helps traders make more informed decisions based on a comprehensive view of market conditions.
### 中文描述
**NasyI** 是一个全面的技术分析指标,旨在为交易者提供跨多个时间周期的完整市场动态视图。该指标结合了指数移动平均线(EMA)、简单移动平均线(MA)、成交量加权平均价格(VWAP)和关键支撑/阻力水平的力量,帮助交易者识别趋势方向、潜在反转点和最佳进出场机会。
#### 主要特点
1. **多时间周期分析系统**
- 2分钟EMAs(13,48)用于超短期趋势识别
- 5分钟EMAs(9,13,21,48,200)用于短期趋势确认
- 日线EMAs(5,13,21,48,100,200)和MAs(20,50,100,200)用于更长期的视角
- 关键EMAs之间的彩色带状区域直观显示趋势强度和方向
2. **高级VWAP整合**
- 日内VWAP作为日内支撑/阻力
- 周内VWAP作为中期价格参考
- 月内VWAP作为长期机构价格水平
- 所有VWAP在各自的时间周期边界正确重置
3. **关键价格水平识别**
- 前一交易日高点/低点线用于识别关键突破和跌破水平
- 盘前高点/低点跟踪用于识别潜在的日内支撑/阻力区域
- 所有水平以不同的线条样式显示,便于识别
4. **动态趋势分析**
- EMAs之间的彩色带状区域显示趋势强度和方向:
- 绿色带状区域表示上升趋势(9 EMA > 21 EMA > 48 EMA)
- 红色带状区域表示下降趋势(9 EMA < 21 EMA < 48 EMA)
- 黄色带状区域表示中性/混乱市场条件
- 视觉表示使趋势变化立即显现
5. **全面的自定义选项**
- 所有指标和带状区域的颜色完全可定制
- 可调节的透明度设置,提高视觉清晰度
- 可选的价格标签,带有可定制的位置和外观
- 能够根据交易偏好显示/隐藏特定组件
#### 交易应用
此指标对以下方面特别有价值:
1. **日内交易和短线交易**:2分钟和5分钟EMAs与色带提供清晰的短期趋势方向和潜在反转信号。
2. **摇摆交易**:日线EMAs和MAs提供对更大趋势的视角,帮助将短期交易与更广泛的市场方向对齐。
3. **缺口交易**:前一日和盘前水平帮助识别潜在的缺口填充情况和突破/跌破机会。
4. **VWAP交易策略**:多时间周期VWAP允许识别机构参与水平和潜在反转区域。
5. **EMA交叉系统**:各种EMAs可用于识别跨多个时间周期的黄金交叉和死亡交叉。
#### 组件如何协同工作
NasyI的强大之处在于这些不同技术元素的集成:
1. 短时间周期EMAs(2m,5m)提供即时趋势信息,而日线EMAs/MAs提供关于更大市场结构的背景。
2. EMAs之间的色带提供趋势对齐或跨时间周期分歧的即时视觉确认。
3. 前一日和盘前水平添加水平支撑/阻力区域,补充动态移动平均线。
4. 多时间周期VWAP提供机构活动水平和潜在反转点的额外确认。
通过结合这些元素,交易者可以发展出全面的市场视图,整合价格行动、趋势方向和关键支撑/阻力水平于一个指标中。
#### 使用说明
1. 将NasyI指标应用到您的图表上(最适合1分钟至30分钟的日内时间周期)。
2. 观察价格与各种EMAs之间的关系:
- 价格位于2m/5m EMAs之上,带有绿色带状区域,表示看涨的短期条件
- 价格位于2m/5m EMAs之下,带有红色带状区域,表示看跌的短期条件
3. 使用日线EMAs/MAs和VWAPs作为潜在价格移动和反转区域的目标。
4. 前一日和盘前高点/低点线提供需要关注的突破或跌破的关键水平。
5. 使用广泛的设置选项根据您的偏好自定义外观。
这个指标代表了一种独特的技术分析方法,将多个时间周期的视角结合到一个单一的、视觉直观的显示中,帮助交易者基于对市场条件的全面视图做出更明智的决策。

Swing Structure + Session Sweeps“Scalper-Friendly Trend & Sweep Detector”
Swing Structure + Session Sweeps with TEMA Cloud
This powerful all-in-one tool is designed for intraday traders, swing traders, and scalpers who want to spot high-probability reversals, trend continuations, and liquidity sweeps with confluence.
🔹 Core Features
Multi-layered TEMA Cloud (9, 20, 34, 50) for clear trend structure
Dynamic Bull/Bear labels when the trend flips
Centerline for TEMA 20 to visualize core trend direction
Session-based liquidity sweep detection (Asia, London, NY)
Volume and absorption dots to catch hidden pressure
Swing high/low detection (external and internal)
Visual VWAP, daily highs/lows, and customizable session zones
Optional alerts for volume spikes, absorption, and reversal sweeps
📈 Use it to:
Confirm directional bias
Anticipate pullbacks and breakouts
Identify volume-backed reversals
Align trades with session strength and swing confluence
⚙️ Built for scalpers, intraday opportunists, and precision chartists alike.

Customizable RSI/StochRSI Double ConfirmationBelow are the key adjustable parameters in the script and their usage:
RSI Parameters
RSI Length: The number of periods used to calculate the RSI, with a default value of 7. Adjusting this parameter changes the sensitivity of the RSI—shorter periods make it more sensitive, while longer periods make it smoother.
RSI Source: The price source used for RSI calculation, defaulting to the closing price (close). This can be changed to the opening price or other price types as needed.
StochRSI Parameters
StochRSI Length: The number of periods used to calculate the StochRSI, with a default value of 5. This affects how quickly the StochRSI reacts to changes in the RSI.
StochRSI Smooth K: The smoothing period for the StochRSI %K line, with a default value of 3. This is used to reduce noise.
StochRSI Smooth D: The smoothing period for the StochRSI %D line, with a default value of 3. It works in conjunction with %K to provide more stable signals.
Signal Thresholds
RSI Buy Threshold: A buy signal is triggered when the RSI crosses above this value (default 20).
RSI Sell Threshold: A sell signal is triggered when the RSI crosses below this value (default 80).
StochRSI Buy Threshold: A buy signal is triggered when the StochRSI %K crosses above this value (default 20).
StochRSI Sell Threshold: A sell signal is triggered when the StochRSI %K crosses below this value (default 80).
Signals
RSI Buy/Sell Signals: When the RSI crosses the buy/sell threshold, a green "RSI Buy" or red "RSI Sell" is displayed on the chart.
StochRSI Buy/Sell Signals: When the StochRSI %K crosses the buy/sell threshold, a yellow "StochRSI Buy" or purple "StochRSI Sell" is displayed.
Double Buy/Sell Signals: When both RSI and StochRSI simultaneously trigger buy/sell signals, a green "Double Buy" or red "Double Sell" is displayed, indicating a stronger trading opportunity.
The volatility of different cryptocurrencies varies, and different parameters may be suitable for each. Users need to experiment and select the most appropriate parameters themselves.
Disclaimer: This script is for informational purposes only and should not be considered financial advice; use it at your own risk.

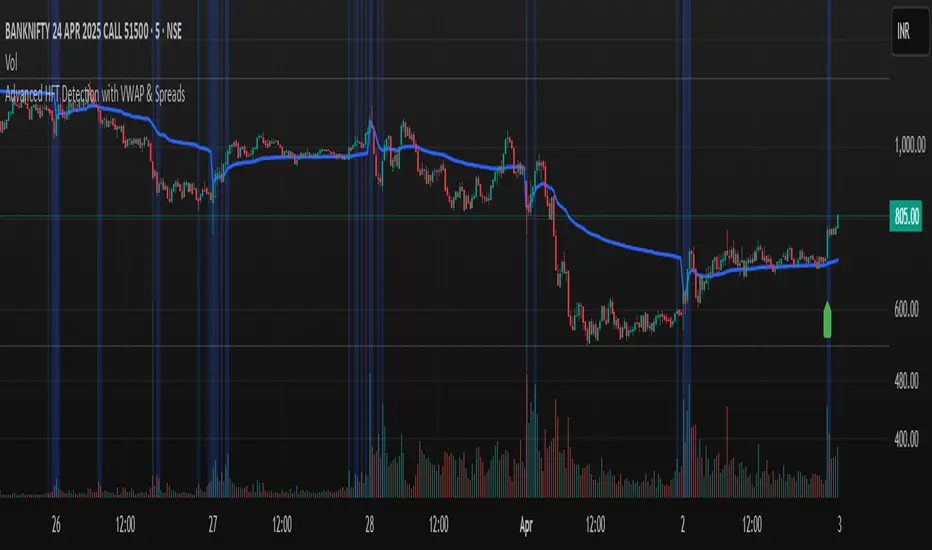
Advanced HFT Detection with VWAP & SpreadsExplanation of the HFT Detection Strategy
🔹 1. Key Indicators Used in the Strategy
It's works by combining VWAP, moving averages (SMA), volume spikes, and price jumps to detect potential HFT activity.
✅ (A) VWAP (Volume Weighted Average Price)
VWAP acts as a benchmark price that professional traders and institutions use to execute large orders.
If price is above VWAP, buyers are in control → Bullish trend
If price is below VWAP, sellers are in control → Bearish trend
HFT algorithms often place buy orders above VWAP and sell orders below VWAP to follow momentum.
➡️ Why VWAP? It ensures that signals follow the institutional trading trend.
✅ (B) Moving Averages (SMA)
Moving averages smooth out price data and help in detecting short-term momentum changes.
Fast Moving Average (5-period SMA): Reacts quickly to price changes
Slow Moving Average (20-period SMA): Identifies trend direction
➡️ Why SMA? It filters noise and confirms short-term trend shifts.
✅ (C) Volume Spike Detection
High-frequency trading is often accompanied by large volume surges. We define a volume spike as:
📌 Current Volume > 2× Average Volume of last 20 bars
➡️ Why Volume? HFTs execute rapid buy/sell orders when they detect liquidity, leading to sudden volume bursts.
✅ (D) Price Jump Detection (Sudden Volatility)
HFT algorithms often exploit quick price movements. We check if the price has moved more than twice the ATR (Average True Range) in the last 5 bars.
➡️ Why ATR? It helps to detect abnormal price movements compared to normal volatility.
🔹 2. Trading Signal Logic
Now that we have VWAP, moving averages, volume, and price movement filters, we generate buy and sell signals based on conditions.
✅ (A) Buy Signal Condition
A BUY signal is triggered when:
✔ Fast SMA crosses above Slow SMA → Short-term trend is turning bullish
✔ Volume spike occurs → HFTs are active
✔ Sudden price jump detected → High volatility
✔ Price is above VWAP → Confirms bullish trend
➡️ Why this works? It confirms that institutional traders & HFTs are buying aggressively.
✅ (B) Sell Signal Condition
A SELL signal is triggered when:
✔ Fast SMA crosses below Slow SMA → Short-term trend is turning bearish
✔ Volume spike occurs → HFTs are selling aggressively
✔ Sudden price drop detected → High volatility
✔ Price is below VWAP → Confirms bearish trend
➡️ Why this works? It confirms that institutional traders & HFTs are selling aggressively.
🔹 3. Visual Representation (Plotting Signals & VWAP)
Once we detect buy and sell signals, we mark them on the chart.
✅ (A) Buy/Sell Markers
🟢 Buy → Green upward arrow below the candle
🔴 Sell → Red downward arrow above the candle
✅ (B) VWAP Line on Chart
We also plot VWAP as a blue line to visualize trend direction.
✅ (C) Highlighting Volume Spikes
To easily spot HFT activity, we highlight volume spike bars with a blue background.
🔹 4. How to Use This Strategy?
1️⃣ Apply this script on a 1-minute or 5-minute intraday chart.
2️⃣ Look for BUY signals above VWAP and SELL signals below VWAP.
3️⃣ Verify that the volume spikes before taking action.
4️⃣ Use stop-loss & risk management (e.g., stop-loss at recent low/high).
🚀 Summary: Why This Strategy Works?
✅ VWAP ensures we follow institutional traders
✅ Volume spikes confirm sudden liquidity inflows
✅ Price jumps detect fast market moves caused by HFT bots
✅ Moving averages smooth out short-term trend shifts