Reversal + Confirm ZonesThis script is written in Pine Script (version 5) for TradingView and creates an indicator called **"Reversal + Confirm Zones"**. It overlays visual zones on a price chart to identify potential reversal points and confirmation signals for trading. The indicator combines **Bollinger Bands** and **RSI** to detect overbought/oversold conditions (reversal zones) and uses **EMA crosses** and **MACD zero-line crosses** to confirm bullish or bearish trends. Below is a detailed explanation:
---
### **1. Purpose**
- The script highlights:
- **Reversal Zones**: Areas where the price might reverse due to being overbought (green) or oversold (red).
- **Confirmation Zones**: Areas where a trend reversal is confirmed using EMA and MACD signals (green for bullish, red for bearish).
- It provides visual backgrounds and alerts to assist traders in spotting potential trade setups.
---
### **2. Components**
The script is divided into two main parts: **Reversal Logic** and **Confirmation Logic**.
---
### **3. Reversal Logic (Red & Green Zones)**
#### **Bollinger Bands**
- **Parameters**:
- Length: 20 periods.
- Source: Closing price (`close`).
- Multiplier: 2.0 (standard deviations).
- **Calculation**:
- `basis`: 20-period Simple Moving Average (SMA).
- `dev`: 2 times the standard deviation of the price over 20 periods.
- `upper`: `basis + dev` (upper band).
- `lower`: `basis - dev` (lower band).
- **Purpose**: Identifies when the price moves outside the normal range (beyond 2 standard deviations).
#### **Relative Strength Index (RSI)**
- **Parameters**:
- Length: 14 periods.
- Low Threshold: 30 (oversold).
- High Threshold: 70 (overbought).
- **Calculation**: `rsiValue = ta.rsi(close, rsiLength)`.
- **Purpose**: Measures momentum to confirm overbought or oversold conditions.
#### **Zone Conditions**
- **Red Zone (Oversold)**:
- Condition: `close < lower` (price below lower Bollinger Band) AND `rsiValue < rsiLowThreshold` (RSI < 30).
- Visual: Light red background (`color.new(color.red, 80)`).
- Alert: "Deep Oversold Signal triggered!".
- **Green Zone (Overbought)**:
- Condition: `close > upper` (price above upper Bollinger Band) AND `rsiValue > rsiHighThreshold` (RSI > 70).
- Visual: Light green background (`color.new(color.green, 80)`).
- Alert: "Deep Overbought Signal triggered!".
#### **Interpretation**
- Red Zone: Suggests the price is oversold and may reverse upward.
- Green Zone: Suggests the price is overbought and may reverse downward.
---
### **4. Confirmation Logic (EMA and MACD Crosses)**
#### **Exponential Moving Averages (EMAs)**
- **Parameters**:
- Short EMA Length: 9 periods (user adjustable).
- Long EMA Length: 21 periods (user adjustable).
- **Calculation**:
- `emaShort = ta.ema(close, emaShortLength)`.
- `emaLong = ta.ema(close, emaLongLength)`.
- **Conditions**:
- **Bullish EMA Cross**: `emaCrossBullish = ta.crossover(emaShort, emaLong)` (9 EMA crosses above 21 EMA).
- **Bearish EMA Cross**: `emaCrossBearish = ta.crossunder(emaShort, emaLong)` (9 EMA crosses below 21 EMA).
#### **MACD**
- **Parameters**:
- Fast Length: 12 periods (user adjustable).
- Slow Length: 26 periods (user adjustable).
- Signal Smoothing: 9 periods (user adjustable).
- **Calculation**:
- ` = ta.macd(close, macdFastLength, macdSlowLength, macdSignalSmoothing)`.
- Only the MACD line and signal line are used; the histogram is ignored (`_`).
- **Conditions**:
- **Bullish MACD Cross**: `macdCrossBullish = ta.crossover(macdLine, 0)` (MACD crosses above zero).
- **Bearish MACD Cross**: `macdCrossBearish = ta.crossunder(macdLine, 0)` (MACD crosses below zero).
#### **Combined Confirmation Conditions**
- **Bullish Confirmation**:
- Condition: `bullishConfirmation = emaCrossBullish and macdCrossBullish`.
- Visual: Very light green background (`color.new(color.green, 90)`).
- Meaning: A bullish trend is confirmed when the 9 EMA crosses above the 21 EMA AND the MACD crosses above zero.
- **Bearish Confirmation**:
- Condition: `bearishConfirmation = emaCrossBearish and macdCrossBearish`.
- Visual: Very light red background (`color.new(color.red, 90)`).
- Meaning: A bearish trend is confirmed when the 9 EMA crosses below the 21 EMA AND the MACD crosses below zero.
---
### **5. Visual Outputs**
- **Reversal Zones**:
- Red background for oversold conditions.
- Green background for overbought conditions.
- **Confirmation Zones**:
- Light green background for bullish confirmation.
- Light red background for bearish confirmation.
- Note: The script does not plot the Bollinger Bands, EMAs, or MACD lines—only the background zones are visualized.
---
### **6. Alerts**
- **Deep Oversold Alert**: Triggers when the red zone condition is met.
- **Deep Overbought Alert**: Triggers when the green zone condition is met.
- No alerts are set for the confirmation zones (EMA/MACD crosses).
---
### **7. How It Works**
1. **Reversal Detection**:
- The script uses Bollinger Bands and RSI to flag extreme price levels (red for oversold, green for overbought).
- These zones suggest potential reversals but are not confirmed yet.
2. **Trend Confirmation**:
- EMA crosses (9/21) and MACD zero-line crosses provide confirmation of a trend direction.
- Bullish confirmation (green) occurs when both indicators align upward.
- Bearish confirmation (red) occurs when both indicators align downward.
3. **Trading Strategy**:
- Look for a red zone (oversold) followed by a bullish confirmation for a potential long entry.
- Look for a green zone (overbought) followed by a bearish confirmation for a potential short entry.
---
### **8. How to Use**
1. Add the script to TradingView.
2. Adjust inputs (EMA lengths, MACD settings) if desired.
3. Monitor the chart:
- Red zones indicate oversold conditions—watch for a potential upward reversal.
- Green zones indicate overbought conditions—watch for a potential downward reversal.
- Light green/red backgrounds confirm the trend direction after a reversal zone.
4. Set up alerts for oversold/overbought conditions to catch reversal signals early.
---
### **9. Key Features**
- **Dual Purpose**: Combines reversal detection (Bollinger Bands + RSI) with trend confirmation (EMA + MACD).
- **Visual Simplicity**: Uses background colors instead of plotting lines, keeping the chart clean.
- **Customizable**: Allows users to tweak EMA and MACD periods.
- **Alerts**: Notifies users of extreme conditions for timely action.
---
### **10. Limitations**
- No plotted indicators (e.g., Bollinger Bands, EMAs, MACD) for visual reference—relies entirely on background shading.
- Confirmation signals (EMA/MACD) may lag behind reversal zones, potentially missing fast reversals.
- No alerts for confirmation zones, limiting real-time notification of trend confirmation.
This script is ideal for traders who want a straightforward way to spot potential reversals and confirm them with trend-following indicators, all overlaid on the price chart.
Komut dosyalarını "20蒙古币兑换人民币" için ara

Stochastic Fusion Elite [trade_lexx]📈 Stochastic Fusion Elite is your reliable trading assistant!
📊 What is Stochastic Fusion Elite ?
Stochastic Fusion Elite is a trading indicator based on a stochastic oscillator. It analyzes the rate of price change and generates buy or sell signals based on various technical analysis methods.
💡 The main components of the indicator
📊 Stochastic oscillator (K and D)
Stochastic shows the position of the current price relative to the price range for a certain period. Values above 80 indicate overbought (an early sale is possible), and values below 20 indicate oversold (an early purchase is possible).
📈 Moving Averages (MA)
The indicator uses 10 different types of moving averages to smooth stochastic lines.:
- SMA: Simple moving average
- EMA: Exponential moving average
- WMA: Weighted moving average
- HMA: Moving Average Scale
- KAMA: Kaufman Adaptive Moving Average
- VWMA: Volume-weighted moving average
- ALMA: Arnaud Legoux Moving Average
- TEMA: Triple exponential moving average
- ZLEMA: zero delay exponential moving average
- DEMA: Double exponential moving average
The choice of the type of moving average affects the speed of the indicator's response to market changes.
🎯 Bollinger Bands (BB)
Bands around the moving average that widen and narrow depending on volatility. They help determine when the stochastic is out of the normal range.
🔄 Divergences
Divergences show discrepancies between price and stochastic:
- Bullish divergence: price is falling and stochastic is rising — an upward reversal is possible
- Bearish divergence: the price is rising, and stochastic is falling — a downward reversal is possible
🔍 Indicator signals
1️⃣ KD signals (K and D stochastic lines)
- Buy signal:
- What happens: the %K line crosses the %D line from bottom to top
- What does it look like: a green triangle with the label "KD" under the chart and the label "Buy" below the bar
- What does this mean: the price is gaining an upward momentum, growth is possible
- Sell signal:
- What happens: the %K line crosses the %D line from top to bottom
- What it looks like: a red triangle with the label "KD" above the chart and the label "Sell" above the bar
- What does this mean: the price is losing its upward momentum, possibly falling
2️⃣ Moving Average Signals (MA)
- Buy Signal:
- What happens: stochastic crosses the moving average from bottom to top
- What it looks like: a green triangle with the label "MA" under the chart and the label "Buy" below the bar
- What does this mean: stochastic is starting to accelerate upward, price growth is possible
- Sell signal:
- What happens: stochastic crosses the moving average from top to bottom
- What it looks like: a red triangle with the label "MA" above the chart and the label "Sell" above the bar
- What does this mean: stochastic is starting to accelerate downwards, a price drop is possible
3️⃣ Bollinger Band Signals (BB)
- Buy signal:
- What happens: stochastic crosses the lower Bollinger band from bottom to top
- What it looks like: a green triangle with the label "BB" under the chart and the label "Buy" below the bar
- What does this mean: stochastic was too low and is now starting to recover
- Sell signal:
- What happens: Stochastic crosses the upper Bollinger band from top to bottom
- What it looks like: a red triangle with a "BB" label above the chart and a "Sell" label above the bar
- What does this mean: stochastic was too high and is now starting to decline
4️⃣ Divergence Signals (Div)
- Buy Signal (Bullish Divergence):
- What's happening: the price is falling, and stochastic is forming higher lows
- What it looks like: a green triangle with a "Div" label under the chart and a "Buy" label below the bar
- What does this mean: despite the falling price, the momentum is already changing in an upward direction
- Sell signal (bearish divergence):
- What's going on: the price is rising, and stochastic is forming lower highs
- What it looks like: a red triangle with a "Div" label above the chart and a "Sell" label above the bar
- What does this mean: despite the price increase, the momentum is already weakening
🛠️ Filters to filter out false signals
1️⃣ Minimum distance between the signals
- What it does: sets the minimum number of candles between signals
- Why it is needed: prevents signals from being too frequent during strong market fluctuations
- How to set it up: Set the number from 0 and above (default: 5)
2️⃣ "Waiting for the opposite signal" mode
- What it does: waits for a signal in the opposite direction before generating a new signal
- Why you need it: it helps you not to miss important trend reversals
- How to set up: just turn the function on or off
3️⃣ Filter by stochastic levels
- What it does: generates signals only when the stochastic is in the specified ranges
- Why it is needed: it helps to catch the moments when the market is oversold or overbought
- How to set up:
- For buy signals: set a range for oversold (for example, 1-20)
- For sell signals: set a range for overbought (for example, 80-100)
4️⃣ MFI filter
- What it does: additionally checks the values of the cash flow index (MFI)
- Why it is needed: confirms stochastic signals with cash flow data
- How to set it up:
- For buy signals: set the range for oversold MFI (for example, 1-25)
- For sell signals: set the range for overbought MFI (for example, 75-100)
5️⃣ The RSI filter
- What it does: additionally checks the RSI values to confirm the signals
- Why it is needed: adds additional confirmation from another popular indicator
- How to set up:
- For buy signals: set the range for oversold MFI (for example, 1-30)
- For sell signals: set the range for overbought MFI (for example, 70-100)
🔄 Signal combination modes
1️⃣ Normal mode
- How it works: all signals (KD, MA, BB, Div) work independently of each other
- When to use it: for general market analysis or when learning how to work with the indicator
2️⃣ "AND" Mode ("AND Mode")
- How it works: the alarm appears only when several conditions are triggered simultaneously
- Combination options:
- KD+MA: signals from the KD and moving average lines
- KD+BB: signals from KD lines and Bollinger bands
- KD+Div: signals from the KD and divergence lines
- KD+MA+BB: three signals simultaneously
- KD+MA+Div: three signals at the same time
- KD+BB+Div: three signals at the same time
- KD+MA+BB+Div: all four signals at the same time
- When to use: for more reliable but rare signals
🔌 Connecting to trading strategies
The indicator can be connected to your trading strategies using 6 different channels.:
1. Connector KD signals: connects only the signals from the intersection of lines K and D
2. Connector MA signals: connects only signals from moving averages
3. Connector BB signal: connects only the signals from the Bollinger bands
4. Connector divergence signals: connects only divergence signals
5. Combined Connector: connects any signals
6. Connector for "And" mode: connects only combined signals
🔔 Setting up alerts
The indicator can send alerts when alarms appear.:
- Alerts for KD: when the %K line crosses the %D line
- Alerts for MA: when stochastic crosses the moving average
- Alerts for BB: when stochastic crosses the Bollinger bands
- Divergence alerts: when a divergence is detected
- Combined alerts: for all types of alarms
- Alerts for "And" mode: for combined signals
🎭 What does the indicator look like on the chart ?
- Main lines K and D: blue and orange lines
- Overbought/oversold levels: horizontal lines at levels 20 and 80
- Middle line: dotted line at level 50
- Stochastic Moving Average: yellow line
- Bollinger bands: green lines around the moving average
- Signals: green and red triangles with corresponding labels
📚 How to start using Stochastic Fusion Elite
1️⃣ Initial setup
- Add an indicator to your chart
- Select the types of signals you want to use (KD, MA, BB, Div)
- Adjust the period and smoothing for the K and D lines
2️⃣ Filter settings
- Set the distance between the signals to get rid of unnecessary noise
- Adjust stochastic, MFI and RSI levels depending on the volatility of your asset
- If you need more reliable signals, turn on the "Waiting for the opposite signal" mode.
3️⃣ Operation mode selection
- First, use the standard mode to see all possible signals.
- When you get comfortable, try the "And" mode for rarer signals.
4️⃣ Setting up Alerts
- Select the types of signals you want to be notified about
- Set up alerts for these types of signals
5️⃣ Verification and adaptation
- Check the operation of the indicator on historical data
- Adjust the parameters for a specific asset
- Adapt the settings to your trading style
🌟 Usage examples
For trend trading
- Use the KD and MA signals in the direction of the main trend
- Set the distance between the signals
- Set stricter levels for filters
For trading in a sideways range
- Use BB signals to detect bounces from the range boundaries
- Use a stochastic level filter to confirm overbought/oversold conditions
- Adjust the Bollinger bands according to the width of the range
To determine the pivot points
- Pay attention to the divergence signals
- Set the distance between the signals
- Check the MFI and RSI filters for additional confirmation

Multi-Indicator Trading DashboardMulti-Indicator Trading Dashboard: Comprehensive Analysis and Actionable Signals
This Pine Script indicator, "Multi-Indicator Trading Dashboard," provides a comprehensive overview of key market indicators and generates actionable trading signals, all presented in a clear, easy-to-read table format on your TradingView chart.
Key Features:
Real-time Indicator Analysis: The dashboard displays real-time values and signals for:
RSI (Relative Strength Index): Tracks overbought and oversold conditions.
MACD (Moving Average Convergence Divergence): Identifies trend changes and momentum.
ADX (Average Directional Index): Measures trend strength.
Volatility (ATR-based): Estimates volatility as a percentage, acting as a VIX proxy for single-symbol charts.
Trend Determination: Analyzes 20, 50, and 200-period EMAs to provide a clear trend assessment (Strong Bullish, Cautious Bullish, Cautious Bearish, Strong Bearish).
Combined Trading Signals: Integrates signals from RSI, MACD, ADX, and trend analysis to generate a combined "Buy," "Sell," or "Neutral" action signal.
User-Friendly Table Display: Presents all information in a neatly organized table, positioned at the top-right of your chart.
Visual Chart Overlays: Plots 20, 50, and 200-period EMAs directly on the chart for visual trend confirmation.
Background Color Alerts: Colors the chart's background based on the "Buy" or "Sell" action signal for quick visual cues.
Customizable Inputs: Allows you to adjust key parameters like RSI lengths, MACD settings, ADX thresholds, and EMA periods.
How It Works:
Indicator Calculations: The script calculates RSI, MACD, ADX, and a volatility proxy (ATR) using standard Pine Script functions.
Trend Analysis: It compares 20, 50, and 200-period EMAs to determine the overall trend direction.
Individual Signal Generation: It generates individual "Buy," "Sell," or "Neutral" signals based on RSI, MACD, and ADX values.
Combined Signal Logic: It combines the individual signals and trend analysis, assigning a "Buy" or "Sell" action only when at least two indicators align.
Table Display: It creates a table and populates it with the calculated values, signals, and trend information.
Chart Overlays: It plots the EMAs on the chart and colors the background based on the combined action signal.
Use Cases:
Quick Market Overview: Get a snapshot of key market indicators and trend direction at a glance.
Confirmation Tool: Use the combined signals to confirm your existing trading strategies.
Educational Purpose: Learn how different indicators interact and influence trading decisions.
Automated Alerting: Set up alerts based on the "Buy" or "Sell" action signals.
Customization:
Adjust the input parameters to fine-tune the indicator's sensitivity to your trading style and the specific market you're analyzing.
Disclaimer:
This indicator is for informational and educational purposes only and should not be considered financial advice. Always conduct thorough research and consult with 1 a qualified professional before making any 2 trading decisions.

Adaptive Regression Channel [MissouriTim]The Adaptive Regression Channel (ARC) is a technical indicator designed to empower traders with a clear, adaptable, and precise view of market trends and price boundaries. By blending advanced statistical techniques with real-time market data, ARC delivers a comprehensive tool that dynamically adjusts to price action, volatility, volume, and momentum. Whether you’re navigating the fast-paced world of cryptocurrencies, the steady trends of stocks, or the intricate movements of FOREX pairs, ARC provides a robust framework for identifying opportunities and managing risk.
Core Components
1. Color-Coded Regression Line
ARC’s centerpiece is a linear regression line derived from a Weighted Moving Average (WMA) of closing prices. This line adapts its calculation period based on market volatility (via ATR) and is capped between a minimum of 20 bars and a maximum of 1.5 times the user-defined base length (default 100). Visually, it shifts colors to reflect trend direction: green for an upward slope (bullish) and red for a downward slope (bearish), offering an instant snapshot of market sentiment.
2. Dynamic Residual Channels
Surrounding the regression line are upper (red) and lower (green) channels, calculated using the standard deviation of residuals—the difference between actual closing prices and the regression line. This approach ensures the channels precisely track how closely prices follow the trend, rather than relying solely on overall price volatility. The channel width is dynamically adjusted by a multiplier that factors in:
Volatility: Measured through the Average True Range (ATR), widening channels during turbulent markets.
Trend Strength: Based on the regression slope, expanding channels in strong trends and contracting them in consolidation phases.
3. Volume-Weighted Moving Average (VWMA)
Plotted in orange, the VWMA overlays a volume-weighted price trend, emphasizing movements backed by significant trading activity. This complements the regression line, providing additional confirmation of trend validity and potential breakout strength.
4. Scaled RSI Overlay
ARC features a Relative Strength Index (RSI) overlay, plotted in purple and scaled to hover closely around the regression line. This compact display reflects momentum shifts within the trend’s context, keeping RSI visible on the price chart without excessive swings. User-defined overbought (default 70) and oversold (default 30) levels offer reference points for momentum analysis."
Technical Highlights
ARC leverages a volatility-adjusted lookback period, residual-based channel construction, and multi-indicator integration to achieve high accuracy. Its parameters—such as base length, channel width, ATR period, and RSI length—are fully customizable, allowing traders to tailor it to their specific needs.
Why Choose ARC?
ARC stands out for its adaptability and precision. The residual-based channels offer tighter, more relevant support and resistance levels compared to standard volatility measures, while the dynamic adjustments ensure it performs well in both trending and ranging markets. The inclusion of VWMA and scaled RSI adds depth, merging trend, volume, and momentum into a single, cohesive overlay. For traders seeking a versatile, all-in-one indicator, ARC delivers actionable insights with minimal noise.
Best Ways to Use the Adaptive Regression Channel (ARC)
The Adaptive Regression Channel (ARC) is a flexible tool that supports a variety of trading strategies, from trend-following to breakout detection. Below are the most effective ways to use ARC, along with practical tips for maximizing its potential. Adjustments to its settings may be necessary depending on the timeframe (e.g., intraday vs. daily) and the asset being traded (e.g., stocks, FOREX, cryptocurrencies), as each market exhibits unique volatility and behavior.
1. Trend Following
• How to Use: Rely on the regression line’s color to guide your trades. A green line (upward slope) signals a bullish trend—consider entering or holding long positions. A red line (downward slope) indicates a bearish trend—look to short or exit longs.
• Best Practice: Confirm the trend with the VWMA (orange line). Price above the VWMA in a green uptrend strengthens the bullish case; price below in a red downtrend reinforces bearish momentum.
• Adjustment: For short timeframes like 15-minute crypto charts, lower the Base Regression Length (e.g., to 50) for quicker trend detection. For weekly stock charts, increase it (e.g., to 200) to capture broader movements.
2. Channel-Based Trades
• How to Use: Use the upper channel (red) as resistance and the lower channel (green) as support. Buy when the price bounces off the lower channel in an uptrend, and sell or short when it rejects the upper channel in a downtrend.
• Best Practice: Check the scaled RSI (purple line) for momentum cues. A low RSI (e.g., near 30) at the lower channel suggests a stronger buy signal; a high RSI (e.g., near 70) at the upper channel supports a sell.
• Adjustment: In volatile crypto markets, widen the Base Channel Width Coefficient (e.g., to 2.5) to reduce false signals. For stable FOREX pairs (e.g., EUR/USD), a narrower width (e.g., 1.5) may work better.
3. Breakout Detection
• How to Use: Watch for price breaking above the upper channel (bullish breakout) or below the lower channel (bearish breakout). These moves often signal strong momentum shifts.
• Best Practice: Validate breakouts with VWMA position—price above VWMA for bullish breaks, below for bearish—and ensure the regression line’s slope aligns (green for up, red for down).
• Adjustment: For fast-moving assets like crypto on 1-hour charts, shorten ATR Length (e.g., to 7) to make channels more reactive. For stocks on daily charts, keep it at 14 or higher for reliability.
4. Momentum Analysis
• How to Use: The scaled RSI overlay shows momentum relative to the regression line. Rising RSI in a green uptrend confirms bullish strength; falling RSI in a red downtrend supports bearish pressure.
• Best Practice: Look for RSI divergences—e.g., price hitting new highs at the upper channel while RSI flattens or drops could signal an impending reversal.
• Adjustment: Reduce RSI Length (e.g., to 7) for intraday trading in FOREX or crypto to catch short-term momentum shifts. Increase it (e.g., to 21) for longer-term stock trades.
5. Range Trading
• How to Use: When the regression line’s slope is near zero (flat) and channels are tight, ARC indicates a ranging market. Buy near the lower channel and sell near the upper channel, targeting the regression line as the mean price.
• Best Practice: Ensure VWMA hovers close to the regression line to confirm the range-bound state.
• Adjustment: For low-volatility stocks on daily charts, use a moderate Base Regression Length (e.g., 100) and tight Base Channel Width (e.g., 1.5). For choppy crypto markets, test shorter settings.
Optimization Strategies
• Timeframe Customization: Adjust ARC’s parameters to match your trading horizon. Short timeframes (e.g., 1-minute to 1-hour) benefit from lower Base Regression Length (20–50) and ATR Length (7–10) for agility, while longer timeframes (e.g., daily, weekly) favor higher values (100–200 and 14–21) for stability.
• Asset-Specific Tuning:
○ Stocks: Use longer lengths (e.g., 100–200) and moderate widths (e.g., 1.8) for stable equities; tweak ATR Length based on sector volatility (shorter for tech, longer for utilities).
○ FOREX: Set Base Regression Length to 50–100 and Base Channel Width to 1.5–2.0 for smoother trends; adjust RSI Length (e.g., 10–14) based on pair volatility.
○ Crypto: Opt for shorter lengths (e.g., 20–50) and wider widths (e.g., 2.0–3.0) to handle rapid price swings; use a shorter ATR Length (e.g., 7) for quick adaptation.
• Backtesting: Test ARC on historical data for your asset and timeframe to optimize settings. Evaluate how often price respects channels and whether breakouts yield profitable trades.
• Enhancements: Pair ARC with volume surges, key support/resistance levels, or candlestick patterns (e.g., doji at channel edges) for higher-probability setups.
Practical Considerations
ARC’s adaptability makes it suitable for diverse markets, but its performance hinges on proper calibration. Cryptocurrencies, with their high volatility, may require shorter, wider settings to capture rapid moves, while stocks on longer timeframes benefit from broader, smoother configurations. FOREX pairs often fall in between, depending on their inherent volatility. Experiment with the adjustable parameters to align ARC with your trading style and market conditions, ensuring it delivers the precision and reliability you need.

RSI Disparity SignalRSI Disparity Signal Indicator
Overview:
This TradingView indicator detects when the RSI is significantly lower than its RSI-based moving average (RSI MA). Whenever the RSI is 20 points or more below the RSI MA, a signal (red dot) appears above the corresponding candlestick.
How It Works:
Calculates RSI using the default 14-period setting.
Calculates the RSI-based Moving Average (RSI MA) using a 14-period simple moving average (SMA).
Measures the disparity between the RSI and its MA.
Generates a signal when the RSI is 20 points or more below the RSI MA.
Plots a red circle above the candlestick whenever this condition is met.
Customization:
You can modify the RSI length and MA period to fit your trading strategy.
Change the plotshape() style to use different symbols like triangles or arrows.
Adjust the disparity threshold (currently set at 20) to make the signal more or less sensitive.
Use Case:
This indicator can help identify potentially oversold conditions where RSI is significantly below its average, signaling possible price reversals.

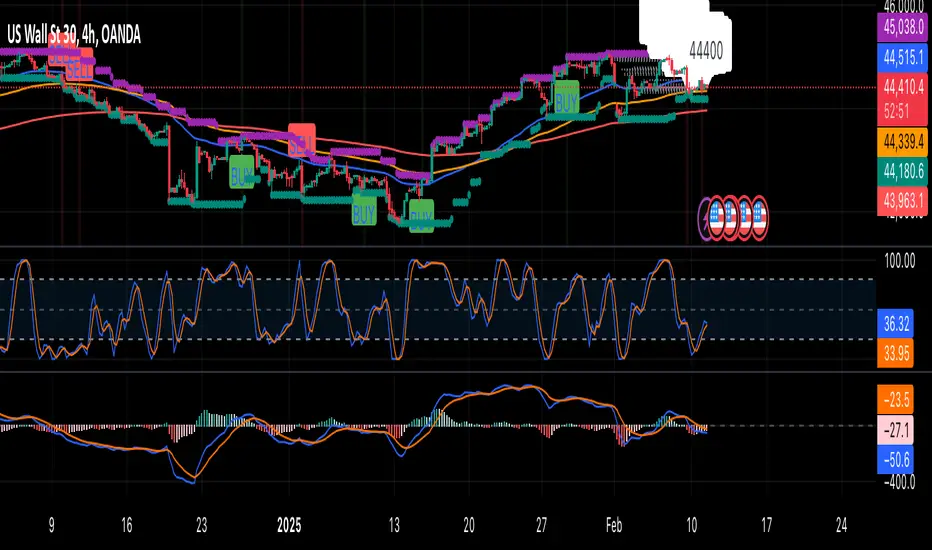
VWAP with ADX Buy/Sell Signals and 50 MA BackgroundThis Pine Script combines several technical indicators to create a comprehensive chart with buy and sell signals based on the ADX and VWAP, as well as background color changes depending on the price relative to the 50-period simple moving average (SMA). Here's a breakdown of what each part of the code does:
1. VWAP Settings
Anchor Period: You can select different periods such as "Session", "Week", "Month", etc. to define the anchor period for the VWAP.
Source: The source for VWAP is set to the typical price (hlc3).
Offset: Allows for shifting the VWAP by a specified amount.
2. ADX Settings
ADX Length: The period used to calculate the ADX.
ADX Smoothing: Used to smooth the ADX for better clarity.
ADX Threshold: Used to filter out weak trends (i.e., signals when ADX > 20).
3. ADX and VWAP Calculation
The ADX values are calculated using ta.dmi(), which returns the +DI, -DI, and ADX lines.
VWAP is calculated using ta.vwap(), based on the selected price source.
4. Buy/Sell Conditions
Buy Signal: A buy signal is generated when:
The +DI crosses above the -DI (indicating an uptrend).
The ADX is above 20 (indicating a strong trend).
The closing price is above the VWAP (indicating bullish market sentiment).
Sell Signal: A sell signal occurs when:
The -DI crosses above the +DI (indicating a downtrend).
The ADX is above 20 (indicating a strong trend).
The closing price is below the VWAP (indicating bearish market sentiment).
5. VWAP Bands
The standard deviation of the price is calculated using ta.stdev(), and the bands are plotted at multiples of the standard deviation (1, 2, and 3).
These bands are used to highlight possible overbought or oversold conditions.
6. 50-period SMA and Background Color
The script calculates a 50-period Simple Moving Average (SMA).
The background color is then changed based on whether the price is above or below the 50-period SMA. If the price is above the SMA, the background is green (bullish), and if it’s below, it’s red (bearish).
7. Plots
The script includes plots for the VWAP line, the ADX and DI lines (optional), and the upper and lower bands.
The buy and sell signals are plotted as shapes with text labels ("BUY" and "SELL") that appear below or above the price bars.
Final Notes:
Band Plots: Three levels of bands (green, olive, teal) are plotted using standard deviation multipliers (1, 2, and 3 times the standard deviation).
Background Color: The background color changes depending on whether the price is above or below the 50 SMA, giving a visual cue for bullish or bearish market conditions.
This indicator aims to offer a multi-faceted view of the market with trend-following signals (via ADX), VWAP for intraday support/resistance, and background coloring to indicate the current trend strength based on the 50 SMA.
Risk MeterRisk Meter Indicator for TradingView
The Risk Meter is a powerful market risk assessment tool designed to help traders evaluate the current risk environment using a simple, data-driven score. By analyzing four critical market factors—VIX (volatility index), market breadth, trailing volatility, and credit spreads—the indicator generates a risk score between 0 and 4. This score empowers traders to make informed decisions about hedging, exiting positions, or re-entering the market, with clear visual cues and alerts for intraday monitoring.
What It Does
Calculates a Risk Score: Assigns a score from 0 to 4, where each point reflects an active risk condition based on four market indicators.
Identifies Risk Levels:
A score of 3 or higher indicates a high-risk environment, suggesting traders consider hedging or reducing exposure.
A score of 2 or lower for at least two consecutive days signals a potential opportunity to re-enter the market.
Provides Visual Feedback: Uses color-coded Columns, threshold markers, and a component table for quick interpretation.
Supports Decision-Making: Offers a structured approach to managing risk and timing trades.
How It Works
The Risk Meter aggregates four key risk conditions, each contributing 1 point to the total score when triggered:
Elevated and Rising VIX (Risk 1)
Condition: The VIX is above 18 and higher than it was 20 days ago.
Purpose: Detects increasing market fear or uncertainty.
Market Breadth Dropping (Risk 2)
Condition: Either:
Fewer than 50% of S&P 500 stocks are above their 200-day moving average and fewer than 70% are above their 50-day moving average, or
The 3-day EMA of the 200-day breadth falls below 80% of its 20-day SMA.
Purpose: Identifies weakening participation across the market.
Trailing Volatility (Risk 3)
Condition: The 30-day annualized volatility of the equal-weight S&P 500 (RSP) exceeds 35%.
Purpose: Highlights periods of heightened price instability.
Credit Spreads (Risk 4)
Condition: The price ratio of high-yield bonds (HYG) to Treasuries (TLT or IEF) is lower than it was 20 days ago, indicating widening credit spreads.
Purpose: Signals potential stress in credit markets.
The total risk score is the sum of these conditions (0 to 4). Additionally, the indicator tracks consecutive days with a score of 2 or lower to generate re-entry signals.
How to Read It Intraday
The Risk Meter is built on daily data but can be monitored intraday for real-time insights. Here’s how traders can interpret it:
Risk Score Plot:
Displayed as a step line ranging from 0 to 4.
Colors:
Red: High risk (score ≥ 3) – caution advised.
Green: Re-entry signal – score ≤ 2 for at least two consecutive days (triggered when the count increments from 1 to 2).
Blue: Neutral or low risk (score < 3 without a re-entry signal).
Threshold Lines:
Dashed Gray Line at 3: Marks the high-risk threshold.
Dotted Gray Line at 2: Indicates the low-risk threshold for re-entry signals.
Risk Component Table:
Located in the top-right corner, it lists:
VIX, Breadth, Volatility, and Credit Spreads.
Status: Shows "" (warning, red) if the risk condition is met, or "✓" (safe, blue) if not.
Helps traders pinpoint which factors are driving the score.
Alerts:
High Risk Alert: Triggers when the score moves from < 3 to ≥ 3.
Re-entry Signal Alert: Triggers when the score ≤ 2 for two consecutive days.
Intraday Usage Tips
Check the indicator throughout the day for early signs of risk shifts, especially if the score is near a threshold (e.g., 2 or 3).
Combine with other intraday tools (e.g., price action, volume) since the Risk Meter updates daily but reflects broader market conditions.
How Traders Can Use It
High-Risk Signal (Score ≥ 3):
Consider hedging positions (e.g., with options) or reducing equity exposure to protect against potential downturns.
Re-entry Signal (Score ≤ 2 for 2+ Days):
Look to re-enter the market or increase exposure, as it suggests stabilizing conditions.
Daily Risk Management:
Use the score and table to assess overall market health and adjust strategies accordingly.
Alert-Driven Trading:
Set up alerts to stay notified of critical risk changes without constant monitoring.
Why Use the Risk Meter?
This indicator offers a systematic, multi-factor approach to risk assessment, blending volatility, breadth, and credit market data into an easy-to-read score. Whether you’re an intraday trader or a longer-term investor, the Risk Meter helps you stay proactive, avoid surprises, and time your trades with greater confidence.
Financial Risk Disclaimer for the Risk Meter Tool
Important Notice: The Risk Meter is a market risk assessment tool designed to provide insights into current market conditions based on historical data and predefined indicators. It is intended for informational and educational purposes only and should not be considered financial advice, a recommendation to buy or sell any securities, or a guarantee of future market performance.
Key Considerations
No Guarantee of Accuracy: While the Risk Meter utilizes reliable data sources and established financial metrics, the creators do not guarantee the accuracy, completeness, or timeliness of the information provided. Financial markets are complex and subject to rapid, unpredictable changes, and the tool’s output may not fully reflect all market dynamics.
Market Risks: Trading and investing in financial markets carry significant risks, including the potential loss of principal. Market volatility, economic shifts, and other factors can lead to unexpected outcomes. Past performance is not a reliable indicator of future results, and the Risk Meter’s assessments are based on historical data, not future predictions.
Not a Substitute for Professional Advice: The Risk Meter is not intended to replace personalized financial guidance. Users are strongly encouraged to consult a qualified financial advisor, perform their own research, and evaluate their personal financial situation, risk tolerance, and investment objectives before making any trading or investment decisions.
Limitation of Liability: The creators of the Risk Meter, including any affiliates, developers, or contributors, are not liable for any direct, indirect, incidental, or consequential losses or damages arising from the use of this tool. This includes, but is not limited to, financial losses, missed opportunities, or decisions based on the tool’s output.
User Responsibility: By using the Risk Meter, you accept full responsibility for your trading and investment decisions. You acknowledge that you use the tool at your own risk and that the creators bear no responsibility for any outcomes resulting from its use.
Final Note
The Risk Meter is a supplementary tool designed to enhance your understanding of market risk. It is not a comprehensive solution for investment management. Approach trading and investing with caution, ensuring your decisions align with your personal financial strategy.

Capitulation Volume Detector by @RhinoTradezOverview
Hey traders, want to catch the market when it’s totally losing it? The Capitulation Volume Detector is your go-to buddy for spotting those wild moments when panic selling takes over. Picture this: prices plummet, volume explodes, and everyone’s bailing out—that’s capitulation, and it might just signal a turning point. This script throws a bright marker on your chart whenever the chaos hits, so you can decide if it’s time to jump in or sit tight. Built fresh in Pine Script v6, it’s sleek, customizable, and packs an alert to keep you posted—perfect for stocks, indices like SPY, or even crypto chaos.
Inspired by epic sell-offs like March 2020’s COVID crash, this tool’s here to help you navigate the storm with a smile (and maybe a profit).
What It Does
Capitulation volume is that “everyone’s out!” moment: a steep price drop meets a massive volume surge, hinting that sellers are tapped out. It’s not a guaranteed reversal—sometimes the bleeding continues—but it’s a loud clue that fear’s peaked. Here’s the magic:
Volume Check : Measures current volume against a customizable average (default: 20 bars).
Price Plunge : Tracks the percentage drop from the last close.
Capitulation Cal l: When volume rockets past your threshold (e.g., 2x average) and price tanks (e.g., -5%), you get a red triangle above the bar.
Stay Alert : Fires off a detailed message (e.g., “Volume 300M > 200M, Drop -10%”) so you’re never caught off guard.
Think of it as your market meltdown radar—simple, effective, and ready to roll.
Functionality Breakdown
Volume Surge Spotter :
Uses a 20-bar Simple Moving Average (SMA) of volume as your baseline.
Flags any bar where volume exceeds this average by your chosen multiplier (default: 2x).
Price Drop Detector :
Calculates the percentage change from the prior close.
Triggers when the drop’s bigger than your set limit (default: -5%).
Capitulation Marker:
Combines both signals: high volume + sharp drop = capitulation.
Slaps a red triangle above the bar for instant “whoa, there it is!” vibes.
Real-Time Alerts :
Sends a custom alert with volume and drop details, keeping you in the loop without babysitting the chart.
Customization Options
Tune it to your trading style with these easy settings:
Volume Multiplier (x Avg): Starts at 2.0 (2x average volume). Bump it to 3.0 for only the wildest spikes or dial it to 1.5 for more frequent catches. Range: 1.0-10.0, step 0.1.
Price Drop Threshold (%): Default 5.0 (a -5% drop). Go big with 10.0 for crash-level falls or ease to 3.0 for lighter dips. Range: 1.0-20.0, step 0.1.
Average Volume Period: Default 20 bars. Stretch it to 50 for a broader view or shrink to 10 for quick reactions. Range: 1-100.
Capitulation Marker Color: Red by default—because panic’s loud! Switch it to blue, green, or pink to match your chart’s personality.
How to Use It
Drop It On : Add it to any chart with volume data—SPY daily for market moves, /ES 15-minute for intraday action, or your go-to stock.
Play with Settings : Hit the indicator’s config gear and tweak the multiplier, drop threshold, period, or marker color to fit your vibe.
Set an Alert : Right-click the indicator, add an alert with “Any alert() function call,” and get pinged when capitulation strikes.
Watch the Action : Look for those red triangles on big drop days—pair with your favorite reversal signals for extra oomph.
Pro Tips
Daily Charts : Catch market-wide capitulations like March 23, 2020 (SPY: -10%, 3x volume).
Intraday : Spot flash crashes or sector sell-offs on 15-minute or 5-minute bars.
Context Matters : High volume alone isn’t enough—check the VIX or candlestick patterns (e.g., hammers) to confirm a bottom.

*Auto Backtest & Optimize EngineFull-featured Engine for Automatic Backtesting and parameter optimization. Allows you to test millions of different combinations of stop-loss and take profit parameters, including on any connected indicators.
⭕️ Key Futures
Quickly identify the optimal parameters for your strategy.
Automatically generate and test thousands of parameter combinations.
A simple Genetic Algorithm for result selection.
Saves time on manual testing of multiple parameters.
Detailed analysis, sorting, filtering and statistics of results.
Detailed control panel with many tooltips.
Display of key metrics: Profit, Win Rate, etc..
Comprehensive Strategy Score calculation.
In-depth analysis of the performance of different types of stop-losses.
Possibility to use to calculate the best Stop-Take parameters for your position.
Ability to test your own functions and signals.
Customizable visualization of results.
Flexible Stop-Loss Settings:
• Auto ━ Allows you to test all types of Stop Losses at once(listed below).
• S.VOLATY ━ Static stop based on volatility (Fixed, ATR, STDEV).
• Trailing ━ Classic trailing stop following the price.
• Fast Trail ━ Accelerated trailing stop that reacts faster to price movements.
• Volatility ━ Dynamic stop based on volatility indicators.
• Chandelier ━ Stop based on price extremes.
• Activator ━ Dynamic stop based on SAR.
• MA ━ Stop based on moving averages (9 different types).
• SAR ━ Parabolic SAR (Stop and Reverse).
Advanced Take-Profit Options:
• R:R: Risk/Reward ━ sets TP based on SL size.
• T.VOLATY ━ Calculation based on volatility indicators (Fixed, ATR, STDEV).
Testing Modes:
• Stops ━ Cyclical stop-loss testing
• Pivot Point Example ━ Example of using pivot points
• External Example ━ Built-in example how test functions with different parameters
• External Signal ━ Using external signals
⭕️ Usage
━ First Steps:
When opening, select any point on the chart. It will not affect anything until you turn on Manual Start mode (more on this below).
The chart will immediately show the best results of the default Auto mode. You can switch Part's to try to find even better results in the table.
Now you can display any result from the table on the chart by entering its ID in the settings.
Repeat steps 3-4 until you determine which type of Stop Loss you like best. Then set it in the settings instead of Auto mode.
* Example: I flipped through 14 parts before I liked the first result and entered its ID so I could visually evaluate it on the chart.
Then select the stop loss type, choose it in place of Auto mode and repeat steps 3-4 or immediately follow the recommendations of the algorithm.
Now the Genetic Algorithm at the bottom right will prompt you to enter the Parameters you need to search for and select even better results.
Parameters must be entered All at once before they are updated. Enter recommendations strictly in fields with the same names.
Repeat steps 5-6 until there are approximately 10 Part's left or as you like. And after that, easily pour through the remaining Parts and select the best parameters.
━ Example of the finished result.
━ Example of use with Takes
You can also test at the same time along with Take Profit. In this example, I simply enabled Risk/Reward mode and immediately specified in the TP field Maximum RR, Minimum RR and Step. So in this example I can test (3-1) / 0.1 = 20 Takes of different sizes. There are additional tips in the settings.
━
* Soon you will start to understand how the system works and things will become much easier.
* If something doesn't work, just reset the engine settings and start over again.
* Use the tips I have left in the settings and on the Panel.
━ Details:
Sort ━ Sorting results by Score, Profit, Trades, etc..
Filter ━ Filtring results by Score, Profit, Trades, etc..
Trade Type ━ Ability to disable Long\Short but only from statistics.
BackWin ━ Backtest Window Number of Candle the script can test.
Manual Start ━ Enabling it will allow you to call a Stop from a selected point. which you selected when you started the engine.
* If you have a real open position then this mode can help to save good Stop\Take for it.
1 - 9 Сheckboxs ━ Allow you to disable any stop from Auto mode.
Ex Source - Allow you to test Stops/Takes from connected indicators.
Connection guide:
//@version=6
indicator("My script")
rsi = ta.rsi(close, 14)
buy = not na(rsi) and ta.crossover (rsi, 40) // OS = 40
sell = not na(rsi) and ta.crossunder(rsi, 60) // OB = 60
Signal = buy ? +1 : sell ? -1 : 0
plot(Signal, "🔌Connector🔌", display = display.none)
* Format the signal for your indicator in a similar style and then select it in Ex Source.
⭕️ How it Works
Hypothesis of Uniform Distribution of Rare Elements After Mixing.
'This hypothesis states that if an array of N elements contains K valid elements, then after mixing, these valid elements will be approximately uniformly distributed.'
'This means that in a random sample of k elements, the proportion of valid elements should closely match their proportion in the original array, with some random variation.'
'According to the central limit theorem, repeated sampling will result in an average count of valid elements following a normal distribution.'
'This supports the assumption that the valid elements are evenly spread across the array.'
'To test this hypothesis, we can conduct an experiment:'
'Create an array of 1,000,000 elements.'
'Select 1,000 random elements (1%) for validation.'
'Shuffle the array and divide it into groups of 1,000 elements.'
'If the hypothesis holds, each group should contain, on average, 1~ valid element, with minor variations.'
* I'd like to attach more details to My hypothesis but it won't be very relevant here. Since this is a whole separate topic, I will leave the minimum part for understanding the engine.
Practical Application
To apply this hypothesis, I needed a way to generate and thoroughly mix numerous possible combinations. Within Pine, generating over 100,000 combinations presents significant challenges, and storing millions of combinations requires excessive resources.
I developed an efficient mechanism that generates combinations in random order to address these limitations. While conventional methods often produce duplicates or require generating a complete list first, my approach guarantees that the first 10% of possible combinations are both unique and well-distributed. Based on my hypothesis, this sampling is sufficient to determine optimal testing parameters.
Most generators and randomizers fail to accommodate both my hypothesis and Pine's constraints. My solution utilizes a simple Linear Congruential Generator (LCG) for pseudo-randomization, enhanced with prime numbers to increase entropy during generation. I pre-generate the entire parameter range and then apply systematic mixing. This approach, combined with a hybrid combinatorial array-filling technique with linear distribution, delivers excellent generation quality.
My engine can efficiently generate and verify 300 unique combinations per batch. Based on the above, to determine optimal values, only 10-20 Parts need to be manually scrolled through to find the appropriate value or range, eliminating the need for exhaustive testing of millions of parameter combinations.
For the Score statistic I applied all the same, generated a range of Weights, distributed them randomly for each type of statistic to avoid manual distribution.
Score ━ based on Trade, Profit, WinRate, Profit Factor, Drawdown, Sharpe & Sortino & Omega & Calmar Ratio.
⭕️ Notes
For attentive users, a little tricks :)
To save time, switch parts every 3 seconds without waiting for it to load. After 10-20 parts, stop and wait for loading. If the pause is correct, you can switch between the rest of the parts without loading, as they will be cached. This used to work without having to wait for a pause, but now it does slower. This will save a lot of time if you are going to do a deeper backtest.
Sometimes you'll get the error “The scripts take too long to execute.”
For a quick fix you just need to switch the TF or Ticker back and forth and most likely everything will load.
The error appears because of problems on the side of the site because the engine is very heavy. It can also appear if you set too long a period for testing in BackWin or use a heavy indicator for testing.
Manual Start - Allow you to Start you Result from any point. Which in turn can help you choose a good stop-stick for your real position.
* It took me half a year from idea to current realization. This seems to be one of the few ways to build something automatic in backtest format and in this particular Pine environment. There are already better projects in other languages, and they are created much easier and faster because there are no limitations except for personal PC. If you see solutions to improve this system I would be glad if you share the code. At the moment I am tired and will continue him not soon.
Also You can use my previosly big Backtest project with more manual settings(updated soon)

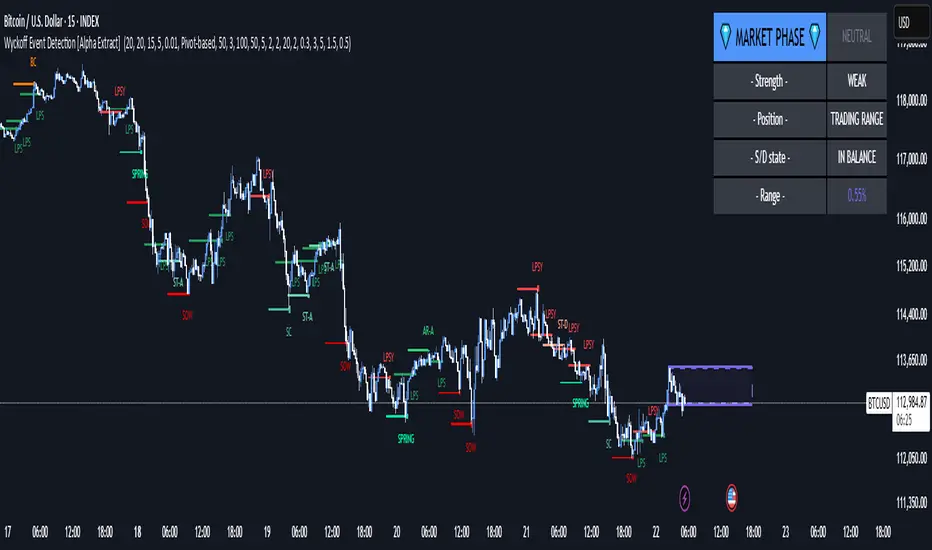
Wyckoff Event Detection [Alpha Extract]Wyckoff Event Detection
A powerful and intelligent indicator designed to detect key Wyckoff events in real time, helping traders analyze market structure and anticipate potential trend shifts. Using volume and price action, this script automatically identifies distribution and accumulation phases, providing traders with valuable insights into market behavior.
🔶 Phase-Based Detection
Utilizes a phase detection algorithm that evaluates price and volume conditions to identify accumulation (bullish) and distribution (bearish) events. This method ensures the script effectively captures major market turning points and avoids noise.
🔶 Multi-Factor Event Recognition
Incorporates multiple event conditions, including upthrusts, selling climaxes, and springs, to detect high-probability entry and exit points. Each event is filtered through customizable sensitivity settings, ensuring precise detection aligned with different trading styles.
🔶 Customizable Parameters
Fine-tune event detection with adjustable thresholds for volume, price movement, trend strength, and event spacing. These inputs allow traders to personalize the script to match their strategy and risk tolerance.
// === USER INPUTS ===
i_volLen = input.int(20, "Volume MA Length", minval=1)
i_priceLookback = input.int(20, "Price Pattern Lookback", minval=5)
i_lineLength = input.int(15, "Line Length", minval=5)
i_labelSpacing = input.int(5, "Minimum Label Spacing (bars)", minval=1, maxval=20)
❓How It Works
🔶 Event Identification
The script scans for key Wyckoff events by analyzing volume spikes, price deviations, and trend shifts within a user-defined lookback period. It categorizes events into bullish (accumulation) or bearish (distribution) structures and plots them directly on the chart.
// === EVENT DETECTION ===
volMA = ta.sma(volume, i_volLen)
highestHigh = ta.highest(high, i_priceLookback)
lowestLow = ta.lowest(low, i_priceLookback)
🔶 Automatic Filtering & Cleanup
Unconfirmed or weak signals are filtered out using customizable strength multipliers and volume thresholds. Events that do not meet the minimum conditions are discarded to keep the chart clean and informative.
🔶 Phase Strength Analysis
The script continuously tracks bullish and bearish event counts to determine whether the market is currently in an accumulation, distribution, or neutral phase. This allows traders to align their strategies accordingly.
🔶 Visual Alerts & Labels
Detects and labels key Wyckoff events directly on the chart, providing immediate insights into market conditions:
- PSY (Preliminary Supply) and UT (Upthrust) for distribution phases.
- PS (Preliminary Support) and SC (Selling Climax) for accumulation phases.
- Labels adjust dynamically to avoid chart clutter and improve readability.
🔶 Entry & Exit Optimization
By highlighting supply and demand imbalances, the script assists traders in identifying optimal entry and exit points. Wyckoff concepts such as springs and upthrusts provide clear trade signals based on market structure.
🔶 Trend Confirmation & Risk Management
Observing how price reacts to detected events helps confirm trend direction and potential reversals. Traders can place stop-loss and take-profit levels based on Wyckoff phase analysis, ensuring strategic trade execution.
🔶 Table-Based Market Analysis (Table)
A built-in table summarizes:
- Market Phase: Accumulation, Distribution, or Neutral.
- Strength of Phase: Weak, Moderate, or Strong.
- Price Positioning: Whether price is near support, resistance, or in a trading range.
- Supply/Demand State: Identifies whether the market is supply or demand dominant.
🔶 Why Choose Wyckoff Market Phases - Alpha Extract?
This indicator offers a systematic approach to understanding market mechanics through the lens of Wyckoff's time-tested principles. By providing clear and actionable insights into market phases, it empowers traders to make informed decisions, enhancing both confidence and performance in various trading environments.
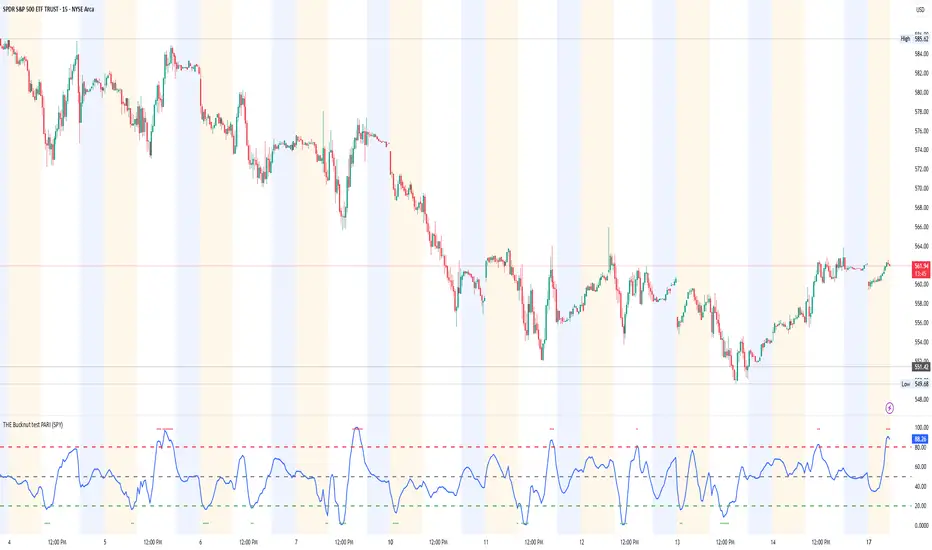
THE Bucknut test PARI (SPY)📌 THE Bucknut Test PARI – Market Momentum & Volatility Gauge
🔹 Description
THE Bucknut Test PARI Indicator is a momentum and volatility-based market gauge designed to provide clear, actionable insights on price movement. This indicator calculates a Price Action Relative Index (PARI) score to help traders evaluate risk and potential market reversals.
It utilizes exponential moving average (EMA)-based momentum, standard deviation volatility, and SPY correlation to generate a PARI score between 1-100. The score is then categorized into risk zones, helping traders identify when conditions are favorable for entries or caution is needed.
Ideal for intraday traders, options traders (including SPX 0DTE), and swing traders looking to gauge volatility-driven market shifts.
🔥 Features & Functionality
✅ Momentum Calculation via EMA Filtering – Ensures smooth, responsive signals.
✅ Volatility-Based Adjustments – Uses standard deviation-based volatility scaling.
✅ SPY Correlation Filtering – Helps align momentum signals with market sentiment.
✅ User-Defined Timeframe Settings – Adjusts dynamically based on selected time intervals.
✅ Customizable Risk Thresholds – Allows traders to define high-risk, neutral, and low-risk zones.
✅ Non-Repainting Algorithm – Ensures reliable, static signals without revision.
⚙️ Settings & Adjustments
Setting Default Value Description
Time Frame Mode "5m-15m" Choose between 1m-3m, 5m-15m, or 1H-Daily. Affects smoothing values.
Scaling Factor 10 Adjusts PARI score sensitivity. Higher values amplify movement.
Background Color Black Custom background for the indicator panel.
Background Transparency 85 Controls indicator panel opacity (0 = solid, 100 = invisible).
High-Risk Threshold 80 Above this level, market is in overbought/high-risk conditions.
Low-Risk Threshold 20 Below this level, market is oversold/low-risk for potential reversals.
Neutral Level 50 Middle ground where price action is balanced.
📈 How to Use THE Bucknut Test PARI
🔴 Above 80 (High-Risk Zone)
Market may be overheated, strong momentum may fade or reverse soon.
Caution with calls; potential put opportunities.
🟢 Below 20 (Low-Risk Zone)
Market is oversold, potential reversal or bounce incoming.
Consider long entries or avoiding shorts.
⚪ Between 20-80 (Neutral Zone)
Market is in equilibrium; follow primary trend direction.
No extreme risk, trend-following strategies preferred.
🔍 Example Use Cases
✔ Intraday Traders → Gauge market strength on short-term charts (1m-15m).
✔ SPX 0DTE Options Traders → Time high-confidence call/put setups.
✔ Swing Traders → Identify periods of excessive momentum or exhaustion.
Liquidity Hunt SwiftEdgeThe "Liquidity Hunt Dashboard By SwiftEdge" indicator is designed to assist traders in identifying potential liquidity zones by placing a dynamic target line based on swing points and weighted liquidity. It leverages technical analysis tools such as SMA (Simple Moving Average), pivot points, and volume to predict market movements and provides daily statistics on hits and success rate. The target line updates automatically when the price hits it, adapting to the market trend (up, down, or neutral). A dashboard displays the current price, target level, prediction, and trend, making it easy to make informed trading decisions.
Features:
Target Line: A yellow dashed line marks the next expected liquidity level (up to approximately 20 pips away on 1m).
Prediction: Displays "Up (Chasing Sell Liquidity)," "Down (Chasing Buy Liquidity)," or "Neutral" based on trend and liquidity.
Daily Statistics: Tracks hits and success rate, resetting daily.
Trend Indicator: Shows market direction ("Up," "Down," or "Neutral") in the dashboard.
Dynamic Updates: The line moves to a new target level when the price hits the current target.
Recommended Settings for 1-Minute Timeframe:
For Indices (e.g., S&P 500):
Lookback Period: 180 (3 hours to capture more stable swing points).
Max Distance (%): 0.015 (approximately 15 pips, suitable for indices).
Cooldown Period: 5 (stabilizes after hits).
Line Duration: 60 (displays the line for 1 hour).
For Crypto (e.g., BTC/USD):
Lookback Period: 120 (2 hours to capture short-term swing points).
Max Distance (%): 0.024 (approximately 20 pips, suitable for volatile crypto markets).
Cooldown Period: 5.
Line Duration: 60.
For Forex (e.g., EUR/USD):
Lookback Period: 180 (3 hours for greater data density in less volatile markets).
Max Distance (%): 0.012 (approximately 10-12 pips, suitable for forex).
Cooldown Period: 5.
Line Duration: 60.
Guide for Higher Timeframes:
This indicator can be adapted for higher timeframes (e.g., 5m, 15m, 1H) by adjusting the settings to account for larger price movements and slower market dynamics. Follow these steps:
Select Your Timeframe: Switch your chart to the desired timeframe (e.g., 5m, 15m, or 1H).
Adjust Lookback Period: Increase the "Lookback Period" to cover a longer historical period. For example:
5m: Set to 360 (equivalent to 6 hours).
15m: Set to 480 (equivalent to 8 hours).
1H: Set to 720 (equivalent to 12 hours).
Adjust Max Distance (%): Higher timeframes require larger targets to account for bigger price swings. For example:
5m: Increase to 0.05 (approximately 50 pips).
15m: Increase to 0.1 (approximately 100 pips).
1H: Increase to 0.2 (approximately 200 pips).
Adjust Cooldown Period: On higher timeframes, you may want a longer cooldown to avoid frequent updates. For example:
5m: Set to 10.
15m: Set to 15.
1H: Set to 20.
Adjust Line Duration: Extend the duration the line is displayed to match the timeframe. For example:
5m: Set to 120 (equivalent to 10 hours).
15m: Set to 240 (equivalent to 60 hours).
1H: Set to 480 (equivalent to 20 days).
Monitor the Dashboard: The dashboard will still show the target level, prediction, and trend, but the values will now reflect the larger timeframe's dynamics.
Usage Instructions:
Set your chart to a 1-minute timeframe (or follow the higher timeframe guide).
Adjust the settings based on the market and timeframe (see recommendations above).
Monitor the dashboard for the current price, target level, and prediction.
Use the yellow line as a potential entry or exit level, and adjust your strategy based on the trend and statistics.
Notes:
This indicator is intended solely for educational and analytical purposes and should not be considered financial advice.
Test the indicator on a demo account before using it with real funds.
The indicator complies with TradingView guidelines by not providing trading advice, automated trading signals, or guarantees of profit.

Supertrend and Fast and Slow EMA StrategyThis strategy combines Exponential Moving Averages (EMAs) and Average True Range (ATR) to create a simple, yet effective, trend-following approach. The strategy filters out fake or sideways signals by incorporating the ATR as a volatility filter, ensuring that trades are only taken during trending conditions. The key idea is to buy when the short-term trend (Fast EMA) aligns with the long-term trend (Slow EMA), and to avoid trades during low volatility periods.
How It Works:
EMA Crossover:
1). Buy Signal: When the Fast EMA (shorter-term, e.g., 20-period) crosses above the Slow EMA (longer-term, e.g., 50-period), this indicates a potential uptrend.
2). Sell Signal: When the Fast EMA crosses below the Slow EMA, this indicates a potential downtrend.
ATR Filter:
1). The ATR (Average True Range) is used to measure market volatility.
2). Trending Market: If the ATR is above a certain threshold, it indicates high volatility and a trending market. Only when ATR is above the threshold will the strategy generate buy/sell signals.
3). Sideways Market: If ATR is low (sideways or choppy market), the strategy will suppress signals to avoid entering during non-trending conditions.
When to Buy:
1). Condition 1: The Fast EMA crosses above the Slow EMA.
2). Condition 2: The ATR is above the defined threshold, indicating that the market is trending (not sideways or choppy).
When to Sell:
1). Condition 1: The Fast EMA crosses below the Slow EMA.
2). Condition 2: The ATR is above the defined threshold, confirming that the market is in a downtrend.
When Not to Enter the Trade:
1). Sideways Market: If the ATR is below the threshold, signaling low volatility and sideways or choppy market conditions, the strategy will not trigger any buy or sell signals.
2). False Crossovers: In low volatility conditions, price action tends to be noisy, which could lead to false signals. Therefore, avoiding trades during these periods reduces the risk of false breakouts.
Additional Factors to Consider Adding:
=> RSI (Relative Strength Index): Adding an RSI filter can help confirm overbought or oversold conditions to avoid buying into overextended moves or selling too low.
1). RSI Buy Filter: Only take buy signals when RSI is below 70 (avoiding overbought conditions).
2). RSI Sell Filter: Only take sell signals when RSI is above 30 (avoiding oversold conditions).
=> MACD (Moving Average Convergence Divergence): Using MACD can help validate the strength of the trend.
1). Buy when the MACD histogram is above the zero line and the Fast EMA crosses above the Slow EMA.
2). Sell when the MACD histogram is below the zero line and the Fast EMA crosses below the Slow EMA.
=> Support/Resistance Levels: Adding support and resistance levels can help you understand market structure and decide whether to enter or exit a trade.
1). Buy when price breaks above a significant resistance level (after a valid buy signal).
2). Sell when price breaks below a major support level (after a valid sell signal).
=> Volume: Consider adding a volume filter to ensure that buy/sell signals are supported by strong market participation. You could only take signals if the volume is above the moving average of volume over a certain period.
=> Trailing Stop Loss: Instead of a fixed stop loss, use a trailing stop based on a percentage or ATR to lock in profits as the trade moves in your favor.
=> Exit Signals: Besides the EMA crossover, consider adding Take Profit or Stop Loss levels, or even using a secondary indicator like RSI to signal an overbought/oversold condition and exit the trade.
Example Usage:
=> Buy Example:
1). Fast EMA (20-period) crosses above the Slow EMA (50-period).
2). The ATR is above the threshold, confirming that the market is trending.
3). Optionally, if RSI is below 70, the buy signal is further confirmed as not being overbought.
=> Sell Example:
1). Fast EMA (20-period) crosses below the Slow EMA (50-period).
2). The ATR is above the threshold, confirming that the market is trending.
3). Optionally, if RSI is above 30, the sell signal is further confirmed as not being oversold.
Conclusion:
This strategy helps to identify trending markets and filters out sideways or choppy market conditions. By using Fast and Slow EMAs combined with the ATR volatility filter, it provides a reliable approach to catching trending moves while avoiding false signals during low-volatility, sideways markets.

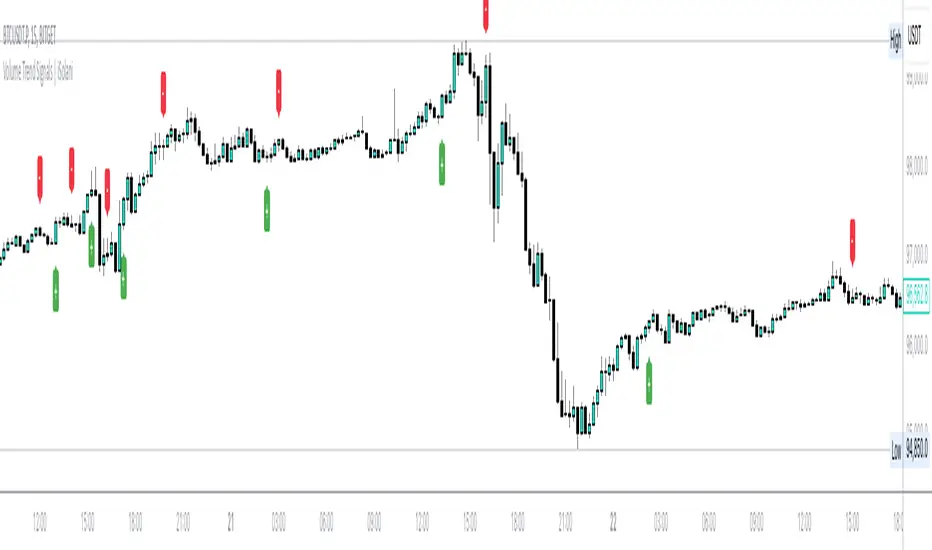
Volume Trend Signals | iSolani
Volume Trend Signals | iSolani: Syncing Price Momentum with Volume Confirmation
In the dance between price action and volume, discerning true trend commitment requires seeing how institutional players vote with their capital. The Volume Trend Signals | iSolani illuminates this interplay by generating precise crossover signals when volume-accelerated price movements gain sustained traction. Unlike conventional volume oscillators, it employs a two-layered confirmation system —blending volatility-adjusted thresholds with adaptive smoothing—to spotlight high-probability entries aligned with smart-money activity.
Core Methodology
The indicator executes a five-phase process to filter meaningful trends:
Logarithmic Price Scaling: Measures percentage-based price changes via HLC3 typical price, reducing large-value bias in volatile markets.
Volatility Dynamic Filter: Uses a 30-bar standard deviation of price changes, scaled by user sensitivity (default 2x), to set momentum thresholds.
Volume Governance: Caps raw volume at 3x its 40-bar SMA, neutralizing outlier spikes while preserving institutional footprints.
Directional Flow Accumulation: Sums volume as positive/negative based on whether price movement breaches volatility-derived boundaries.
Signal Refinement: Smooths the Volume Flow Indicator (VFI) with a 3-bar SMA, then triggers alerts via crosses over a 20-bar EMA signal line.
Breaking New Ground
This tool introduces three evolutionary improvements over traditional volume indicators:
EMA Convergence Signals: Unlike basic zero-cross systems, it requires VFI to overtake its own EMA, confirming sustained momentum shifts.
Context-Aware Volume: The 3x volume cap adapts to current market activity, preventing false signals during news-driven liquidity spikes.
Minimalist Visual Alerts: Uses and symbols below/above candles, reducing chart clutter while emphasizing pivotal moments.
Engine Under the Hood
The script’s logic flows through four computational stages:
Data Conditioning: Computes HLC3 and its log-based rate of change for normalized price analysis.
Threshold Calibration: Derives dynamic entry/exit levels from 30-period volatility multiplied by user sensitivity.
Volume Processing: Filters and signs volume based on price meeting threshold criteria.
Signal Generation: Triggers buy/sell labels when the 3-bar SMA of cumulative flow crosses the 20-bar EMA.
Standard Configuration
Optimized defaults balance responsiveness and reliability:
VFI Length: 40-bar accumulation window
Sensitivity: 2.0 (double the volatility-derived threshold)
Signal Smoothing: 20-bar EMA
Volume Cap: 3x average (hidden parameter)
Smoothing: Enabled (3-bar SMA on VFI)
By fusing adaptive volume filtering with EMA-confirmed momentum, the Volume Trend Signals | iSolani cuts through market noise to reveal institutional-grade trend inflection points. Its unique crossover logic—prioritizing confirmation over speed—makes it particularly effective in swing trading and trend-following strategies across equities, commodities, and forex markets.
Engulfing Pattern with Volume and EMAs
**Strategy Overview:
This strategy combines price action (Engulfing patterns), volume analysis, trend confirmation (EMAs), and noise reduction (ATR filter) to generate high-probability trading signals.
Engulfing Pattern with Volume, EMAs, and Market Noise Filter**
This strategy identifies bullish and bearish Engulfing candlestick patterns, combined with volume analysis, moving averages (EMAs), and a market noise filter to generate trading signals.
**Key Components:**
1. **Engulfing Pattern Detection:**
- **Bullish Engulfing**: A green candle completely engulfs the previous red candle.
- **Bearish Engulfing**: A red candle completely engulfs the previous green candle.
2. **Volume Filter:**
- Signals are validated only if the current volume is higher than the 20-period Simple Moving Average (SMA) of volume.
3. **EMA Indicators:**
- Three EMAs are plotted: 50-period (blue), 89-period (orange), and 200-period (red).
- These EMAs help identify the trend direction and provide additional confirmation.
4. **Market Noise Filter:**
- Uses the Average True Range (ATR) to filter out insignificant price movements.
- A signal is considered valid only if the price movement (absolute difference between open and close) is greater than 0.5 times the 14-period ATR.
**Trading Signals:**
**Buy Signal**:
- Bullish Engulfing pattern + High volume (above SMA 20) + Significant price movement (filtered by ATR).
- Plotted as a green "BUY" label below the candle.
**Sell Signal**:
- Bearish Engulfing pattern + High volume (above SMA 20) + Significant price movement (filtered by ATR).
- Plotted as a red "SELL" label above the candle.
**Customization:**
- Users can adjust EMA lengths, volume SMA period, and ATR multiplier to suit their trading preferences.
Enhanced Volume Profile█ OVERVIEW
The Enhanced Volume Profile (EVP) is an indicator designed to plot a volume profile on the chart based on either the visible chart range or a fixed lookback period. The script helps analyze the distribution of volume at different price levels over time, providing insights into areas of high trading activity and potential support/resistance zones.
█ KEY FEATURES
1. Visible Chart Range vs. Fixed Lookback Depth
Visible Chart Range
- Default analysis mode
- Calculates profile based on visible portion of the chart
- Dynamically updates with chart view changes
Fixed Lookback Depth
- Optional alternative to visible range
- Uses specified number of bars (10-3000)
- Provides consistent analysis depth
- Independent of chart view
2. Custom Resolution
Auto-Resolution Mode
Automatically selects timeframes based on chart's current timeframe:
≤ 1 minute: Uses 1-minute resolution
≤ 5 minutes: Uses 1-minute resolution
≤ 15 minutes: Uses 5-minute resolution
≤ 1 hour: Uses 5-minute resolution
≤ 4 hours: Uses 15-minute resolution
≤ 12 hours: Uses 15-minute resolution
≤ 1 day: Uses 1-hour resolution
≤ 3 days: Uses 2-hours resolution
≤ 1 week: Uses 4-hours resolution
Custom Resolution Override
Optional override of auto-resolution system
Provides control over data granularity
Must be lower than or equal to chart's timeframe
Falls back to auto-resolution if validation fails
3. Volume Profile Resolution
Adjustable number of points (10-400)
Controls profile granularity
Higher resolution provides more detail
Balance between precision and performance
4. Point of Control (PoC)
Identifies price level with highest traded volume
Optional display with customizable appearance
Adjustable line thickness (1-30)
Configurable color
5. Value Area (VA)
Shows price range of majority trading volume
Adjustable coverage (5-95%), default is 68%
Customizable boundary lines
Configurable lines color and thickness (1-20)
█ INPUT PARAMETERS
Lookback Settings
Use Visible Chart Range
- Default: true
- Calculates profile based on visible bars
- Ideal for focused analysis
Fixed Lookback Bars
- Range: 10-3000
- Default: 200
- Used when visible range is disabled
Resolution Settings
Enable Custom Resolution
- Default: false
- Overrides auto-resolution
Custom Resolution
- Default: 1-minute
- Changes automatically when "Enable Custom Resolution" is disabled
Volume Profile Appearance
Profile Resolution
- Range: 10-400
- Default: 200
- Controls detail level
Profile Width Scale
- Range: 1-50
- Default: 15
- Adjusts profile width
Right Offset
- Range: 0-500
- Default: 20
- Controls spacing from price bars
Profile Fill Color
- Default: #5D606B (70% transparency)
Point of Control Settings
Show Point of Control
- Default: true
- Toggles PoC visibility
PoC Line Thickness
- Range: 1-30
- Default: 1
PoC Line Color
- Default: Red
Value Area Settings
Show Value Area
- Default: true
- Toggles VA lines
Value Area Coverage
- Range: 5-95%
- Default: 68%
Value Area Line Color
- Default: Blue
Value Area Line Thickness
- Range: 1-20
- Default: 1
█ TECHNICAL IMPLEMENTATION DETAILS
Exceeding Bars Management
The script dynamically adjusts the number of bars used in the volume profile calculation based on the selected timeframe and the maximum allowed bars (max_bars_back).
If the total number of bars exceeds the predefined threshold (6000 bars), the script reduces the lookback period (lookback_bars) by trimming some of the historical data, ensuring the chart does not become overloaded with data.
The adjustment is made based on the ratio of bars per candle (bars_per_candle), ensuring that the volume profile remains computationally efficient while maintaining its relevance.
█ EXAMPLE USE CASES
1. Visible Range Mode
For analyzing a recent trend and focusing on only the visible part of the chart, enabling the "Use Visible Chart Range" option calculates the profile based on the current view, without considering historical data outside the visible area.
2. Fixed Lookback Depth
For analyzing a specific period in the past (e.g., the last 200 bars), disabling the visible range and setting a fixed lookback depth of 200 bars ensures the profile always considers the last 200 bars, regardless of the visible range.
3. Custom Resolution
If there’s a need for greater control over the timeframe used for volume profile calculations (e.g., using a 5-minute resolution on a 15-minute chart), enabling custom resolution and setting the desired timeframe provides this control.
HAPPY TRADING ✌️

Multi Stochastic AlertHello Everyone,
I have created a Multi Stochastic Alert based on Scalping Strategy
The Strategy uses below 4 Stochastic indicator:
1. Stochastic (9,3)
2. Stochastic (14,3)
3. Stochastic (40,4)
4. Stochastic (60,10)
Trade entry become active when all of these goes below 20 or above 80, In this indicator you don't need to use all 4, this will show red and green background whenever all of them goes below 20 or above 80.
As shown in picture below, it works better when script is making a channel, Our indicator shows green or red signal, we wait for RSI Divergence and we enter. We book when blue line (9,3) goes above 80, as shown by arrow, and trail rest at breakeven or your own trailing method
Same Situation shown for Short side. We book 50% when Blue line (9,3) Goes below 20 and trail rest at breakeven or your own trailing method
Happy trading, Let me know if any improvements required.

Display MB on BarsDescription
The "Display MB on Bars" Pine Script indicator is designed to visually represent Market Breadth values and R4.5 scores on trading charts. This script enables traders to highlight and analyze key market behavior using pre-defined thresholds for MB scores and dynamically calculated R4.5 values. Additionally, it includes a moving average status table to assess price levels relative to the 10-day and 20-day moving averages.
Features:
1. COB Date Matching: Displays data corresponding to specific "COB dates" provided by the user.
2. MB Value Visualization:
o Highlights bars with a background color based on MB values:
Red if MB ≤ MB_Red (default: -1).
Green if MB ≥ MB_Green (default: 3).
3. R4.5 Scores Display:
o Creates a label on the chart with the MB and R4.5 values when conditions are met (e.g., R4.5 > 200 or specific MB thresholds).
4. Index Moving Average Comparison:
o Calculates 10-day and 20-day moving averages for the selected symbol (default: NSE:NIFTYMIDSML400).
o Shows the price position relative to these moving averages in a table.
How to Use:
1. Configure Inputs:
o COB Dates: Enter a comma-separated list of dates in the format DD-MM-YYYY.
o MB Values: Provide the corresponding MB scores for the COB dates.
o R4.5 Values: Provide the R4.5 scores for the COB dates.
o Set the thresholds for MB values (MB Red<= and MB Green>=).
o Toggle features like MB, RS (R4.5), and the moving average status table.
2. Interpret the Output:
o Observe background colors on the bars:
Red: Indicates MB is less than or equal to the lower threshold.
Green: Indicates MB exceeds the upper threshold.
o Check labels above bars for R4.5 and MB values when conditions are met.
o Refer to the status table on the top-right corner to understand price positions relative to 10-day and 20-day moving averages.
This script is especially useful for traders seeking insights into custom metrics like MB and R4.5, enabling quick identification of key patterns and trends in the market.
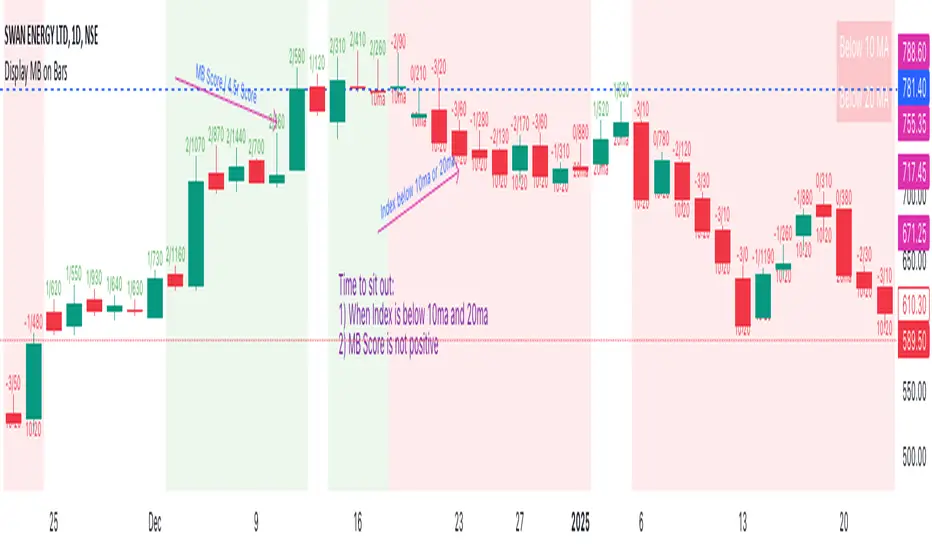
Dynamic Time Zone EMA with Candle Trend AnalysisCandleTrend TZ is a powerful analytical tool that integrates time zones, exponential moving averages (EMA), and custom candle coloring based on trend direction. This indicator is ideal for traders looking to analyze market trends within specific time sessions effectively.
Key Features:
Time Zones:
Divides the chart into four distinct time intervals, each highlighted with a unique background color.
Fully customizable start and end times for each interval, allowing for adaptation to various trading schedules.
Exponential Moving Averages (EMA):
Displays three EMAs with user-defined lengths:
EMA 200 (blue) for long-term trends.
EMA 50 (green) for medium-term trends.
EMA 20 (red) for short-term trends.
Helps identify trend direction and strength.
Custom Candle Coloring:
Utilizes smoothed Heiken Ashi and Triple EMA (TEMA) calculations for enhanced candle coloring:
Green candles indicate an upward trend.
Red candles signal a downward trend.
Filters out market noise, providing a clear visual representation of market dynamics.
Customization Options:
Time Zones:
Adjustable start and end times for each of the four sessions:
Input hour and minute for start and end times (e.g., Interval 1 Start/End Hour/Minute).
Background colors are pre-defined but can be modified in the code.
EMAs:
User-defined lengths for each EMA:
EMA 200 Length (default: 200)
EMA 50 Length (default: 50)
EMA 20 Length (default: 20)
TEMA Settings:
Parameters for trend smoothing:
TEMA Length (default: 55)
EMA Length (default: 60)
Use Cases:
Intraday Session Analysis:
Use time zones to differentiate between morning, afternoon, and evening market activity.
The background colors make it easy to track session-specific trends.
Trend Trading:
Analyze EMA crossings and their slopes to confirm market direction.
Green candles indicate buying opportunities, while red candles highlight selling signals.
Noise Reduction:
TEMA smoothing removes market noise, allowing you to focus on the primary market trend.
Adaptation to Custom Strategies:
By adjusting time intervals, you can tailor the indicator to specific trading styles or market conditions.
Benefits:
Versatility for both trending and sideways markets.
Intuitive and user-friendly setup.
Suitable for traders of all skill levels, from beginners to professionals.
CandleTrend TZ is an indispensable tool for understanding market dynamics, enhancing your trading precision, and making well-informed decisions. 🚀
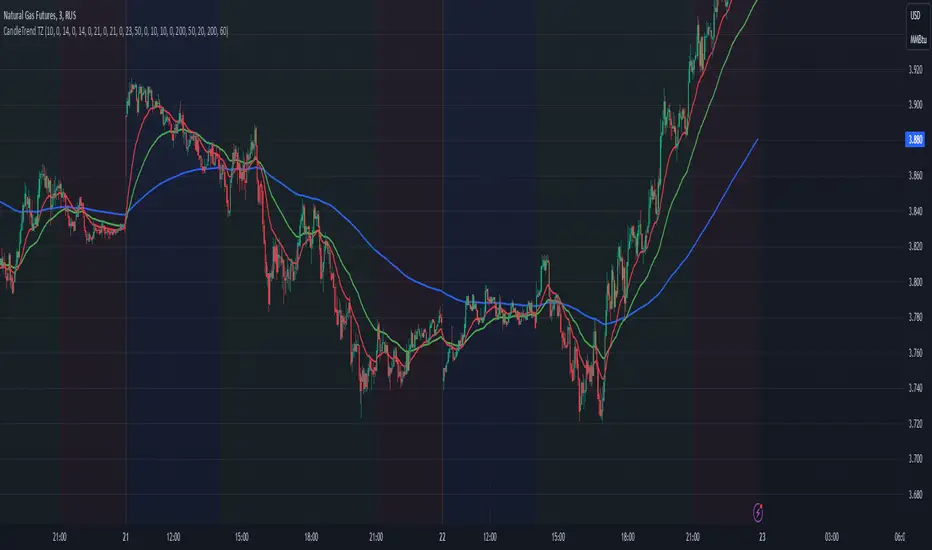
MATA GOLD RATIOMata Gold Instrument: User Guide
The Instrument to Gold Oscillator is a technical analysis tool that normalizes the ratio of an instrument's price (e.g., BTC/USD) to the price of gold (XAU/USD) into a 0-100 scale. This provides a clear and intuitive way to evaluate the relative performance of an instrument compared to gold over a specified period.
---
How It Works
1. Calculation of the Ratio:
The ratio is calculated as:
\text{Ratio} = \frac{\text{Instrument Price}}{\text{Gold Price}}
2. Normalization:
The ratio is normalized using the highest and lowest values over a user-defined period (length), typically 14 periods:
\text{Normalized Ratio} = \frac{\text{Ratio} - \text{Min(Ratio)}}{\text{Max(Ratio)} - \text{Min(Ratio)}} \times 100
3. Overbought/Oversold Levels:
Above 80: The instrument is relatively expensive compared to gold (overbought).
Below 20: The instrument is relatively cheap compared to gold (oversold).
---
How to Use the Oscillator
1. Identify Overbought and Oversold Levels:
If the oscillator rises above 80, the instrument may be overvalued relative to gold. This could signal a potential reversal or correction.
If the oscillator falls below 20, the instrument may be undervalued relative to gold. This could signal a buying opportunity.
2. Track Trends:
Rising oscillator values indicate the instrument is gaining value relative to gold.
Falling oscillator values indicate the instrument is losing value relative to gold.
3. Crossing the Midline (50):
When the oscillator crosses above 50, the instrument's value is gaining strength relative to gold.
When it crosses below 50, the instrument is weakening relative to gold.
4. Combine with Other Indicators:
Use this oscillator alongside other technical indicators (e.g., RSI, MACD, STOCH) for more robust decision-making.
Confirm signals from the oscillator with price action or volume analysis.
---
Example Scenarios
1. Trading Cryptocurrencies Against Gold:
If BTC/USD's oscillator value is above 80, Bitcoin may be overvalued relative to gold. Consider reducing exposure or looking for short opportunities.
If BTC/USD's oscillator value is below 20, Bitcoin may be undervalued relative to gold. This could be a good time to accumulate.
2. Commodities vs. Gold:
Analyze the relative strength of commodities (e.g., oil, silver) against gold using the oscillator to identify periods of overperformance or underperformance.
---
Advantages of the Oscillator
Relative Performance Insight: Tracks the performance of an instrument relative to gold, providing a macro perspective.
Clear Visual Representation: The 0-100 scale makes it easy to identify overbought/oversold conditions and trend shifts.
Customizable Periods: The user-defined length allows flexibility in analyzing short- or long-term trends.
---
Limitations
Dependence on Gold: As the oscillator is based on gold prices, any external shocks to gold (e.g., geopolitical events) can influence its signals.
No Absolute Buy/Sell Signals: The oscillator should not be used in isolation but as part of a broader analysis strategy.
---
By using the Instrument to Gold Oscillator effectively, traders and investors can gain valuable insights into the relative valuation and performance of assets compared to gold, enabling more informed trading and investment decisions.

StockInfo ManualScript Description:
The StockInfo Manual is designed to display detailed stock information directly on the chart for the selected symbol. It processes user-provided input data, including
stock symbols
Industries
Relative Strength (RS) values
Band information
Key Features:
1. Symbol-Specific Data Display: Displays information only for the current chart symbol.
2. Customizable Table: Adjust the table's position, text size, colors, and headers to match your preferences.
3. Low RS/Band Conditions: Highlights critical metrics (RS < 50 or Band < 6) with a red background for quick visual cues.
4. Toggle Information: Choose to show or hide RS, Band, and Industry columns based on your needs.
How to Use the Script:
1. Use any platform (ex: chartsmaze) to get Industry,RS and Band information of any Stock. Prepare the data as separate column of excel
2. Configure Inputs:
- Stock Symbols (`Stock`): Enter a comma-separated list of stock symbols (e.g.,
NSE:ABDL,
NSE:ABFRL,
NSE:ABREL,
NSE:ABSLAMC,
NSE:ACC,
NSE:ACE,
- Industries (`Industry`): Provide a comma-separated list of industries for the stocks (e.g., 103-Brewerie,
109-Retail-D,
92-Paper & ,
19-Asset Ma,
62-Cement,
58-Industri,
- Relative Strength (`RS`): Input RS values for each stock (e.g.,
83,
52,
51,
81,
23,
59,
- Band Information (`Band`): Specify Band values for each stock. Use "No Band" if 10,
No Band,
20,
20,
No Band,
20,
3. Customize the Table:
-Display Options: Toggle the visibility of `RS`, `Band`, and `Industry` using the input checkboxes.
-Position and Appearance: Choose the table's position on the chart (e.g., top-right, bottom-center). Customize text size, background colors, header display, and other visual elements.
4. Interpret the Table:
- The table will dynamically display information for the current chart symbol only.
- If the `RS` is below 50 or the Band is below 6, the corresponding row is highlighted with a red background for immediate attention.
One need to enter details at least weekly for a correct result

Financials Score All Description of the "Financials Score All" Script
This Pine Script calculates a financial score for a specific stock, based on various financial metrics. The purpose is to provide a comprehensive numerical score that reflects the financial health of the stock. The score is calculated using multiple financial indicators, including profitability, valuation, debt management, and liquidity. Here’s a breakdown of what each part of the script does:
period = input.string('FQ', 'Period', options= )
FQ refers to Quarterly financial data.
FY refers to Fiscal Year financial data.
Financial Metrics:
The script uses various financial metrics to calculate the score. These are obtained via request.financial, which retrieves financial data for the stock from TradingView's database. Below are the metrics used:
opmar (Operating Margin): Measures the company's profitability as a percentage of revenue.
eps (Earnings Per Share): Represents the portion of a company's profit allocated to each outstanding share.
eps_ttm (Earnings Per Share – Trailing Twelve Months): EPS over the most recent 12 months.
pe_ratio (Price-to-Earnings Ratio): A measure of the price investors are willing to pay for a stock relative to its earnings.
pb_ratio (Price-to-Book Ratio): A valuation ratio comparing a company’s market value to its book value.
de_ratio (Debt-to-Equity Ratio): A measure of the company’s financial leverage, showing how much debt it has compared to shareholders' equity.
roe_pb (Return on Equity Adjusted to Book): Measures the company's profitability relative to its book value.
fcf_per_share (Free Cash Flow per Share): Represents the free cash flow available for dividends, debt reduction, or reinvestment, per share.
pfcf_ratio (Price-to-Free-Cash-Flow Ratio): A measure comparing a company’s market value to its free cash flow.
current_ratio (Current Ratio): A liquidity ratio that measures a company's ability to pay short-term obligations with its current assets.
RSI Calculation:
The script calculates the Relative Strength Index (RSI) for the stock using an 8-period lookback:
rsi = ta.rsi(close, 8)
Score Calculation:
The script calculates a total score by adding points based on the values of the financial metrics. Each metric is checked against a condition, and if the condition is met, the score is incremented:
If the Operating Margin (opmar) is greater than 20, the score is incremented by 20 points.
If Earnings Per Share (EPS) is positive, 10 points are added.
If the P/E ratio is between 0 and 20, 10 points are added.
If the P/B ratio is less than 3, 10 points are added.
If the Debt-to-Equity ratio is less than 0.8, 10 points are added.
If the Return on Equity Adjusted to Book is greater than 10, 10 points are added.
If the P/FCF ratio is between 0 and 15, 10 points are added.
If the Current Ratio is greater than 1.61, 10 points are added.
If the RSI is less than 35, 10 points are added.
The score is accumulated based on these conditions and stored in the total_score variable.
Displaying the Total Score:
Finally, the total score is plotted on the chart:
Summary of How It Works:
This script calculates a financial score for a stock using a variety of financial indicators. Each metric has a threshold, and when the stock meets certain criteria (for example, a good operating margin, a healthy debt-to-equity ratio, or a low P/E ratio), points are added to the overall score. The result is a single numerical value that reflects the financial health of the stock.
This score can help traders or investors identify companies with strong financials, or serve as a comparison tool between different stocks based on their financial health.
Generally >60 is the best stocks for med and long term trades
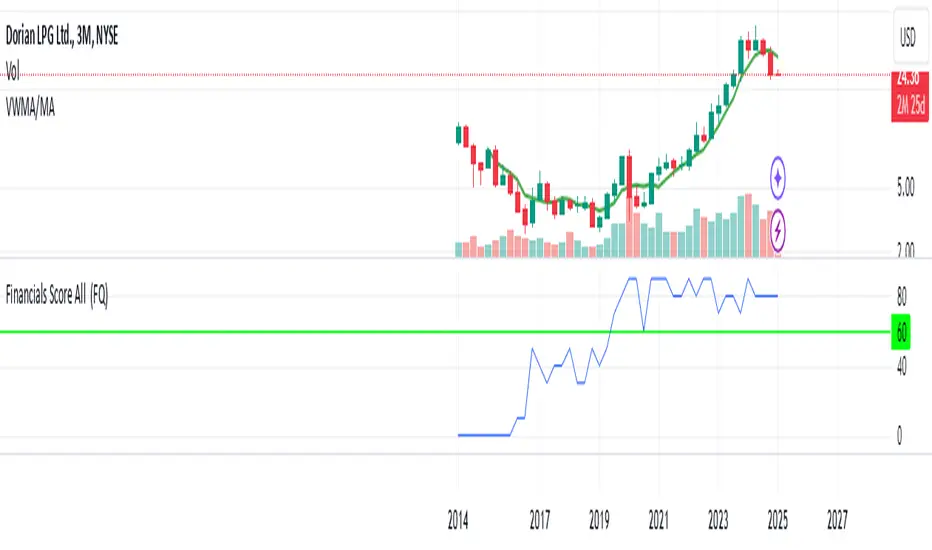
Rolling Window Geometric Brownian Motion Projections📊 Rolling GBM Projections + EV & Adjustable Confidence Bands
Overview
The Rolling GBM Projections + EV & Adjustable Confidence Bands indicator provides traders with a robust, dynamic tool to model and project future price movements using Geometric Brownian Motion (GBM). By combining GBM-based simulations, expected value (EV) calculations, and customizable confidence bands, this indicator offers valuable insights for decision-making and risk management.
Key Features
Rolling GBM Projections: Simulate potential future price paths based on drift (μμ) and volatility (σσ).
Expected Value (EV) Line: Represents the average projection of simulated price paths.
Confidence Bands: Define ranges where the price is expected to remain, adjustable from 51% to 99%.
Simulation Lines: Visualize individual GBM paths for detailed analysis.
EV of EV Line: A smoothed trend of the EV, offering additional clarity on price dynamics.
Customizable Lookback Periods: Adjust the rolling lookback periods for drift and volatility calculations.
Mathematical Foundation
1. Geometric Brownian Motion (GBM)
GBM is a mathematical model used to simulate the random movement of asset prices, described by the following stochastic differential equation:
dSt=μStdt+σStdWt
dSt=μStdt+σStdWt
Where:
StSt: Price at time tt
μμ: Drift term (expected return)
σσ: Volatility (standard deviation of returns)
dWtdWt: Wiener process (standard Brownian motion)
2. Drift (μμ) and Volatility (σσ)
Drift (μμ): Represents the average logarithmic return of the asset. Calculated using a simple moving average (SMA) over a rolling lookback period.
μ=SMA(ln(St/St−1),Lookback Drift)
μ=SMA(ln(St/St−1),Lookback Drift)
Volatility (σσ): Measures the standard deviation of logarithmic returns over a rolling lookback period.
σ=STD(ln(St/St−1),Lookback Volatility)
σ=STD(ln(St/St−1),Lookback Volatility)
3. Price Simulation Using GBM
The GBM formula for simulating future prices is:
St+Δt=St×e(μ−12σ2)Δt+σϵΔt
St+Δt=St×e(μ−21σ2)Δt+σϵΔt
Where:
ϵϵ: Random variable from a standard normal distribution (N(0,1)N(0,1)).
4. Confidence Bands
Confidence bands are determined using the Z-score corresponding to a user-defined confidence percentage (CC):
Upper Band=EV+Z⋅σ
Upper Band=EV+Z⋅σ
Lower Band=EV−Z⋅σ
Lower Band=EV−Z⋅σ
The Z-score is computed using an inverse normal distribution function, approximating the relationship between confidence and standard deviations.
Methodology
Rolling Drift and Volatility:
Drift and volatility are calculated using logarithmic returns over user-defined rolling lookback periods (default: μ=20μ=20, σ=16σ=16).
Drift defines the overall directional tendency, while volatility determines the randomness and variability of price movements.
Simulations:
Multiple GBM paths (default: 30) are generated for a specified number of projection candles (default: 12).
Each path is influenced by the current drift and volatility, incorporating random shocks to simulate real-world price dynamics.
Expected Value (EV):
The EV is calculated as the average of all simulated paths for each projection step, offering a statistical mean of potential price outcomes.
Confidence Bands:
The upper and lower bounds of the confidence bands are derived using the Z-score corresponding to the selected confidence percentage (e.g., 68%, 95%).
EV of EV:
A running average of the EV values, providing a smoothed perspective of price trends over the projection horizon.
Indicator Functionality
User Inputs:
Drift Lookback (Bars): Define the number of bars for rolling drift calculation (default: 20).
Volatility Lookback (Bars): Define the number of bars for rolling volatility calculation (default: 16).
Projection Candles (Bars): Set the number of bars to project future prices (default: 12).
Number of Simulations: Specify the number of GBM paths to simulate (default: 30).
Confidence Percentage: Input the desired confidence level for bands (default: 68%, adjustable from 51% to 99%).
Visualization Components:
Simulation Lines (Blue): Display individual GBM paths to visualize potential price scenarios.
Expected Value (EV) Line (Orange): Highlight the mean projection of all simulated paths.
Confidence Bands (Green & Red): Show the upper and lower confidence limits.
EV of EV Line (Orange Dashed): Provide a smoothed trendline of the EV values.
Current Price (White): Overlay the real-time price for context.
Display Toggles:
Enable or disable components (e.g., simulation lines, EV line, confidence bands) based on preference.
Practical Applications
Risk Management:
Utilize confidence bands to set stop-loss levels and manage trade risk effectively.
Use narrower confidence intervals (e.g., 50%) for aggressive strategies or wider intervals (e.g., 95%) for conservative approaches.
Trend Analysis:
Observe the EV and EV of EV lines to identify overarching trends and potential reversals.
Scenario Planning:
Analyze simulation lines to explore potential outcomes under varying market conditions.
Statistical Insights:
Leverage confidence bands to understand the statistical likelihood of price movements.
How to Use
Add the Indicator:
Copy the script into the TradingView Pine Editor, save it, and apply it to your chart.
Customize Settings:
Adjust the lookback periods for drift and volatility.
Define the number of projection candles and simulations.
Set the confidence percentage to tailor the bands to your strategy.
Interpret the Visualization:
Use the EV and confidence bands to guide trade entry, exit, and position sizing decisions.
Combine with other indicators for a holistic trading strategy.
Disclaimer
This indicator is a mathematical and statistical tool. It does not guarantee future performance.
Use it in conjunction with other forms of analysis and always trade responsibly.
Happy Trading! 🚀
