20 EMA Daily Moving Average to Intraday ChartCredits to freedom_trader_
20 EMA to intra day chart, enjoy!
Komut dosyalarını "20日线角度大于0的股票" için ara
20-Day SMA BIAS%20-day Bias is a commonly used indicator in technical analysis. It is used to measure the gap between the stock price and its 20-day moving average to determine whether the stock price deviates from the normal state and whether there is an overbought or oversold phenomenon.
How to calculate the 20-day deviation value:
The calculation formula of the deviation rate is: ((closing price of the day - 20-day moving average price) / 20-day moving average price) * 100%.
Interpretation of 20-day deviation value:
Positive deviation rate:
Indicates that the stock price is higher than the 20-day moving average, which means that the stock price is high and may face correction pressure.
Negative deviation rate:
Indicates that the stock price is lower than the 20-day moving average, which means that the stock price is low and there may be a rebound opportunity.
Absolute value of the deviation rate:
The larger the absolute value, the higher the deviation of the stock price, and the higher the degree of overbought or oversold.
Apply the deviation rate to determine the buying and selling opportunities:
Positive deviation rate is too large:
When the positive deviation rate of the stock price from the 20-day moving average is too large, and the stock price is already at a high level, this may be a sell signal.
Negative deviation rate is too large:
When the negative deviation rate of the stock price from the 20-day moving average is too large, and the stock price is already at a low level, this may be a buy signal.
Stock price fluctuates around the moving average:
Stock price usually fluctuates around the moving average and adjusts after over-rising or over-falling.
Practical operation suggestions:
The standards of the market and individual stocks are different:
When the positive and negative deviation rate of the market and the quarterly line is greater than 5%, there is a greater chance of correction; large-cap stocks are between 5% and 10%; small and medium-sized stocks may be above 15% to 20%.
Combined with other indicators:
The deviation rate is only one of the technical analysis indicators. It is recommended to combine it with other indicators, such as KD indicators, RSI, etc., to make a comprehensive judgment and improve accuracy.
Reference to historical experience:
You can refer to the situation where the deviation rate of the stock was too large in the past to determine whether the current deviation rate is also too large.
Summary:
The 20-day deviation value is an indicator to determine whether the stock price is overbought or oversold, which can help investors determine the timing of buying and selling, but it needs to be combined with other indicators and historical data, and adjusted according to market conditions.

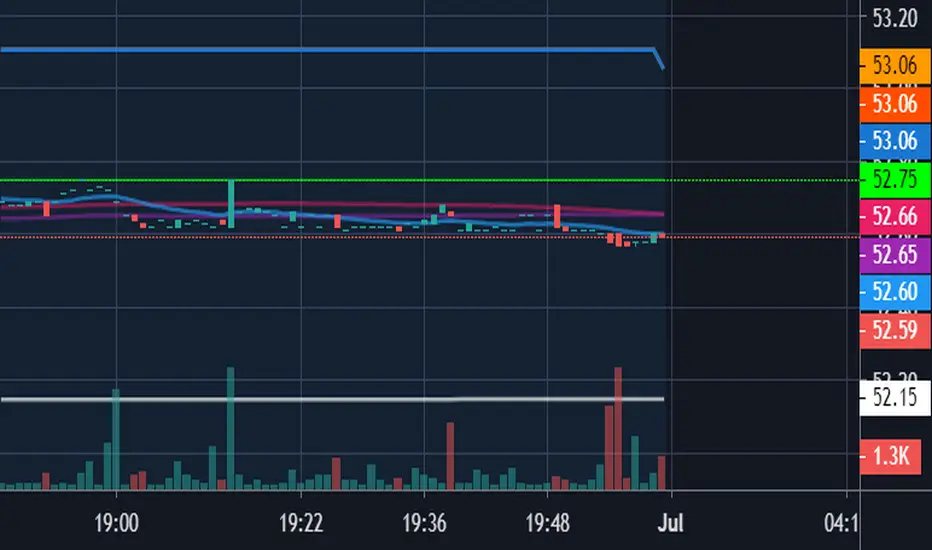
20 Pips Candle Finder for XAUUSD20 Pips Candle Finder for XAUUSD
This custom Pine Script indicator is specifically designed for XAUUSD (Gold) price action analysis. It identifies and visually marks candles with a body size of 20 pips or more, which can be important for traders focusing on strong momentum or significant price movement.
Key Features:
Dynamic Detection:
The script dynamically identifies candles whose body size exceeds 20 pips.
Calculations are based on XAUUSD's pip size of 0.1.
Visual Markers:
Candles meeting the 20-pip threshold are labeled with a green marker above the candle for quick identification.
Background Highlighting:
The candles meeting the condition are also visually highlighted with a transparent green background, making them easier to spot on the chart.
Debugging Tools:
The indicator plots:
A blue line showing the size of the candle bodies over time for better visibility.
A red dotted horizontal line showing the 20-pip threshold for quick reference.
Ideal Use Case:
This indicator is particularly useful for:
Traders focusing on momentum-based strategies.
Spotting candles with significant price movement.
Assessing market volatility during key trading hours or events.
By visually spotting these candles, traders can identify entry and exit opportunities, support/resistance breakouts, or potential reversals.
Inputs & Customization:
Currently, the indicator is set for XAUUSD's standard pip value (0.1) but can be adjusted if you plan to use it on other symbols. You can fine-tune the 20 pips threshold or other parameters to align with your trading strategy.

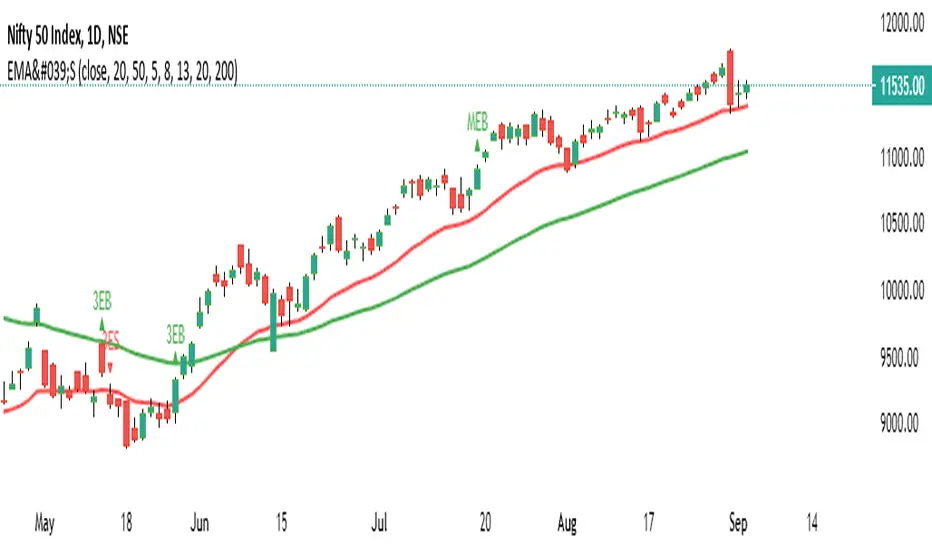
5-8-13 & 20-200 EMA Cross Over1) Popular EMA cross over combined as on indicator daily time frame
2) 5-8-13 for Swing 3EB- Bullish 3ES - Bearish
3) 20-200 EMA Cross over called as multi-bagger cross over with an inverted triangle in a smaller period of time
MEB - Bullish 20 ema crossed 200 ema, MES - Bearish vice versa
4) Simultaneously 20 50 are plotted in the graph as user input can be changed to according to user specific
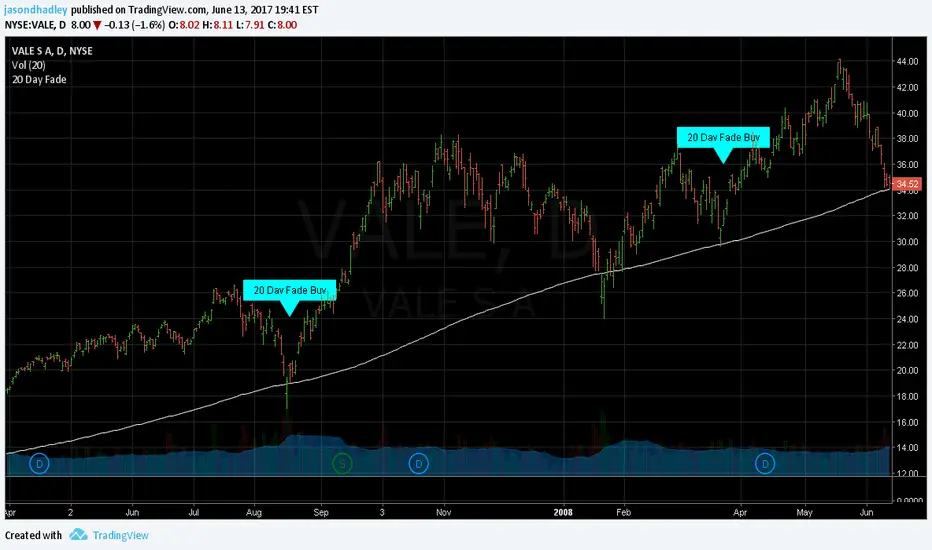
20 Day Fade20 Day Fade from MarketGeeks, I like the idea!.
This indicator only looks at daily bars, regardless of what timeframe you are using.
We look for a new 20 day low that closes within the 25th percentile of it's daily range.
We also want our security to be in an uptrend.
Finally we are looking for the next day closing price (or current price) to be atleast 2% above the previous days (20 day low) high.
Once all these conditions are satisfied it produces the text bubble letting you know that it is prime to buy.
The next version I will update with short options as well.
One day I may convert this into a strategy, but probably not. If you want to, please feel free to. All I ask is that you give credit for the base code, as I have done for the idea behind this indicator.
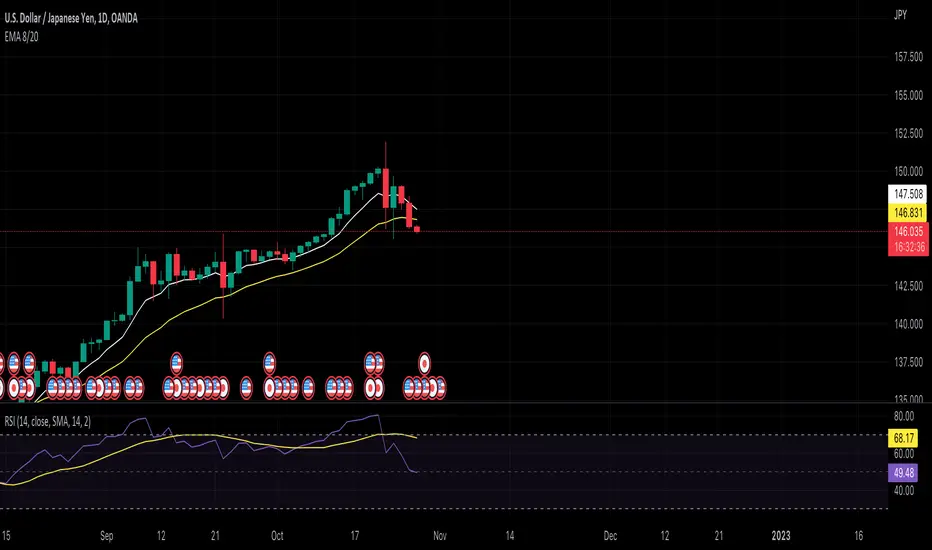
EMA 8/20Overlay the 8- and 20-period exponential moving averages.
Also known as an exponentially weighted moving average, the EMA gives more significance to recent periods compared to an SMA (simple moving average).
Learn more about the EMA on Investopedia
Triple EMA (20, 50, 200) w/ LabelsI've combined the 20, 50, and 200 day exponential moving averages and added labels.
I created this due to finding EMA scripts that are either nothing but ugly to look at or have extra "features" that serve no purpose.
This gets rid of the clutter and gives a simple triple EMA with labels.
Labels are optional, you can turn them off in the settings.

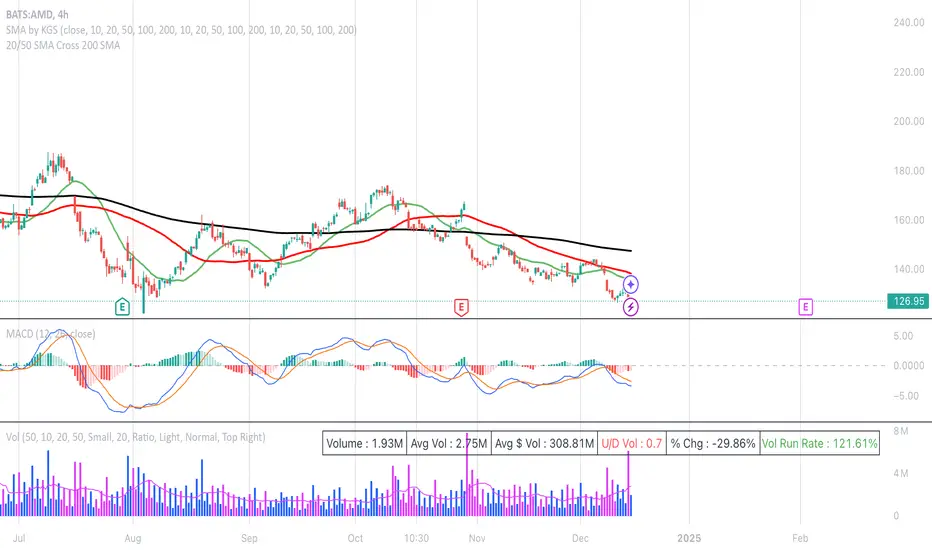
20/50 SMA Cross 200 SMAThis Pine Script code is designed to identify and visualize crossovers of two shorter-term Simple Moving Averages (SMAs), a 20-period SMA and a 50-period SMA, with a longer-term 200-period SMA on a price chart. It also includes alerts for these crossover events. Here's a breakdown:
**Purpose:**
The core idea behind this script is to detect potential trend changes. Crossovers of shorter-term moving averages over a longer-term moving average are often interpreted as bullish signals, while crossovers below are considered bearish.
**Key Components:**
1. **Moving Average Calculation:**
* `sma20 = ta.sma(close, 20)`: Calculates the 20-period SMA of the closing price.
* `sma50 = ta.sma(close, 50)`: Calculates the 50-period SMA of the closing price.
* `sma200 = ta.sma(close, 200)`: Calculates the 200-period SMA of the closing price.
2. **Crossover Detection:**
* `crossUp20 = ta.crossover(sma20, sma200)`: Returns `true` when the 20-period SMA crosses above the 200-period SMA.
* `crossDown20 = ta.crossunder(sma20, sma200)`: Returns `true` when the 20-period SMA crosses below the 200-period SMA.
* Similar logic applies for `crossUp50` and `crossDown50` with the 50-period SMA.
3. **Recent Crossover Tracking (Crucial Improvement):**
* `lookback = 7`: Defines a lookback period of 7 bars.
* `var bool hasCrossedUp20 = false`, etc.: Declares `var` (persistent) boolean variables to track if a crossover has occurred *within* the last 7 bars. This is the most important correction from previous versions.
* The logic using `ta.barssince()` is the key:
* If a crossover happens (`crossUp20` is true), the corresponding `hasCrossedUp20` is set to `true`.
* If no crossover happens on the current bar, it checks if a crossover happened within the last 7 bars using `ta.barssince(crossUp20) <= lookback`. If so, it keeps `hasCrossedUp20` as `true`. After 7 bars, it becomes `false`.
4. **Plotting Crossovers:**
* `plotshape(...)`: Plots circles on the chart to visually mark the crossovers.
* Green circles below the bars for bullish crossovers (20 and 50).
* Red circles above the bars for bearish crossovers (20 and 50).
* Different shades of green/red (green/lime, red/maroon) distinguish between 20 and 50 SMA crossovers.
5. **Plotting Moving Averages (Optional but Helpful):**
* `plot(sma20, color=color.blue, linewidth=1)`: Plots the 20-period SMA in blue.
* Similar logic for the 50-period SMA (orange) and 200-period SMA (gray).
6. **Alerts:**
* `alertcondition(...)`: Triggers alerts when crossovers occur. This is essential for real-time trading signals.
**How it Works (in Simple Terms):**
The script continuously calculates the 20, 50, and 200 SMAs. It then monitors for instances where the 20 or 50 SMA crosses the 200 SMA. When such a crossover happens, a colored circle is plotted on the chart, and an alert is triggered. The key improvement is that it remembers if a crossover occurred in the last 7 bars and continues to display the circle during that period.
**Use Case:**
Traders use this type of indicator to identify potential entry and exit points in the market. A bullish crossover (shorter SMA crossing above the longer SMA) might be a signal to buy, while a bearish crossover might be a signal to sell.
**Key Improvements over Previous Versions:**
* **Correct Lookback Implementation:** The use of `ta.barssince()` and `var` variables is the correct and efficient way to check for crossovers within a lookback period. This fixes the major flaw in earlier versions.
* **Clear Visualizations:** The use of `plotshape` with distinct colors makes it easy to distinguish between 20 and 50 SMA crossovers.
* **Alerts:** The inclusion of alerts makes the script much more practical for real-time trading.
This improved version provides a robust and useful tool for identifying and tracking SMA crossovers.
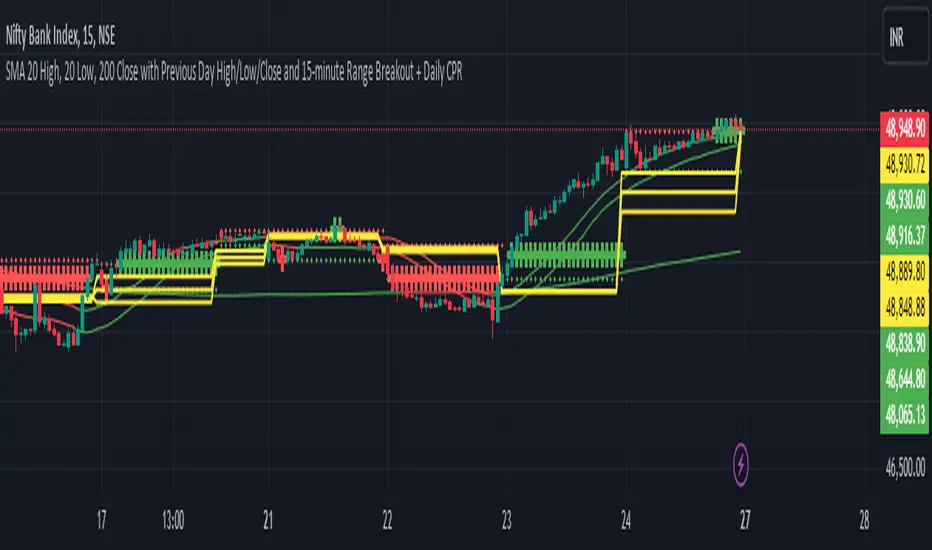
20,200SMA,PDHL,15 minute ORBSimple Moving Averages (SMAs):
The script calculates three SMAs: SMA 20 High, SMA 20 Low, and SMA 200 Close. These moving averages are widely used in technical analysis to smooth out price data and identify trends.
The SMA for the high price (SMA 20 High) is calculated based on the 20-period moving average of the high prices.
Similarly, the SMA for the low price (SMA 20 Low) is calculated based on the 20-period moving average of the low prices.
The SMA for the close price (SMA 200 Close) is calculated based on the 200-period moving average of the closing prices.
Each SMA is plotted on the chart, and their colors are determined based on whether the current close price is above or below each respective SMA.
Conditional Coloring:
The script employs conditional coloring to visually highlight whether the close price is above or below each SMA.
If the close price is below the SMA 20 High, it's plotted in red; otherwise, it's plotted in green.
Similarly, the SMA 20 Low and SMA 200 Close are plotted with conditional colors based on the relationship between the close price and each respective SMA.
Previous Day's Data:
The script retrieves and plots the high, low, and close prices of the previous trading day.
This provides traders with valuable information about the previous day's market behavior, which can influence trading decisions.
Opening 15-minute Range Breakout:
The script calculates the high and low prices during the first 15 minutes of each trading day.
These prices represent the opening range for the day.
It then determines whether the current close price is above or below this opening range and plots it accordingly.
This breakout strategy helps traders identify potential trading opportunities based on early price movements.
By integrating these components, the script offers traders a comprehensive analysis of market trends, previous day's performance, and potential breakout opportunities. Its originality lies in the combination of these features into a single, easy-to-use indicator, providing valuable insights for trading decisions.
9:20 5 Min Candle Levels with AlertsThe 9:20 AM 5-Minute Candle refers to the candlestick that represents the price action of a financial asset between 9:20 AM and 9:25 AM on a trading day. This candle is observed on a 5-minute chart and captures all the market activity during this specific time window.
Description:
Timeframe: 9:20 AM to 9:25 AM (5-minute interval).
Opening Price: The price at 9:20 AM when the 5-minute period begins.
Closing Price: The price at 9:25 AM when the 5-minute period ends.
High: The highest price achieved during these five minutes.
Low: The lowest price reached during these five minutes.
Body: The distance between the opening and closing prices. A longer body indicates stronger buying or selling pressure, while a shorter body reflects more market indecision.
Wick (Shadow): The lines extending above and below the body, representing the range between the high and low prices during this period. Long wicks suggest higher volatility, while shorter wicks indicate more stable price movements.
Significance:
Bullish Candle: If the closing price is higher than the opening price, it suggests positive momentum and buying interest within this 5-minute period.
Bearish Candle: If the closing price is lower than the opening price, it signals negative momentum and selling pressure.
Market Sentiment: The 9:20 AM 5-minute candle can provide insight into the early sentiment of the market, often influencing the trading strategy for the rest of the day.
Volatility Indicator: The length of the wicks can help traders assess the volatility and potential risk during these five minutes.
This candle is particularly important for day traders and scalpers who rely on short-term price movements to make trading decisions.

20-day High BreakoutOverview:
The 20-day High Breakout Indicator is a very simple yet powerful tool designed for traders seeking to capitalize on significant price movements in the stock market. This indicator identifies potential buy and sell signals based on a stock's 20-day high breakout levels, making it an essential addition to your trading strategy.
Key Features:
Swing Period Input: Customize the swing period to your preferred number of days, with a default of 20 days, allowing flexibility based on your trading style.
Trailing Stop Level: Automatically calculates the trailing stop level based on the highest high and lowest low within the defined swing period, helping to manage risk and lock in profits.
Buy and Sell Signals: Generates clear buy signals when the price crosses above the trailing stop level and sell signals when the price crosses below, enabling timely entries and exits.
Visual Indicators: Plots buy signals as green upward triangles below the bars and sell signals as red downward triangles above the bars, providing easy-to-interpret visual cues directly on the chart.
How It Works:
Resistance and Support Levels: The indicator calculates the highest high (resistance) and lowest low (support) over the defined swing period.
Swing Direction: It determines the market direction by comparing the current closing price to the previous resistance and support levels.
Trailing Stop Calculation: Depending on the market direction, the trailing stop level is set to either the support or resistance level.
Signal Generation: Buy and sell signals are generated based on the crossover of the closing price and the trailing stop level, filtered to ensure only valid signals are displayed.
Visual Representation: The trailing stop level is plotted as a line, and buy/sell signals are marked with respective shapes for easy identification.
Usage:
Trend Following: Ideal for traders looking to follow trends and catch significant breakouts in the stock price.
Risk Management: Helps in managing risk by providing a trailing stop level that adjusts with market movements.
Visual Clarity: The clear visual signals make it easy for traders to interpret and act upon the indicator's signals.
Add the 20-day High Breakout Indicator to your TradingView charts to enhance your trading strategy and gain an edge in identifying profitable trading opportunities.

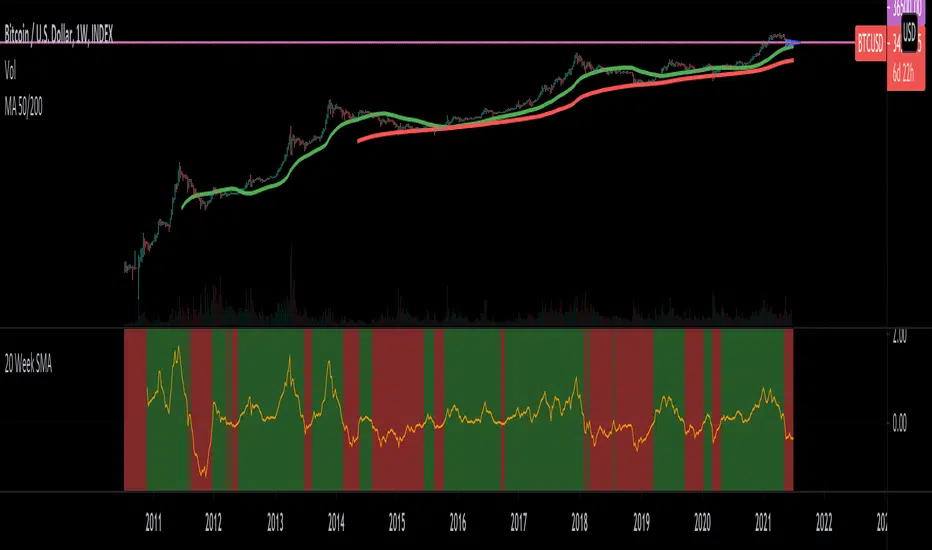
20 Week SMA Risk RatingUse this indicator in the Weekly graph.
Green background indicates we are above the 20-day SMA; red background indicates we are under the 20-day SMA.
The lower we are the 20-day SMA indicates the bottom is near. The higher we are the 20-day SMA indicates there's the possibility to start climbing down.
20 EMA Daytrading Strategy20 EMA Daytrading Strategy
This strategy creates long and short signals based on a 20 EMA crossing condition. Works well in 4H timeframes or higher. Accuracy is around 60%.
BUY
When a green candle crosses above 20 EMA
Followed by another green candle which closes above the previous candle high
SELL
When a red candle crosses below 20 EMA
Followed by another red candle which closes below the previous candle low
Stop loss at ATR + 5
Take Profit at 1.3R

20-Candle ATR in Pips (5m only)This custom indicator displays the Average True Range (ATR) over the last 20 candles on a 5-minute chart, specifically designed for pairs where 1 pip = 0.01.
Key features:
📐 Calculates a simple moving average of the true range over the last 20 five-minute candles.
📋 Outputs the ATR value in a clean table with a green background and white text.
⚠️ Designed exclusively for the 5-minute timeframe – prompts you to switch if you’re on a different one.
📏 Values are shown in pips (e.g., “ATR (20 candles): 9.83 pips”).
This tool is ideal for short-term volatility tracking, scalping strategies, and identifying market conditions where price is expanding or contracting.

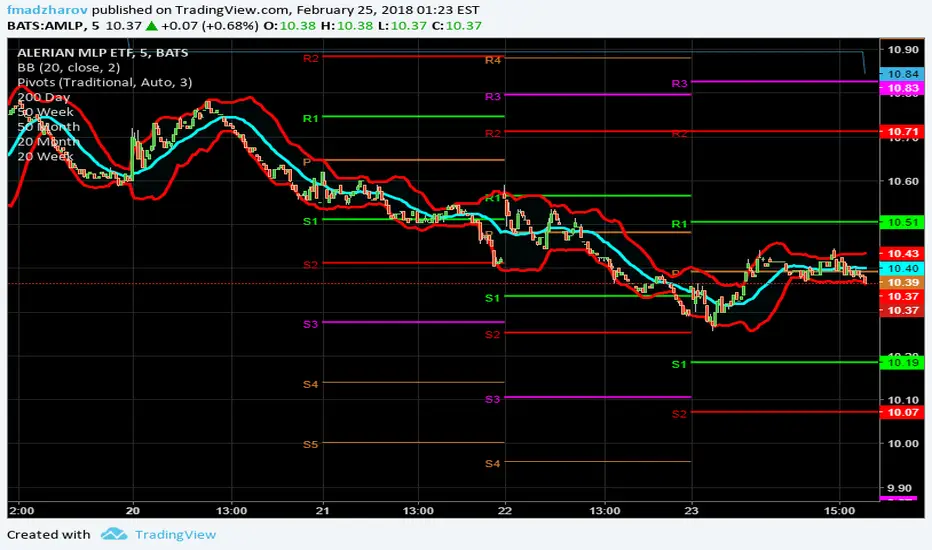
20 and 200 SMA indicators with unnecessary additionsAs many of you know, world famous Oliver Velez uses the simple 20 and 200 simple moving averages on 2 min time frame with price actions above or below these key SMAs for day/scalp trading involving narrow state versus wide state trend or anti-trend methods. The 20 SMA line uses different colors to indicate whether it is going up or down.
Against Oliver's advice, I also unnecessarily added boll bands on the 200 SMA, two +/- percent lines off 200 SMA to measure how far away prices are from the 200 SMA. I also added 10 ema cross 20 SMA cross signal, MACD line up /down, RSI crossover RSI SMA for those are want to make things complicated or might find they helpful. You can turn off all these ideally to Keep It Simple.
Again trading success is 80% psychology and 20% a good trading system plus risk management. Good luck.

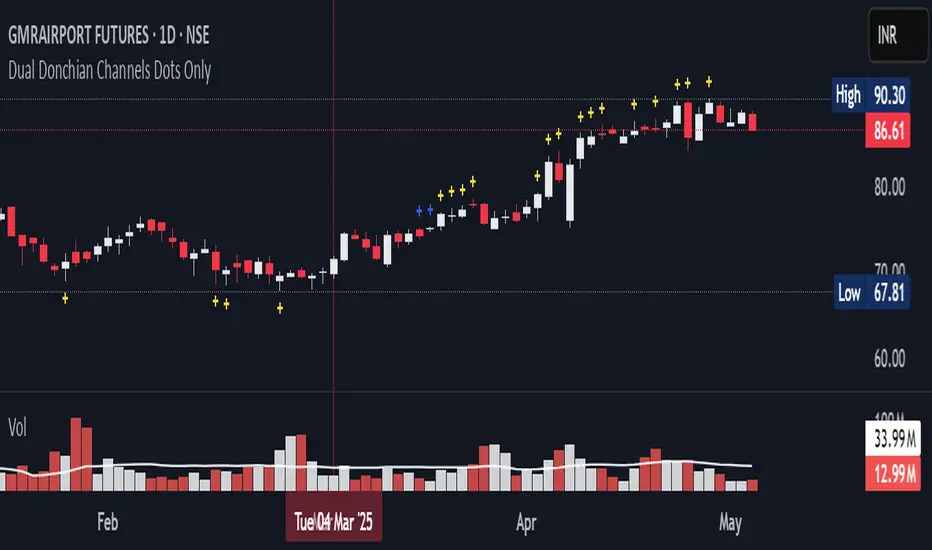
20-34 Dual Dot Alerts OnlyPine Script that uses dual Donchian Channels (20-period and 34-period) and places tiny blue dots above candles when the highest price touches any upper Donchian Channel and below candles when the lowest price touches any lower Donchian Channel, without displaying the channels themselves, you can use the code.
### Explanation of the Code:
1. **Indicator Declaration**: The script is named "Dual Donchian Channels Dots Only" and overlays on the price chart.
2. **Input for Lengths**: Users can set lengths for two Donchian Channels (20 and 34 periods).
3. **Calculating Bands**: The upper and lower bands are calculated using `ta.highest` and `ta.lowest` functions over the specified periods.
4. **Touch Conditions**:
- `upperTouch`: Checks if the highest price of the current candle touches either of the upper bands.
- `lowerTouch`: Checks if the lowest price of the current candle touches either of the lower bands.
5. **Plotting Dots**:
- A tiny blue dot is plotted above bars where `upperTouch` is true.
- A tiny blue dot is plotted below bars where `lowerTouch` is true.
### How to Use:
1. Copy this script into TradingView’s Pine Script editor.
2. Save it and add it to your chart.
3. You will see tiny blue dots appear above or below candles based on whether they touch any of the upper or lower Donchian Bands.
This setup provides a clear visual indication of price interactions with both Donchian Channels while keeping the chart uncluttered by hiding the channel lines.
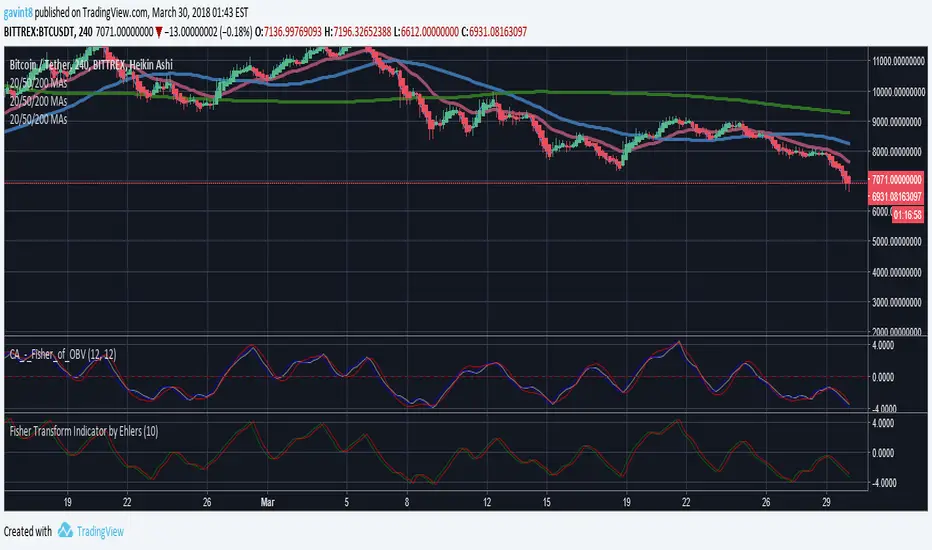
20/200MAs+LTF+4HTF and HighLowBox+3HTF20/200MAs
Shows 20 and 200 MAs in each TFs(tfChart,1 Lower and 4 Higher).
TFs:
current TF
Lower TF (default: lower1)
Higher TF1 (default: higher1)
Higher TF2 (default: higher1)
Higher TF3 (default: higher1)
Higher TF4 (default: higher1)
MAs:
20MA (default: sma)
1st 200MA (default: sma)
2nd 200MA (default: ema)
VWAP (optional)
HighLowBox+3HTF
Enclose in a square high and low range in each timeframe.
Shows price range and duration of each box.
In current timeframe, shows Fibonacci Scale inside(23.6%, 38.2%, 50.0%, 61.8%, 76.4%)/outside of each box.
Outside(161.8%,261.8,361.8%) would be shown as next target, if break top/bottom of each box.
1st box for current timeframe.
2nd box for higher timeframe.(default: higher1)
3rd box for higher timeframe.(default: higher2)
4th box for higher timeframe.(default: higher3)
static timeframes can also be used.

20 SMA based Bull/Bear sentiment indicatorThis script is only doing one thing, plots the 20 SMA and based on whether the asset's price is above or below of the SMA it changes the color of the SMA and the background's color.
Helping it to visualize whether from the 20 SMA's point of view we are in a Bull or a Bear trend.
I created this because I myself use this SMA with Bitcoin on the weekly time frame to identify the macro trend on the weekly.
IMO this is a good crypto market sentiment indicator.

20/40/60Displays three consecutive, connected range boxes showing high/low price ranges for customizable periods. Boxes are positioned seamlessly with shared boundaries for continuous price action visualization.
Features
Three Connected Boxes: Red (most recent), Orange (middle), Green (earliest) periods
Customizable Positioning: Set range length and starting offset from current bar
Individual Styling: Custom colors, transparency, and border width for each box
Display Controls: Toggle borders, fills, and line visibility
Use Cases
Range Analysis: Compare volatility across time periods, spot breakouts
Support/Resistance: Use box boundaries as potential S/R levels
Market Structure: Visualize recent price development and trend patterns
Key Settings
Range Length: Bars per box (default: 20)
Starting Offset: Bars back from current to position boxes (default: 0)
Style Options: Colors, borders, and visibility controls for each box
Perfect for traders analyzing consecutive price ranges and comparing current conditions to recent historical periods.

20 EMA / 55 EMA Cross with 50 SMMA FilterBulish Bearish indicator for the 55 ema flipping abover or below 20 ema and abover or below 50 smma