Relative Strength Scoring SystemRelative Strength Scoring System :
Important prerequisite :
This indicator can be loaded on any forex chart, i.e. a currency pair, but must not be loaded on any other asset due to certain market closures.
The chart timeframe must be less than or equal to the trading timeframe, which is the indicator's first parameter. A timeframe equal to that of the "Trading Timeframe" parameter is preferable.
Introduction :
This indicator measures the relative strength of a currency against all other currencies using spread formulas. It gives an indication of which currencies are bullish, neutral or bearish. The ultimate aim of this indicator is to find out which pair will generate a higher probability of gain than the others by pairing the most bullish pair with the most bearish pair.
Spread formulas :
To find the relative strength of a currency compared with others, we use the following spreads formulas :
USD = (FX:USDJPY/100+SAXO:USDEUR+FX:USDCHF+SAXO:USDGBP+FX:USDCAD+SAXO:USDAUD+FX_IDC:USDNZD)/7
JPY = (SAXO:JPYUSD/100+FX_IDC:JPYAUD/100+FX_IDC:JPYCAD/100+FX_IDC:JPYNZD/100+FX_IDC:JPYCHF/100+SAXO:JPYEUR/100+FX_IDC:JPYGBP/100)/7
CHF = (FX:CHFJPY/100+SAXO:CHFUSD+SAXO:CHFEUR+FX_IDC:CHFGBP+FX_IDC:CHFCAD+SAXO:CHFAUD+FX_IDC:CHFNZD)/7
EUR = (FX:EURJPY/100+FX:EURUSD+FX:EURCHF+FX:EURGBP+FX:EURCAD+FX:EURAUD+FX:EURNZD)/7
GBP = (FX:GBPJPY/100+FX:GBPUSD+FX:GBPCHF+SAXO:GBPEUR+FX:GBPCAD+FX:GBPAUD+FX:GBPNZD)/7
CAD = (FX:CADJPY/100+SAXO:CADUSD+FX:CADCHF+FX_IDC:CADGBP+SAXO:CADEUR+FX_IDC:CADAUD+FX_IDC:CADNZD)/7
AUD = (FX:AUDJPY/100+FX:AUDUSD+FX:AUDCHF+SAXO:AUDGBP+FX:AUDCAD+SAXO:AUDEUR+FX:AUDNZD)/7
NZD = (FX:NZDJPY/100+FX:NZDUSD+FX:NZDCHF+SAXO:NZDGBP+FX:NZDCAD+SAXO:NZDAUD+SAXO:NZDEUR)/7
CRYPTO = (BITSTAMP:BTCUSD+BITSTAMP:ETHUSD+BITSTAMP:LTCUSD+BITSTAMP:BCHUSD)/4
Timeframes :
As mentioned in the prerequisites, the chart timeframe must not be greater than the trading timeframe. The latter corresponds to the timeframe chosen by the trader to enter a position, and is the indicator's first parameter. Once this has been chosen, the algorithm selects the timeframes of the "Trend" and "Velocity" charts. Here's how it allocates them :
Trading TF => ("Velocity TF", "Trend TF")
"5min" => ("15min ", "60min")
"15min" => ("60min ", "4h")
"30min" => ("2h ", "8h")
"60min" => ("4h ", "12h")
"4h" => ("12h", "1D")
"6h" => ("1D", "3D")
"8h" => ("1D", "4D")
"12h" => ("2D", "1W")
"1D" => ("3D", "1W")
Trend Scoring System :
When the timeframe of the trend graph has been allocated, the algorithm will establish this graph's score using three criteria :
Trend chart pivot points: if the last two pivots, high and low, are increasing, the score is 1; if they are decreasing, the score is -1; else the score is 0.
SMA: if its slope is increasing with a candle strictly above the SMA value, the score is 1; if its slope is decreasing with a candle strictly below it, the score is -1; otherwise, it is 0.
MACD: if the MACD is positive, the score is 1, if it is negative, the score is -1; else it's 0.
We then sum the scores of these three criteria to find the trend score.
Velocity Scoring System :
In the same way, we analyze the score of the "velocity" graph with its corresponding timeframe using three criteria :
The EMA: if its slope is increasing with a candle strictly above the EMA value, the score is 1; if its slope is decreasing with a candle strictly below it, the score is -1; otherwise, it is 0.
The RSI: if the RSI's EMA has an increasing slope with an RSI strictly greater than the value of this EMA, the score is 1; and if the RSI's EMA has a decreasing slope with an RSI strictly less than this EMA, the score is -1; otherwise it is 0.
SAR parabolic: if the SAR is below the price, the score is 1; if it is above the price, the score is -1.
We then sum the scores of these three criteria to find the velocity score.
Relative Strength Scoring System :
Once the trend score and velocity score have been calculated, we determine the relative strength score of each currency using the following algorithm :
If trend score >=2 and velocity score >=2, the currency is bullish.
If trend score <=2 and velocity score <=2, currency is bearish
If (trendScore>=2 or velocityScore>=2) and (trendScore=1 or velocityScore=1) the currency is not yet bullish
If (trendScore<=2 or velocityScore<=2) and (trendScore=-1 or velocityScore=-1) the currency is not yet bearish.
Otherwise the currency is neutral
Parameters :
Trading Timeframe: the trading timeframe chosen by the trader for which he makes his position entry and exit decisions. Default is 1h
Pivot Legs: Parameter used for the chart "Trend" setting the pivot strength to the right and left of high/low. Default is 2
SMA Length: SMA length of the chart "Trend". Default is 20
MACD Fast Length: Length of the MACD fast SMA calculated on the chart "Trend". Default is 12
MACD Slow Length: Length of the MACD slow SMA calculated on the chart "Trend". Default is 26
MACD Signal Length: Length of the MACD signal SMA calculated on the chart "Trend". Default is 9
EMA Length: EMA length of the "Velocity" graph. Default is 13
RSI Length: RSI length of the "Velocity" graph. Default is 14
RSI EMA Length: Length of the RSI EMA. Default is 9
Parabolic SAR Start: Start of the SAR parabola in the "Velocity" graph. Default is 0.02
Parabolic SAR Increment: Increment of the SAR parabola in the "Velocity" graph. Default is 0.02
Parabolic SAR Max: Maximum of the SAR parabola in the "Velocity" graph. Default is 0.2
Conclusion :
This indicator has been designed to determine the relative strength of the major currencies against each other. The aim is to know which pair to trade at the right time in order to maximize the probability of a successful trade. For example, if the USD is bullish and the NZD bearish, we'll short the NZDUSD pair.
Enjoy this indicator and don't forget to take the trade ;)
"12月4号是什么星座" için komut dosyalarını ara

[The_lurker] RSI-MFI-WPR Indicatoris an advanced trading indicator developed for the TradingView platform, which synergistically refers to the insights of three popular technical analysis tools: the Relative Strength Index (RSI), the Money Flow Index (MFI) and the Williams Indicator. Percentage range (WPR). This indicator is precisely designed to help traders identify potential buy and sell opportunities by accurately interpreting market momentum, volume, and price position relative to recent highs and lows.
The primary goal of the RSI-MFI-WPR Indicator is to provide a comprehensive tool that leverages the combined power of RSI, MFI and WPR to detect overbought and oversold conditions, indicating potential market reversal points. This multi-faceted approach aims to provide traders with a more robust framework for making informed decisions, and enhance their trading strategy through multi-indicator analysis.
Explanation of the indicator conditions
The essence of this indicator lies in its strategic conditions that indicate possible entry and exit points:
Oversold Condition (Condition): This is determined when the RSI and MFI are below 30, and the WPR drops below -91, indicating a strong oversold condition in the market. Such a scenario usually indicates a buying opportunity, assuming that the market may rebound from this oversold state.
Divergence Condition (Condition 1): Checks if the MFI exceeds 2.1 times the RSI. This unique case aims to highlight instances where there is a significant inflow of funds into an asset, which is not proportionately reflected in its RSI, which may indicate an upcoming price increase or highlight an unusual market situation for further From the analysis.
Overbought Warning (conditionExit): An exit signal is triggered when both the MFI and RSI exceed 85, and the WPR is above -15. This combination indicates an overbought condition in the market, indicating that the asset may be overvalued and that a price correction or reversal may be imminent, thus indicating a potential selling opportunity or a warning of initiating new positions.
Application and visualization
The RSI-MFI-WPR Indicator not only provides numerical insights but also displays these conditions on a TradingView chart. Through the use of color coding and plotting, it provides traders with an intuitive way to distinguish market conditions, enabling quick and effective decision-making. Incorporating alert conditions ensures that traders are immediately notified of important market events, in line with their strategic trading objectives.
Planning and alerts in “RSI-MFI-WPR Indicator”
Collected alert status
CombinedAlertCondition is a logical statement that combines all individual conditions (Condition, Condition1, Condition Exit, and The_lurkerMFI_oversold) into a single alert trigger. This condition becomes true and triggers an alert if any of the conditions specified for potential trading opportunities or warnings are met. It is designed to provide a comprehensive alert system that informs the trader of any important signal identified by the indicator, including entry and exit signals as well as oversold conditions.
Visual indicators
Background color for oversold condition: The script sets the background color to a specific shade of blue ( with 90% transparency) when the custom MFI indicates an oversold condition (The_lurkerMFI_oversold). This visual signal helps traders quickly recognize periods when the market may be undervalued and potentially poised for a rebound.
Drawing warning and exit signs:
Entry Signals: For Condition and Condition 1, which identify potential entry points, the indicator draws upward pointing triangles below the price bars. These triangles are colored in specific shades to differentiate signals from a fundamental oversold condition and a divergence condition, making it intuitive for traders to recognize the type of signal.
Exit Signals: For an exit condition, which indicates overbought conditions that may indicate an impending price correction, red downward-pointing triangles are drawn above the price bars. This serves as a clear visual warning to consider exiting positions or proceed with caution.
Configure the alarm
The script uses the conditional alert function to create an alert based on the AlertCondition combination. When this condition is met, any of the predefined signals are indicated
Conclusion
In short, the “RSI-MFI-WPR Indicator” stands out as a versatile and dynamic indicator that enriches a trader's toolkit by combining the analytical strengths of RSI, MFI and WPR. By setting clear conditions for entry and exit points from the market, it facilitates a proactive approach to trading, based on a detailed examination of market dynamics. This indicator demonstrates how mixing multiple technical tools can lead to more informed and accurate market analysis, with the aim of elevating the trading experience on Tradingview.
==================================================================================
هو مؤشر تداول متقدم تم تطويره لمنصة TradingView،
والذي يشير بشكل تآزري إلى رؤى ثلاث أدوات تحليل فني شائعة:
1- مؤشر القوة النسبية (RSI)،
2- مؤشر تدفق الأموال (MFI)،
3- مؤشر ويليامز. نطاق النسبة المئوية (WPR).
تم تصميم هذا المؤشر بدقة لمساعدة المتداولين على تحديد فرص الشراء والبيع المحتملة من خلال التفسير الدقيق لزخم السوق وحجمه وموقع السعر بالنسبة إلى الارتفاعات والانخفاضات الأخيرة.
الهدف الأساسي لمؤشر RSI-MFI-WPR هو توفير أداة شاملة تستفيد من القوة المشتركة لمؤشر RSI وMFI وWPR للكشف عن ظروف ذروة الشراء والمبالغة في البيع، مما يشير إلى نقاط انعكاس السوق المحتملة. ويهدف هذا النهج متعدد الأوجه إلى تزويد المتداولين بإطار أكثر قوة لاتخاذ قرارات مستنيرة، وتعزيز استراتيجية التداول الخاصة بهم من خلال تحليل متعدد المؤشرات.
شرح شروط المؤشر
يكمن جوهر هذا المؤشر في ظروفه الإستراتيجية التي تشير إلى نقاط الدخول والخروج المحتملة:
حالة ذروة البيع (الحالة): يتم تحديد ذلك عندما يكون مؤشر القوة النسبية RSI وMFI أقل من 30، وينخفض WPR إلى أقل من -92، مما يشير إلى حالة ذروة بيع قوية في السوق. يشير مثل هذا السيناريو عادةً إلى فرصة شراء، على افتراض أن السوق قد ينتعش من حالة ذروة البيع هذه.
شرط الاختلاف (الشرط 1): يتحقق مما إذا كانت السيولة تتجاوز 2.1 مرة مؤشر القوة النسبية. تهدف هذه الحالة الفريدة إلى تسليط الضوء على الحالات التي يوجد فيها تدفق كبير للأموال إلى أحد الأصول، وهو ما لا ينعكس بشكل متناسب في مؤشر القوة النسبية الخاص به، مما قد يشير إلى زيادة قادمة في الأسعار أو يسلط الضوء على وضع غير عادي في السوق لمزيد من التحليل.
تحذير ذروة الشراء (conditionExit): يتم إطلاق إشارة خروج عندما يتجاوز مؤشر MFI ومؤشر القوة النسبية 85، ويكون WPR أعلى من -15. يشير هذا المزيج إلى حالة ذروة الشراء في السوق، مما يشير إلى أن الأصل قد يكون مبالغًا في قيمته وأن تصحيح السعر أو انعكاسه قد يكون وشيكًا، مما يشير إلى فرصة بيع محتملة أو تحذير ببدء مراكز جديدة.
التطبيق والتصور
لا يوفر مؤشر RSI-MFI-WPR رؤى رقمية فحسب، بل يعرض أيضًا هذه الشروط على مخطط TradingView. من خلال استخدام الترميز اللوني والتخطيط، فإنه يوفر للمتداولين طريقة بديهية للتمييز بين ظروف السوق، مما يتيح اتخاذ قرارات سريعة وفعالة. يضمن دمج شروط التنبيه إخطار المتداولين على الفور بأحداث السوق المهمة، بما يتماشى مع أهدافهم التجارية الإستراتيجية.
التخطيط والتنبيهات في مؤشر RSI-MFI-WPR
حالة التنبيه التي تم جمعها ( CombinedAlertCondition ) عبارة منطقية تجمع كل الشروط الفردية
Condition، Condition1، Condition Exit، وThe_lurkerMFI_oversold في مشغل تنبيه واحد.
ليصبح هذا الشرط صحيحًا ويطلق تنبيهًا في حالة استيفاء أي من الشروط المحددة لفرص التداول المحتملة أو التحذيرات. وهو مصمم لتوفير نظام تنبيه شامل يُعلم المتداول بأي إشارة مهمة يحددها المؤشر، بما في ذلك إشارات الدخول والخروج بالإضافة إلى ظروف ذروة البيع.
المؤشرات البصرية
لون الخلفية لحالة ذروة البيع: يقوم البرنامج النصي بتعيين لون الخلفية إلى ظل معين من اللون الأزرق (بشفافية 90٪) عندما تشير مؤسسة التمويل الأصغر المخصصة إلى حالة ذروة البيع (The_lurkerMFI_oversold). تساعد هذه الإشارة المرئية المتداولين على التعرف بسرعة على الفترات التي قد تكون فيها السوق مقومة بأقل من قيمتها الحقيقية ومن المحتمل أن تكون مستعدة للانتعاش.
رسم علامات التحذير والخروج:
إشارات الدخول: بالنسبة للحالة والحالة 1، التي تحدد نقاط الدخول المحتملة، يرسم المؤشر مثلثات تشير إلى الأعلى أسفل أشرطة السعر. يتم تلوين هذه المثلثات بظلال محددة لتمييز الإشارات عن حالة ذروة البيع الأساسية وحالة التباعد، مما يجعل من السهل على المتداولين التعرف على نوع الإشارة.
إشارات الخروج: بالنسبة لحالة الخروج، التي تشير إلى ظروف ذروة الشراء التي قد تشير إلى تصحيح وشيك للسعر، يتم رسم مثلثات حمراء تشير إلى الأسفل فوق أشرطة السعر. يعد هذا بمثابة تحذير مرئي واضح للنظر في الخروج من المواقف أو المضي قدمًا بحذر.
تكوين المنبه
يستخدم البرنامج النصي وظيفة التنبيه الشرطي لإنشاء تنبيه بناءً على مجموعة AlertCondition. عند استيفاء هذا الشرط، تتم الإشارة إلى أي من الإشارات المحددة مسبقًا
خاتمة
باختصار، يبرز "مؤشر RSI-MFI-WPR" كمؤشر متعدد الاستخدامات وديناميكي يثري مجموعة أدوات المتداول من خلال الجمع بين نقاط القوة التحليلية لـ RSI وMFI وWPR. ومن خلال وضع شروط واضحة لنقاط الدخول والخروج من السوق، فإنه يسهل اتباع نهج استباقي للتداول، بناءً على فحص تفصيلي لديناميكيات السوق. يوضح هذا المؤشر كيف أن الجمع بين أدوات فنية متعددة يمكن أن يؤدي إلى تحليل سوق أكثر استنارة ودقة، بهدف رفع مستوى تجربة التداول على Tradingview.
==================================================================================
باختصار :
1- ظهور المثلث الاصفر يعني تواجد سيولة كبيره ( مفيد جدا لعملات البومب ) .
2- ظهور المثلث الأبيض يعني وصول الى مستويات تشبع البيع وهي فرصة ممتازه للشراء ( منطقة دخول ).
3- ظهور خط افقي يعني قرب عكس الاتجاه الى أعلى ( منطقة دخول ) .
4- ظهور مثلث أحمر يعني قرب عكس الاتجاه الى أسفل ( منطقة خروج ) .
5- التنبيه يعمل على جميع ما ذكر أعلاه في تنبيه واحد حتى تسهل المراقبة .
6- أفضل فواصل الاستخدام ( 4 ساعات ، 12 ساعه ، يوم ) .

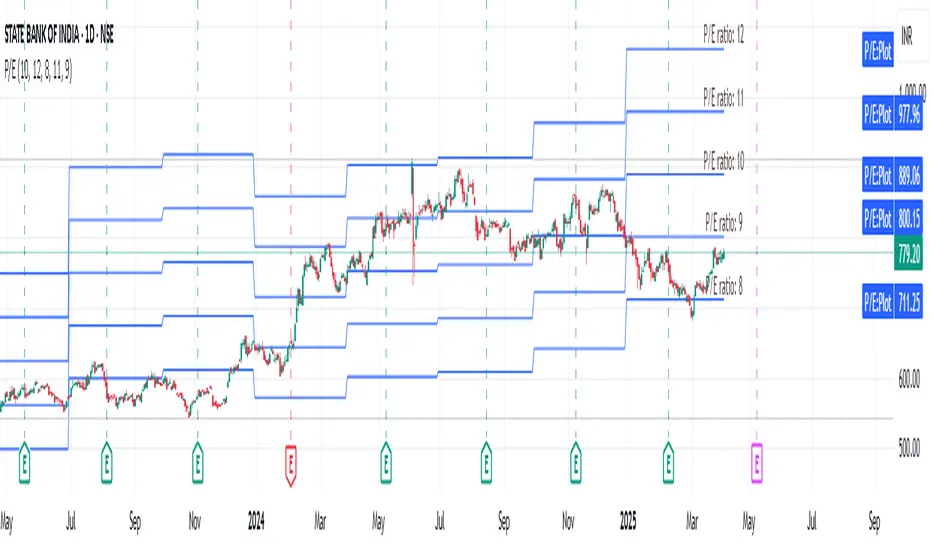
EPS GridIntroduction:
This simple indicator offers insights into the relationship between stock prices and earnings, aiding in the assessment of valuation dynamics during different periods.
Understanding Price-to-Earnings (P/E) Ratio:
The commonly used Price to Earnings (P/E) ratio, calculated as Current Price divided by Earnings Per Share (EPS) over the trailing 12 months (TTM), serves as a fundamental metric. Here, we use this formula to estimate a stock's price. For instance, multiplying EPS by 10 provides an approximation of the stock price with a P/E ratio of 10.
The Grid Concept:
Utilizing this principle, a visual grid is constructed to illustrate how stock prices correlate with earnings. This grid facilitates the identification of both potential bargains and overvalued stocks.
How to Utilize:
This indicator is pre-configured with earnings multiples of 10, 15, 20, and 25. Simply add it to your chart and observe whether earnings demonstrate consistent growth. If prices lag behind earnings, a potential catch-up phase may ensue in the future.
Happy Investing!
Embark on your investment journey armed with this indicator, and may it guide you towards informed decisions and successful ventures.
[blackcat] L1 Fibonacci MA BandThe true charm of the Fibonacci moving average band lies not only in its predictive ability. Its essence is that it combines the beauty of mathematics with the practicality of market analysis, providing traders with a powerful tool to optimize trading strategies. It's not a simple number game, but a wisdom that sees into the deeper structure of the market.
Next, we will delve into the core technical indicators of the Fibonacci moving average band - WHALES, RESOLINE, STICKLINE functions, and TRENDLINE, as well as their clever applications. The WHALES indicator, with its 12-period exponential moving average, captures short-term market trends; the RESOLINE indicator, through the 120-period EMA, reveals mid-term market movements; the STICKLINE function, distinguishes the relationship between WHALES and RESOLINE with colors, providing clear visual aids; while TRENDLINE, combining price slope with EMA, depicts more detailed market changes for traders.
The integrated application of these indicators has built a multi-dimensional market analysis framework for traders. They help traders examine the market from different angles, judge the market status more accurately, and make wiser decisions in the ever-changing market environment. The Fibonacci moving average band indicator is like a lighthouse, emitting guiding light in the ocean of trader's navigation.
1. `xsl(src, len)` function: This function calculates a value called the linear regression slope. Len defines the length of the linear regression. Then, this function normalizes the difference between the current value of the linear regression and the previous value. The formula is `(lrc - lrprev) / timeframe.multiplier`.
2. `whales`, `resoline`, and `trendline` are Exponential Moving Averages (EMA) calculated in different ways. "whales" is the 13-period closing price EMA, "resoline" is the 144-period closing price EMA, and "trendline" is a more complicated EMA. It is the 50-period EMA calculated by the 21-period closing price slope multiplied by 23 plus the closing price.
3. The `plotcandle` function draws two sets of candlestick charts. One set shows in blue when "whales" is greater than "resoline", and the other set shows in green when "whales" is less than "resoline".
4. The `plot` function draws three lines: "whales", "resoline", and "trendline". "whales" is displayed in orange with a line thickness of 2. "resoline" is displayed in yellow with a line thickness of 1. "trendline" is displayed in red with a line thickness of 3.
5. The last line draws a conditional line. When the closing price is less than the "trendline", the green "trendline" is drawn, otherwise, it is not drawn. This is a logical judgment, the drawing operation is only executed when the condition is met.

ROCE with 3-Year EMAThis Pine Script indicator, "3-Year EMA of Return on Capital Employed (ROCE)," is designed for investors and traders who incorporate both fundamental and technical analysis in their market approach. ROCE is a crucial metric for evaluating the efficiency and profitability of a company's capital employment. Our script enhances this analysis by overlaying a 3-year Exponential Moving Average (EMA) on the ROCE, allowing users to compare current performance against a longer-term trend.
Key Features:
ROCE Calculation: The script calculates the Return on Capital Employed (ROCE) using EBIT (Earnings Before Interest and Taxes) for the Trailing Twelve Months (TTM) and Capital Employed (Total Assets minus Short Term Debt) for the Fiscal Year (FY). This calculation provides a snapshot of how effectively a company is using its capital to generate profits.
3-Year EMA Overlay: The script features a 3-year EMA of the ROCE, providing a smoothed, long-term trend line. This EMA helps in identifying broader trends in a company's operational efficiency and profitability, making it easier to spot deviations from the historical norm.
Customizable for Different Data Frequencies: Whether your data is quarterly, monthly, or weekly, the script is adaptable. The length of the EMA is adjustable to suit the data frequency, ensuring accurate representation over a 3-year period.
Visualization: The ROCE and its 3-year EMA are plotted with distinct colors for easy comparison and analysis. This visual representation aids in quickly assessing the company's current performance against its historical trend.
Customization: Users can adjust the EMA length to match the frequency of their data (e.g., 12 for quarterly, 36 for monthly, 156 for weekly data).
Usage Tips:
Best used on companies with stable and consistent reporting.
Combine with other fundamental and technical indicators fo
r comprehensive analysis.
Disclaimer: This script is provided for informational and educational purposes only and should not be construed as investment advice.

Ticker Screener by Volume Heatmap [SS]Fun little screener that creates a heatmap by daily volume trend.
The numbers expressed are the Sell to Buy ratio (Selling volume / buying volume). The % is the % change over the lookback period.
The default lookback period is 25 days, but you can adjust it as you see fit. The brightness of the green and red will change based on the extent of buying / selling.
Anything 1 or over means there is a lot of selling. A percent change in the negatives is good, it means that selling is decreasing and buying is increasing. Vice versa for a percent change in the positives.
It will accomodate up to 12 tickers, there are some pre-set but you can obviously customize it with your own tickers of interest.
And that's pretty much the indicator, pretty simple indicator but I hope you enjoy!
Safe trades everyone!

Hodl Calculation v1.0I have developed an indicator that calculates the value of our currency if we had periodically bought any stock or cryptocurrency on any exchange. I believe many individuals would be interested in computing such values.
You can customize the start and end times, choose the amount of currency to be used for each deal, and select from two frequency options.
The first option involves specific intervals, such as hourly, every three days, or bi-weekly.
The second option allows purchases at specific dates or times, like every 15th of the month at 12:00 PM, every Monday at 11:00 AM, or every day at 6:00 AM.
After selecting the frequency, the indicator performs calculations and presents statistical information in a table.
The summarized data includes frequency value, total selected period duration, number of deals, total quantity, total cost, current value, and profit/loss status.

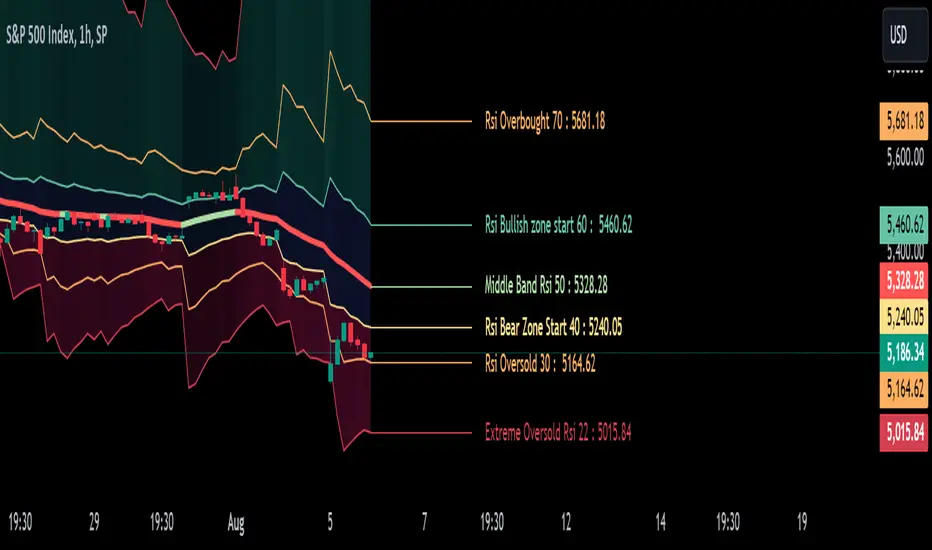
RSI Levels On Chart [MisterMoTA]The values of the RSI Levels On Chart are calculated using Reverse Engineering RSI calculations by Giorgos Siligardos, Ph.D.
Instead of using only the 50 line of the RSI on chart I added options for users to define the Extreme Overbought and Oversold values, also simple Oversold and Overbought values, start of Bullish and Bearish zones and the 50 rsi value.
With the RSI Levels On Chart users are able to see on chart the price that a candles need to close for a certain value of the RSI. E.g. what price is needed for the RSI to be at oversold 30 or what would be the price when rsi will cross the 50 line.
The script has the 50 line color coded that will turn red when the line falling and will change to the user input color when it will be rising, helping users to see fast the clear trend of any asset on any timeframe from 1 second to 12 months.
I added few alerts for rsi overbought, oversold, extreme overbought and extreme oversold, crossing 50 level, crossing bullish or bearish zones values and also alerts for the 50 line falling or rising.
You can use RSI Levels On Chart as a simple indicator or you can add your favorite oscilator(s) to have a clear view of the trends of the markets, in this demo I added RSI + Divergences + Alerts with a moving average set to 50 RMA.
forex_factory_decodingLibrary "forex_factory_decoding"
Supporting Utility Library for the Live Economic Calendar by toodegrees Indicator; responsible for formatting and saving Forex Factory News events.
isLeapYear()
Finds if it's currently a leap year or not.
Returns: Returns True if the current year is a leap year.
daysMonth(M)
Provides the days in a given month of the year, adjusted during leap years.
Parameters:
M (int) : Month in numerical integer format (i.e. Jan=1).
Returns: Days in the provided month.
MMM(M)
Converts a month from a numerical integer format to a MMM format (i.e. 'Jan').
Parameters:
M (int) : Month in numerical integer format (i.e. Jan=1).
Returns: Month in MMM format (i.e. 'Jan').
array2string(S, FWD)
Converts a string array to a simple string, concatenating its elements.
Parameters:
S (string ) : String array, or string array slice, to turn into a simple string.
FWD (bool) : Boolean defaulted to True. If True the array will be concatenated from head to tail, reversed order if False.
Returns: Returns the simple string equivalent of the provided string array.
month2number(M)
Converts a month string in 'MMM' format to its integer equivalent.
Parameters:
M (string) : Month string, in 'MMM' format.
Returns: Returns the integer equivalent of the provided Month string in 'MMM' format.
shiftFWD_Days(D)
Shifts forward the current Date by N days.
Parameters:
D (int) : Number of days to forward-shift, default is 7.
Returns: Returns the forward-shifted date in 'MMM %D' format (i.e. Jan 8, Sep 12).
ff_dow(D)
Converts a numbered day of the week string in format to 'DDD' format (i.e. "1" = Sun).
Parameters:
D (string) : Numbered day of the week from 1 to 7, starting on Sunday.
Returns: Returns the day of the week in 'DDD' format (i.e. "Fri").
ff_currency(C)
Converts a numbered currency string in format to 'CCC' format (i.e. "1" = AUD).
Parameters:
C (string) : Numbered currency, where "1" = "AUD", "2" = "CAD", "3" = "CHF", "4" = "CNY", "5" = "EUR", "6" = "GBP", "7" = "JPY", "8" = "NZD", "9" = "USD".
Returns: Returns the currency in 'CCC' format (i.e. "USD").
ff_t(T)
Converts a time of the day in 'hhmm' format into an intger.
Parameters:
T (string) : Time of the day string in 'hhmm' format.
Returns: Returns the time of the day integer in 'hhmm' format, or -1 if all day.
ff_tod(T)
Converts a time of the day from an integer 'hhmm' format into 'hh:mm' format.
Parameters:
T (int)
Returns: Returns the N Forex Factory News array with time of the day string in 'hh:mm' format, or 'All Day'.
ff_impact(I)
Converts a number from 1 to 4 to a relative color based on Forex Factory Impact types.
Parameters:
I (string) : Impact number string from 1 to 4, where "1" = Holiday, "2" = Low Impact, "3" = Medium Impact, "4" = High Impact.
Returns: Returns the color associated to the impact number based on Forex Factory Impact types.
ff_tmst(D, T)
Parameters:
D (string)
T (string)
decode(ID)
Decodes TOODEGREES_FOREX_FACTORY_SLOT_n Symbols' Pine Seeds data into Forex Factory News Events.
Parameters:
ID (int) : Identifier of the Forex Factory News Event, in "DCHHMMI%T" format (D = day of the week from 1 to 7, C = currency from 1 to 9, HHMM = hour:minute in 24h, I = impact from 1 to 4, %T = event title ID) .
Returns: Returns the Forex Factory News Event.
method pullNews(N, n)
Decodes the Forex Factory News Event and adds it to the Forex Factory News array.
Namespace types: ffUtil.News
Parameters:
N (News type from toodegrees/forex_factory_utility/1) : Forex Factory News array.
n (float) : imported data from custom feed.
Returns: void
method readNews(N, S)
Pulls the individual Forex Factory News Event from the custom data feed format (joint News string), decodes them and adds them to the Forex Factory News array.
Namespace types: ffUtil.News
Parameters:
N (News type from toodegrees/forex_factory_utility/1) : Forex Factory News array.
S (string) : joint string of the imported data from custom feed.
Returns: void
marketClosed(N, S, S1, S2, S3, S4, S5, S6, S7, S8, S9)
If the current ticker's market is closed, Pine Seeds data will be pushed twice upon new day. This function saves the data pushed from the missing day.
Parameters:
N (News type from toodegrees/forex_factory_utility/1) : Forex Factory News array.
S (string ) : String array containing the Pine Seeds daya from the missing day.
S1 (string) : Data coming from TOODEGREES_FOREX_FACTORY_SLOT_1.
S2 (string) : Data coming from TOODEGREES_FOREX_FACTORY_SLOT_2.
S3 (string) : Data coming from TOODEGREES_FOREX_FACTORY_SLOT_3.
S4 (string) : Data coming from TOODEGREES_FOREX_FACTORY_SLOT_4.
S5 (string) : Data coming from TOODEGREES_FOREX_FACTORY_SLOT_5.
S6 (string) : Data coming from TOODEGREES_FOREX_FACTORY_SLOT_6.
S7 (string) : Data coming from TOODEGREES_FOREX_FACTORY_SLOT_7.
S8 (string) : Data coming from TOODEGREES_FOREX_FACTORY_SLOT_8.
S9 (string) : Data coming from TOODEGREES_FOREX_FACTORY_SLOT_9.
Returns: Updated string array containing the Pine Seeds daya from the missing day.
itradesize /\ Silver Bullet x Macro x KillzoneThis indicator shows the best way to annotate ICT Killzones, Silver Bullet and Macro times on the chart. With the help of a new pane, it will not distract your chart and will not cause any distractions to your eye, or brain but you can see when will they happen.
The indicator also draws everything beforehand when a proper new day starts.
You can customize them how you want to show up.
Collapsed or full view?
You can hide any of them and keep only the ones you would like to.
All the colors can be customized, texts & sizes or just use shortened texts and you are also able to hide those drawings which are older than the actual day.
You should minimize the pane where the script has been automatically drawn to therefore you will have the best experience and not show any distractions.
The script automatically shows the time-based boxes, based on the New York timezone.
Killzone Time windows ( for indices ):
London KZ 02:00 - 05:00
New York AM KZ 07:00 - 10:00
New York PM KZ 13:30 - 16:00
Silver Bullet times:
03:00 - 04:00
10:00 - 11:00
14:00 - 15:00
Macro times:
02:33 - 03:00
04:03 - 04:30
08:50 - 0910
09:50 - 10:10
10:50 - 11:10
11:50 - 12:50

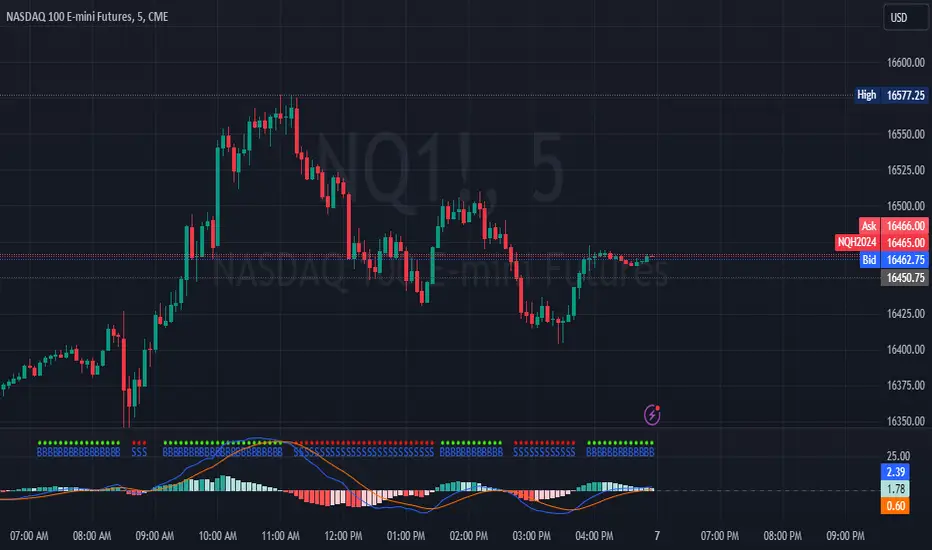
MACD Crossover with +/- FilterThis is to directly target when MACD crosses the Signal line. The purpose of this script is to target a +/- change of 3 in the MACD value after the most recent cross. It uses the value of the MACD line and holds it until a value of 3.00 + or - a crossover or crossunder happens. That's the significance of the red and green circles that appear on the chart. This is not financial advice, but I wanted to recreate what a friend of mine was doing manually and automate it for him.
The first circle that appears after MACD/SIGNAL lines cross would represent a potential trade idea. The circles after the first one match the intention of the first dot as they meet the condition of more than a value of -3 or +3 as the previous dot.
Inputs:
Standard Inputs as normal MACD (Moving Average Converging Divergence) within TradingView
Fast Length: User can change it to any value they want
Slow Length: User can change it to any value they want
Standard 12, 26, 9 as normal MACD // 9 being signal smoothing
Oscillator and Signal Line moving average type is using EMA's
Timeframe is dependent on user chart.
Circles are used for signaling the change in values. Red indicates a short-term bearish trend. Green indicates a short-term bullish trend.
Tested on lower timeframes:
1m, 3m, 5m, 15m, 60m
Not used as much on higher timeframes. Used for trading futures. This is what I use it for. It can be used for other futures than just NQ or ES, but those 2 are the ones that I've tested. Code it shown below for users to tinker with.
Style of indication symbol can be changed via settings within the indicator in the "Style" tab, as well as location of the symbol(s). Additionally, color can be changed as well, if you prefer different colors.
Not financial advice. Just trade ideas.
SandTigerSandTiger is an auto-counting tool that counts naturally occurring events in a price series. This version has been reduced to 377 lines of code and should run faster than previous versions. Although not shown here, I highly recommend running my 'ELB' script with SandTiger. ELB is an 'event locator' and will mark all points that SandTiger numbers - giving you visual cues as to where these points are located. ELB also displays support/resistance levels.
SandTiger is designed to be used with MAGENTA - a counting system for Forex and other markets.
MAGENTA is a free and open framework for understanding and explaining price movement in financial markets. Any materials associated with MAGENTA are strictly for educational purposes only.
SandTiger tracks Component Values, Dyads, and Sum Table Values (STV's) over straight and curved trends, allowing a trader to discern where directional shifts are likely to occur.
SandTiger requires just 3 things to function accurately:
1) A correct starting point (this will typically be an obvious trend turn high or low in a series of price moves).
2) A 'push 1' count ('push 1' runs from the starting point to the event prior to the first terminal of the first FCT or Fractured Counter-Trend).
3) A 'high prime' value (the high prime count runs from the starting point through to the second terminal of the first FCT with no skips).
FRAMEWORK OVERVIEW: 'Component' values are filtered from the prime set (including the half prime and further reductions). Once we have the comp table we add the values to get a 'total'. With the 'total' we divide and multiply by two to get two additional values. 'Derivatives' are based on various calculations using these three values.
We're looking for 'total/2' to count into either itself, 'total', 'total*2', or a derivative. Comp counts are in Tx form and counted from trend start. If the trend doesn't turn on a comp value it will likely turn on a Dyad or STV value. If that also doesn't happen it's likely you have a 'curved' trend/sequence that will turn on one of the above after moving away from its high/low. This can also be traded using SandTiger's 'Seg Terminals' skip option.
Sum tables and Dyad values are drawn from the 'primes' and Dyads use the 'push1' value as well. In a structural trend, primes are gotten by counting pushpulls 1 & 2 in 'Ti' form. Comps, Sum table values, and Dyads are equivalent, sequences can turn on either value type belonging to the 1st or 2nd prime set. Both STV's and Dyads are counted in 'Tx' form (except where count-through signals occur).
Types and antitypes correlate and are associated with a 12-count 'cycle.' (Ti = 'Terminals Included'; Tx = 'Terminals eXcluded'; both refer to FCT terminals)
THE STRATEGY:
For Structures: Trade Comps, Dyads, and STV's from sets 1 (all) and 2 (Dyads and STV's only) in the 'main' segment then on the 'carry-over' by skipping segment terminals. If a PC or cycle caps the sequence, trade that as well.
For NSM's: Trade movements that flash a signal prior to the end of the initial cycle. The mark will be the push1 value. Twelve will be the 'high prime.' Skip interrupts and trade carry-over values.
The first version of SandTiger was conceived/planned/authored by Erek A.D. and coded by Erek A.D. and @SimpleCryptoLife beginning in August 2022 and finishing in Dec. 2022
The current version was written and developed July 3, 2023 and has been refined and upgraded by Erek A.D. through Jan. 2024...
Market Health MonitorThe Market Health Monitor is a comprehensive tool designed to assess and visualize the economic health of a market, providing traders with vital insights into both current and future market conditions. This script integrates a range of critical economic indicators, including unemployment rates, inflation, Federal Reserve funds rates, consumer confidence, and housing market indices, to form a robust understanding of the overall economic landscape.
Drawing on a variety of data sources, the Market Health Monitor employs moving averages over periods of 3, 12, 36, and 120 months, corresponding to quarterly, annual, three-year, and ten-year economic cycles. This selection of timeframes is specifically chosen to capture the nuances of economic movements across different phases, providing a balanced view that is sensitive to both immediate changes and long-term trends.
Key Features:
Economic Indicators Integration: The script synthesizes crucial economic data such as unemployment rates, inflation levels, and housing market trends, offering a multi-dimensional perspective on market health.
Adaptability to Market Conditions: The inclusion of both short-term and long-term moving averages allows the Market Health Monitor to adapt to varying market conditions, making it a versatile tool for different trading strategies.
Oscillator Thresholds for Recession and Growth: The script sets specific thresholds that, when crossed, indicate either potential economic downturns (recessions) or periods of growth (expansions), allowing traders to anticipate and react to changing market conditions proactively.
Color-Coded Visualization: The Market Health Monitor employs a color-coding system for ease of interpretation:
-- A red background signals unhealthy economic conditions, cautioning traders about potential risks.
-- A bright red background indicates a confirmed recession, as declared by the NBER, signaling a critical time for traders to reassess risk exposure.
-- A green background suggests a healthy market with expected economic expansion, pointing towards growth-oriented opportunities.
Comprehensive Market Analysis: By combining various economic indicators, the script offers a holistic view of the market, enabling traders to make well-informed decisions based on a thorough understanding of the economic environment.
Key Criteria and Parameters:
Economic Indicators:
Labor Market: The unemployment rate is a critical indicator of economic health.
High or rising unemployment indicates reduced consumer spending and economic stress.
Inflation: Key for understanding monetary policy and consumer purchasing power.
Persistent high inflation can lead to economic instability, while deflation can signal weak
demand.
Monetary Policy: Reflected by the Federal Reserve funds rate.
Changes in the rate can influence economic activity, borrowing costs, and investor
sentiment.
Consumer Confidence: A predictor of consumer spending and economic activity.
Reflects the public’s perception of the economy
Housing Market: The housing market often leads the economy into recession and recovery.
Weakness here can signal broader economic problems.
Market Data:
Stock Market Indices: Reflect overall investor sentiment and economic
expectations. No gains in a stock market could potentially indicate that economy is
slowing down.
Credit Conditions: Indicated by the tightness of bank lending, signaling risk
perception.
Commodity Insight:
Crude Oil Prices: A proxy for global economic activity.
Indicator Timeframe:
A default monthly timeframe is chosen to align with the release frequency of many economic indicators, offering a balanced view between timely data and avoiding too much noise from short-term fluctuations. Surely, it can be chosen by trader / analyst.
The Market Health Monitor is more than just a trading tool—it's a comprehensive economic guide. It's designed for traders who value an in-depth understanding of the economic climate. By offering insights into both current conditions and future trends, it encourages traders to navigate the markets with confidence, whether through turbulent times or in periods of growth. This tool doesn't just help you follow the market—it helps you understand it.

Time Matrix TableICT stresses time and liquidity levels in his teachings. This table helps to easily locate these key Time-based price levels. You can use these levels to determine your directional bias and to help generate your narrative for where the market is going.
This indicator creates a table that gives you the price for the following liquidity levels:
PDO - Previous Day Open
PDH - Previous Day High
PDL - Previous Day Low
PDC - Previous Day Close
PDEQ - Equilibrium of the previous day's range. (Calculated by math.abs(((pdh-pdl)/2)+pdl))
PWH - Previous Week High
PWL - Previous Week Low
PDH2 - Two Days Back High
PDL2 - Two Days Back Low
PDH3 - Three Days Back High
PDL3 - Three Days Back Low
And gives you the opening price for the following times:
Daily Open - 6:00pm open for current session
1:30 AM
3:00 AM
4:00 AM
Midnight Open
6:00 AM
7:30 AM
8:30 AM
NY Open
10:00 AM
12:00 PM
NY PM - 1:30pm
2:00 PM
The levels are sorted descending in price in the table, with the background colored based on their relation to price. The prices are also plotted on the chart based on the range you specify in relation to the current price. These lines are also colored based on their relation to price.
This indicator does not give you anything but the price at a specific time, you must determine your own bias and narrative based on the levels that are given.

SILVER Midnight Candle Color Strategy 1-Hour Delay and SL/TP Overview:
The "Midnight Candle Color Strategy with 1-Hour Delay and SL/TP" is a unique trading strategy designed for the Forex market. This strategy capitalizes on the color of the midnight candle based on New York time, making trade decisions one hour later, at 1:00 AM.
Key Features:
Time Zone Adjustment: Automatically adjusts to New York time (UTC-5 or UTC-4 during Daylight Saving Time).
Midnight Candle Analysis: Utilizes the color of the midnight candle to gauge market sentiment.
Trade Execution at 1 AM: Trades are executed one hour after midnight based on the previous day's candle color.
Strategic SL/TP: Incorporates predefined stop loss (SL) and take profit (TP) levels for each trade.
How It Works:
The script first determines whether the current bar represents 12:00 AM or 1:00 AM in New York time.
At midnight, it records the color of the candle (green for bullish, red for bearish).
At 1:00 AM, the strategy:
Enters a long position if the midnight candle was green, with specific TP and SL settings.
Enters a short position if the midnight candle was red, again with defined TP and SL.
Visualization:
Optional markers are plotted on the chart for easy visualization of the strategy's entry points at midnight and 1 AM.
Usage Tips:
Ideal for traders focusing on overnight price movements and early morning trends.
Best suited for SILVER trading due to the 24-hour trading cycle.
We recommend backtesting the strategy with historical data to evaluate performance.
Disclaimer:
This strategy is provided for educational purposes and should not be considered as financial advice. Users should conduct their own research and exercise caution while trading. Past performance is not indicative of future results.
I´m not a signal service, however I´m sharing my signals. For free. If you wish to buy something, contact some other signalist, preferably with 5-10-15-20K followers, selling signals on the premium channel, but in reality not trading them themselves. If you will realise after few blown account that something is wrong, ask yourself why is that. Trading is not pushing the buy-sell button and drinking tequila on the beach. If you want to learn, you know what to do.

Tennis Ball ActionInspired by Mark Minervini's sell rules in "Think and Trade Like a Champion".
Used to determine if a stock is behaving well after a breakout
Used to determine when it might by prudent to reduce a position or sell
Used as a visual aid, but based purely off price and volume action
Here's a breakdown of what each condition checks for:
Up Close Counter: Checks for a sequence of upward closes. If there are 12 or more up closes in the last 15 days, it flags up_days as true.
Upper 50% Range Condition: Determines if 9 or more out of the last 15 closes are in the upper 50% of the price range.
Bullish Engulfing: Identifies a bullish engulfing candlestick pattern where the close is higher than the previous high and the open is lower than the previous low.
Stock Up 3% or More: Flags when the stock is up 3% or more on the day.
Inside Day Condition: Checks if the current day's high is lower than the previous day's high and the current day's low is higher than the previous day's low.
Close Below 50-day SMA: Indicates a negative confirmation when the stock closes below the 50-day Simple Moving Average (SMA).
Weak Close Condition: Similar to the Upper 50% Range Condition, but looking for lower closes.
Close Below 20-day SMA: Another negative confirmation when the stock closes below the 20-day SMA.
Three Lower Lows: Identifies a pattern where the current close is lower than the previous two closes.
Down on Above Average Volume: Flags when the stock closes lower than the previous day's close and the volume is higher than the 20-day SMA of volume.
The script then tallies up the confirmations and violations based on these conditions and plots them on a histogram. Confirmations are represented in green, violations in red.
This indicator evaluates both bullish and bearish signals based on various technical conditions to assist traders in decision-making. The confirmations suggest potential bullish movements, while violations indicate potential bearish movements in the stock.
