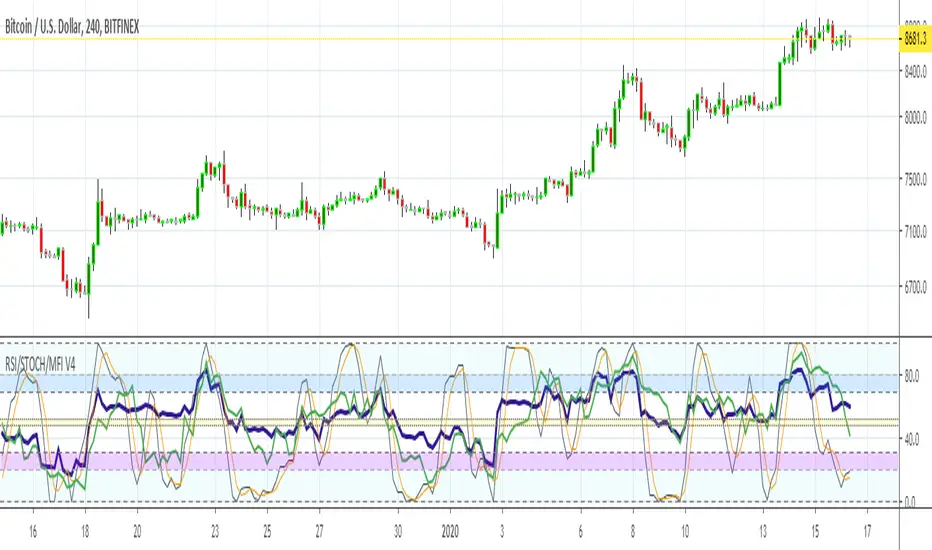
MFI RSI w STOCH OVERLAY V3Combines: Relative Strength (purple) and RSI Stoch (Orange/gray), Money Flow (green) all in one indicator window.
On screen indicator text identifier will read in this order: "RSI/STOCH/MFI V3"
// Changes from original version \\
It was important to bring forth the RSI indicator as the most visually important line and its relationship to the background.
A: Major visual changes from my first published one..as default now
1: Increased RSI line to size 3
2: Increased MFI line to size 2
3: Separated all Bar Line Fields in the background for custom editing, total of 5 now. Much easier to distinguish when the RSI enters these fields.
B: Other major changes as default now
1: Sped up the indicators from 14 to 11, for quicker response. (user can adjust back to 14 or another number)
2: Increased user friendly inputs to adjust colors, lines, data, etc.
3: (darken / lighten and change background colors, increase/decrease line strengths and colors, adjust field data inputs)
Enjoy and Good Luck Trading.
Komut dosyalarını "11月1日是什么星座" için ara
Trading Public School ST1This is a derivative of Trading Public School "TTM Squeeze" volatility indicator, as discussed in his book "Mastering the Trade" (chapter 11).
Black crosses on the midline show that the market just entered a squeeze ( Bollinger Bands are with in Keltner Channel). This signifies low volatility , market preparing itself for an explosive move (up or down). Gray crosses signify "Squeeze release".
Mr.Carter suggests waiting till the first gray after a black cross, and taking a position in the direction of the momentum (for ex., if momentum value is above zero, go long). Exit the position when the momentum changes (increase or decrease --- signified by a color change). My (limited) experience with this shows, an additional indicator like ADX / WaveTrend, is needed to not miss good entry points. Also, Mr.Carter uses simple momentum indicator , while I have used a different method (linreg based) to plot the histogram. 100% Profit & loss 10% Only

Squeeze Momentum Strategy based on Indicator [LazyBear][Bitduke]I improved Squeeze Momentum Indicator by LazyBear (momentum filter, changed data source to ohlc4) and transformed it into a strategy, adding a risk management system + ability to customize time frames for backtest.
Shortly about Squeeze Momentum Indicator:
This is a derivative of John Carter's "TTM Squeeze" volatility indicator, as discussed in his book "Mastering the Trade" (chapter 11).
Backtested on XBTUSD, ETHUSD (Bitmex). As you may notice it shows good results on 1h - 4h timeframes on these timeframes among these pairs. Relatively low drawdown ~ 12% (to date).

BitMEX pump catcher - MACDThis is a modified version of the BitMEX pump catcher by Jomy .
I have tweaked the algorithm to use the difference in MACD to get the correct direction of entries rather than using direction of candles which are not always indicative of trend direction. These changes increase net profit, profitable trades, while reducing drawdown.
Below is a copy and paste of Jomy's explanation of the algorithm.
What is going on here? This strategy is pretty simple. We start by measuring a very long chunk of volume history on BitMEX:XBTUSD 1 hour chart to find out if the current volume is high or low. At 1.0 the indicator is showing we are at 100% of normal historical volume . The blue line is a measure of recent volume! This indicator gets interested when the volume drops below 90% of the regular volume (0.9), and then comes back up over 90%. There's usually a pump of increased price activity during this time. When the 0.9 line is crossed by the blue line, the indicator surveys the last 2 bars of price action to figure out which way we're going, long or short. Green is long. Red is short. To exit the trade we use a 7 period fast ema of the volume crossing under an 11 ema slower period which shows declining interest in the market signifying an end to the pump or dump. The profit factor is quite high with 5x leverage, but historically we see 50% drawdown -- very risky. 1x leverage looks nice and tight with very low drawdown. Play with the inputs to see what matches your own risk profile. I would not recommend taking this into much lower timeframes as trading fees are not included in the profit calculations. Please don't get burned trading on stupid high leverage. This indicator is probably not going to work well on alts, as Bitcoin FOMO build up and behavior is different. This whole indicator is tuned to Bitcoin , and attempts to trade only the meatiest part of the market moves.
Jomy should get full credit to this indicator

BitMEX pump catcherWhat is going on here? This strategy is pretty simple. We start by measuring a very long chunk of volume history on BitMEX:XBTUSD 1 hour chart to find out if the current volume is high or low. At 1.0 the indicator is showing we are at 100% of normal historical volume. The blue line is a measure of recent volume! This indicator gets interested when the volume drops below 90% of the regular volume (0.9), and then comes back up over 90%. There's usually a pump of increased price activity during this time. When the 0.9 line is crossed by the blue line, the indicator surveys the last 2 bars of price action to figure out which way we're going, long or short. Green is long. Red is short. To exit the trade we use a 7 period fast ema of the volume crossing under an 11 ema slower period which shows declining interest in the market signifying an end to the pump or dump. The profit factor is quite high with 5x leverage, but historically we see 50% drawdown -- very risky. 1x leverage looks nice and tight with very low drawdown. Play with the inputs to see what matches your own risk profile. I would not recommend taking this into much lower timeframes as trading fees are not included in the profit calculations. Please don't get burned trading on stupid high leverage. This indicator is probably not going to work well on alts, as Bitcoin FOMO build up and behavior is different. This whole indicator is tuned to Bitcoin, and attempts to trade only the meatiest part of the market moves.
Weaknesses: it can sometimes pick to trade the wrong direction if if hits support or resistance and changes direction after a trade is entered. Use a stoploss.
Strengths: It usually gets things right. Historically over 57% right.
Use at your own risk!

6 Figures Scalping 2x MACD10-11-2019
This script plots a double MACD in a new indicator pane
The default settings:
Pink = STD MACD , settings 12-26-9
Green - Fast MACD, settings 5-15-1
The MACD settings can be changed in the indicators setting window

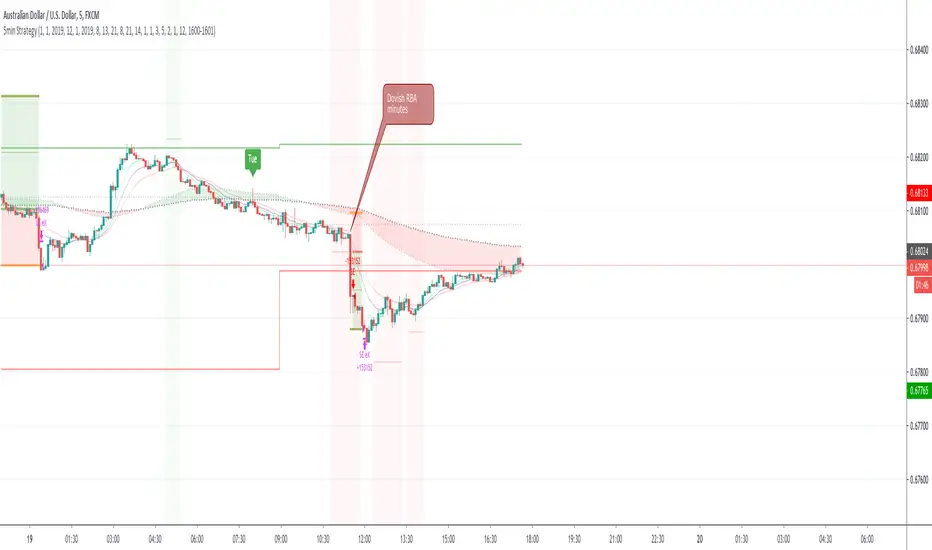
First time coding - a 5min forex Scalping strategy This is my first attempt at producing a strategy in Pine Script.
I am NOT a professional coder. I'm not even a good coder at that. I've only started Pine Script coding since September 2019. I am teaching myself.
This script is far from finished. I need to tweak a number of things about this script. Namely:
Add a validity window to the 'trigger bar' condition. Ie, I want to shut down the condition when the price closes above EMA21
Change the order entry so they are stop orders, using the stop entry price derived from the signals
Make changes to lot sizing
Add a trailing stop condition
Comments welcome, but do not expect me to reply to any questions or requests. In fact, don't expect any replies from me. I consider myself notoriously bad at replies.
I do welcome any feedback from any seasoned coders out there, as I am still a novice coder, and have so much to learn!
As to anyone who wants to criticise me - constructive and helpful criticism are most welcome, criticism to make yourself feel superior to me - you kind can eat a dk.
For the strategy rules, google the user ForexSignals TV account and look for the video "SIMPLE and PROFITABLE Forex Scalping Strategy".
Share, learn, prosper
Peace to y'all
Serialhenry
6/11/19
Easy to Use Stochastic + RSI StrategyA simple strategy that yields some great results.
CODE VARIABLES
LINE 2 - Here you can change your currency and amount you want to invest on each entry.
LINE 10/11/12 - Here we establish what date we want to start backtesting from. Simply change the defval on each line to change the date (In the code below we start on Jan 1st, 2014).
LINES 19 through 27 - Here we set our Stochastic and RSI sensitivity (Currently %K = 14, %D = 3, RSI = 14). Change these to your preference.
LINE 39/41 - Here we execute our orders (Currently set when %K crosses %D under the 20 value and RSI is less than 50 to BUY, %K crosses %D above the 80 value and RSI is greater than 60 to SELL). Change these to your preference.
NOTE: As a beginner you may not want to short stock, therefore LINE 6 was added to only allow long positions.
I didn't overlay the RSI value over the Stochastics because it was too cluttered. Just add the RSI indictor seperately to your layout.
As always, couple this with trend following and exit/entry rules to make the profitability even higher!
Cheers!

MAC-Z [ChuckBanger]Here I show the relationship between the MACD and Z-Score in a indicator called MAC-Z. MACD is short for moving average convergence/divergence and is in it self showing the relationship between two EMA. The Z-Score in contrast is related to Bollinger Bands and in MAC-Z the Z-score is the difference between the current price and a moving average divided by the standard deviation of price over the same time period.
MAC-Z has its best use in the short term time frames in my opinion compared to MACD. Here i show from current time of writing how effective it is.
More info on MAC-Z:
cssanalytics.wordpress.com
Also take a look at MACD Leader:

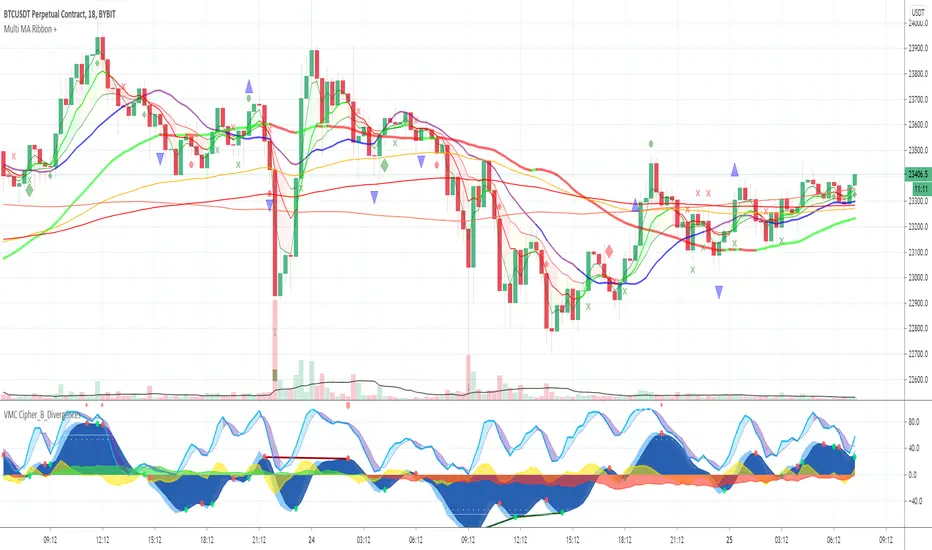
Multi MA Ribbon +Draws an MA Ribbon that highlights major MA's and for easier visibility separates them into different groups including Custom MA's, Baseline MA's, T Line MA's, Short Term MA's and Long Term MA's.
Choose between 11 different types of MA's thanks to JustUncleL and John F. Ehlers super smoother.
The + is for various signals and alerts derived from Market Cipher / Wave Trend indicators and TCG etc.
Happy Trading and remember just follow the flow of the river!
Currency Strength Gold MethodolgyThis script was written by, and used with the express permission of, Eduardo Andrade. The purpose of the script is easily determine respective currencies strength and weakness as utilized in The Gold Methodology - Ichimoku.
Tradingview members can use this script to see how each currency pair performed the day before as the reading is based is based upon the 11:00 p.m. GMT 60 minute candle (just before the Tokyo open).
Each currency is ranked in order of descending Strength and are designated by the following colors:
Orange = AUD
Green = CAD
Aqua = CHF
Purple = EUR
Red = GBP
Yellow = JPY
Black = NZD
Blue = USD
I hope you find he script beneficial and if you have any questions, please comment or send me a message.
have a great weekend!!
Allen

Saturn–Pluto Cycle
Indicator colors background of the chart in the following way:
Saturn - Pluto Cycle in conjunction: Blue
Saturn - Pluto Cycle in opposition: Yellow
While opposition periods are indicated according to the actual date ranges an opposition occurs, conjunctions last only for one day.
Conjunctions indicated with this indicator mark a period around the actual conjunction date.
The actual date a conjunction occurs is indicated in the script.
Following the dates which were considered for this indicator:
Dates of Saturn–Pluto Conjunctions
October 5, 1914 at 2° Cancer (recurrence on May 20, 1915)
August 11, 1947 at 13° Leo
November 8, 1982 at 27° Libra
January 12, 2020 at 22° Capricorn
Dates of Saturn–Pluto Oppositions
February 17, 1931 – December 13, 1931 at 19°–21° Capricorn–Cancer (conjunct their respective North and South Nodes)
April 23, 1965 – February 20, 1966 at 14°–17° Pisces–Virgo
August 5, 2001 – May 26, 2002 at 12°–16° Gemini–Sagittarius (conjunct the lunar nodes)


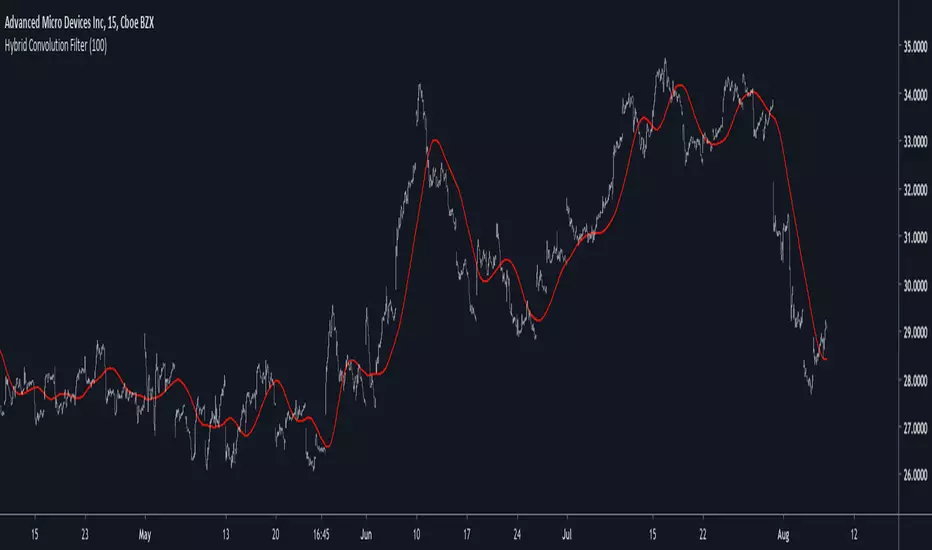
Hybrid Convolution FilterIntroduction
Today i propose an hybrid filter that use a classical FIR architecture while using recursion. The proposed method aim to reduce the lag generated by fir filters. This particular filter is a sine weighted moving average, but you can change it since the indicator is built with the custom filter template (1). Even if it use recursion it still is a FIR filter since the impulse response is finite.
The Indicator
In red the hybrid swma and in blue the classic swma of both the same period. The difference can be seen.
The switch between the input price and the past values of the previous convolution values is made by using exponential averaging, the window function is the same as f(x) in the code.
Any filter can use this architecture, the indicator is built around the custom fir template, see (1)
Conclusion
I presented a FIR filter using recursion in its calculation, the integration is made with respect to the proposed template, therefore any user can simply modify f(x) to have different filter without the need to make any change. However curious users might want to change the window function of the exponential averager, in order to do so change sgn = f(i/length) in line 11 for sgn = fun(i/length) where fun is your custom function, make sure to add it at the start of the script where all the other functions declarations are.
Thanks for reading !
(1)
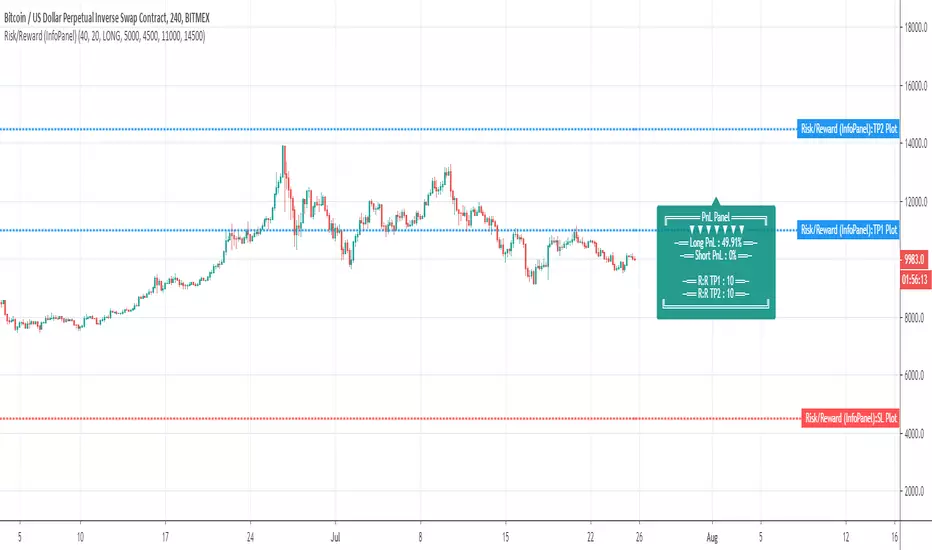
Risk/Reward (InfoPanel)Hello ladies (if any in my followers ?) and gentlemen
Here's your indicator of the day and once again given for FREE. What I'm going to say to my landlord if I can't pay rent because I'm not asking for $$ ?
I'll probably send the next indicators from below the town brige. Even then... I will still comply with my challenge to share 1 original indicator a day and not a copy of what already exists
The today indicator is to show you the great possibilites behind the TradingView Label object : Label
Profit And Loss LABEL
I thought about that one for a while and wanted to share how we can calculate dynamically a Risk to Reward ratio .
This indicator is not based on the price on the chart. I repeat before getting the question asked me privately 10 times This indicator is not based on the price on the chart.
"Then it's not useful dude, you're dumb". I agree and.... I agree... BUT you can now calculate your Risk to Reward ratio on TradingView directly rather than using an external Excel file. Who's dumb now :) ?
For those curious about it, I used this formula for the R:R ratio formula Calculating-risk-reward.asp
It will also display the Profit and Loss data based on your inputs only
ERRORS LABEL
I also added some basic errors management. If any error occur when you'll type your inputs, then a very mean Error label will appear and you'll have to fix the issues in less than a few seconds.
Otherwise your computer will explode (KABOOOOM) and your trading capital will be redirected to my own insurance fund (I have a family to feed, thanks for your sacrifices)
(end of joke)
In more seriousness, the engine will check if the TP1/TP2/Stop Loss/Entry price combinaisons makes sense. If not, you''ll be punished with an error label.
You can use this methodology for your own indicators in the futur to display dynamic messages based on users' inputs and/or current price on the chart
The educational video giving more details is coming right up.
You can watch it and should be located under "IDEAS"
Wshing you all a very fruitful end of your day and see you tomorrow for the last indicator of the week (baby David is tired and need his rest)
Dave
Minimal Godmode 2.1// Acknowledgments:
// Original Godmode Authors:
// @Legion, @LazyBear, @Ni6HTH4wK, @xSilas
// Drop a line if you use or modify this code.
// Godmode 3.1.4: @SNOW_CITY
// Godmode 3.2: @sco77m4r7in and @oh92
// Godmode3.2+LSMA: @scilentor
// Godmode 4.0.0-4.0.1: @chrysopoetics
// Jurik Moving Average: @everget
// Constance Brown Composite Index RSI: @LazyBear
// Wavetrend Oscillator: @fskrypt
// TTM Squeeze: @Greeny
// True TSI/RSI: @cI8DH and @chrysopoetics
// Laguerre RSI (Self-Adjusting Alpha with Fractals Energy): @everget
// RSI Shaded: @mortdiggiddy
// Minimal Godmode v2.0:
// 6 BTC pairs/exchanges (instead of 11) to reduce loading time from the pinescript security() function
// Volume Composite for engine calculation
// TTM Squeeze on Wavetrend Signal
// Constance Brown Composite Index RSI (CBCI)
// TrueTSI (Godmode 4.0.0 implementation)
// Laguerre RSI (LRSI)
// Minimal Godmode v2.1:
// Removed TTM Squeeze and Volume Composite
// EMA for Wavetrend Signal
// Multi-exchange for BTC no longer the default
// mg engine toggle for CBCI, Laguerre RSI, and TTSI
// Wavetrend Histogram component toggle
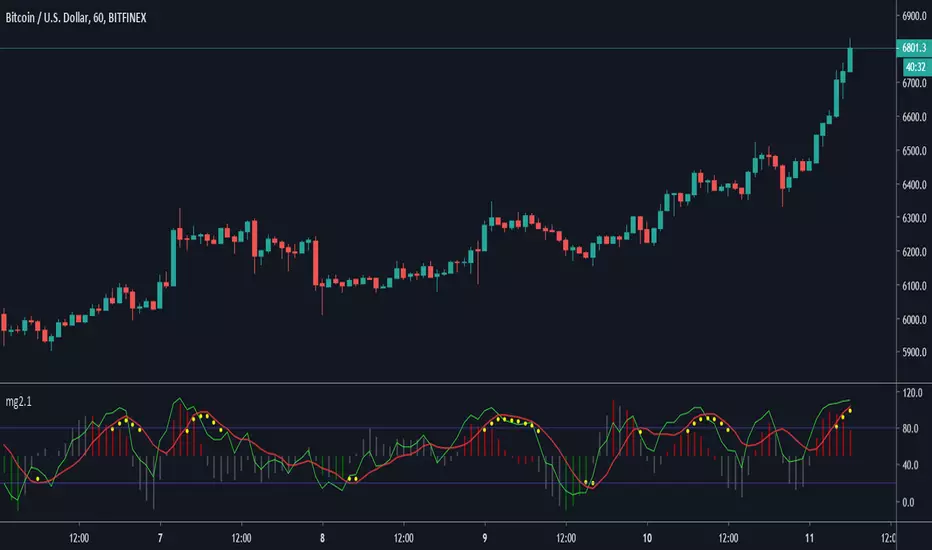
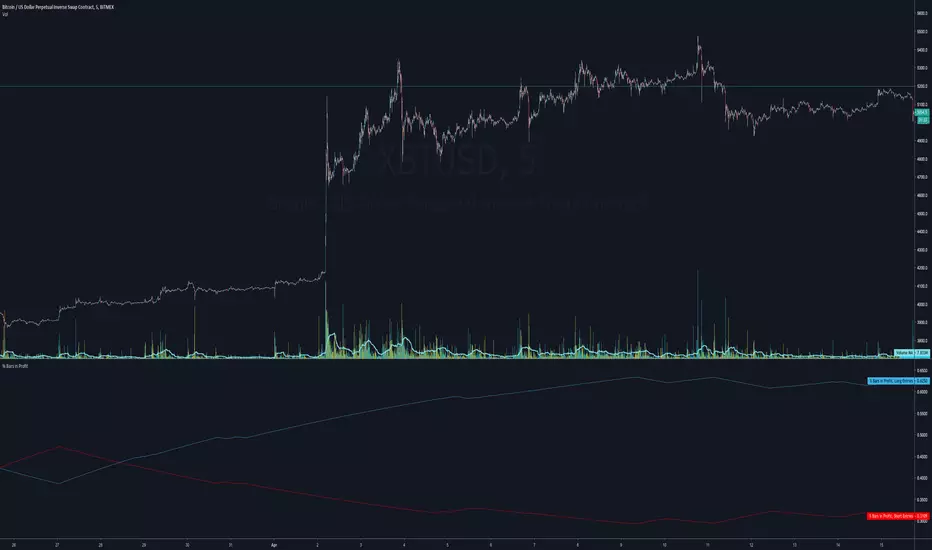
% Bars in ProfitUse this to determine how often your average entry price for shorts and longs over the last 11 trades are in profit or not.
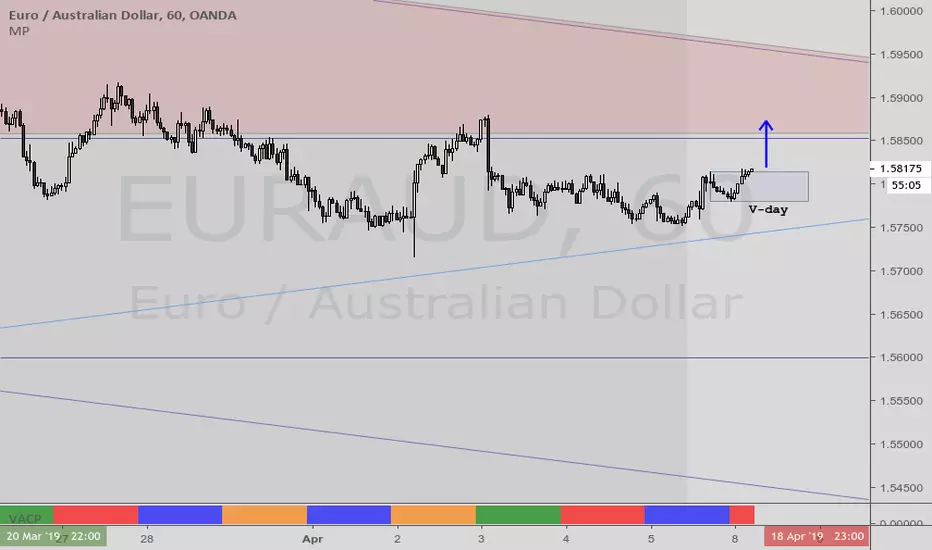
VACPWelles Wilder (delta phenomenon) a 4-day rotation indicator
PVAC is the acronym Alan uses for a four-day rotation cycle. The cycle itself is circularly continuous every days of the week, forever, including every holiday. Thus if, for instance, Monday was a P, Tuesday is V, Wednesday is A, Thursday is C. At this point the cycle repeats, with Friday being P, Saturday being V, Sunday being A, and the following Monday being C.
Having started, the cycle never changes. While each day tends to have the characteristics shown below, like all cycle tools, there are inversions, which will last a cycle or at times even more, and have reasonable odds of inverting regularly.
A trader who wants to incorporate a four-day rotation cycle into their work is encouraged to study for themselves whether this adds value.
Day: V-day Color: Red Characteristics: Closes well for bulls; Use your fleece bars Bar8 and Bar11; Bar8 open often a V-day return target; 'V' return comes early in day in bear moves, late in day in bullish moves
Day: A-day Color: Blue Characteristics: Closes poorly for bulls; Use your fleece bars 8 and 11; Generally 'A' shaped, but may have a kick-leg after 3pm
Day: C-day Color: Orange Characteristics: Consolidation day, aka 'consoly' day. It may not chop, but it may have an
accumulation or distribution quality to the action; Trade often and trade fast; Pattern traders fade 4HHs and 4LLs with backfill/pullbacks 3 bars later; Apexes and angulars tend to have less importance; Numerical traders trade after Bar8 open and use support one horizontal below, resistance one horizontal above; C-day opens often at the 25%; The afternoon action tends to be opposite to the morning action
Day: P-day Color: Green Characteristics: Often a trend day. Find the trend and enter it; Often opens at the 75%; Trade P-days against a quartile; Watch for price to be above/below the first apex: buy above or sell below ; Do not fade dead zone, minimal trading
SMA/pivot/Bollinger/MACD/RSI en pantalla gráficoMulti-indicador con los indicadores que empleo más pero sin añadir ventanas abajo.
Contiene:
Cruce de 3 medias móviles
La idea es no tenerlas en pantalla, pero están dibujadas también. Yo las dejo ocultas salvo que las quiera mirar para algo.
Lo que presento en pantalla es la media lenta con verde si el cruce de las 3 marca alcista, amarillo si no está claro y rojo si marca bajista.
Pivot
Normalmente los tengo ocultos pero los muestro cuando me interesa. Están todos aunque aparezcan 2 seguidos.
Bandas de Bollinger
No dibujo la línea central porque empleo la media como tal.
Parabollic SAR
Lo empleo para dibujar las ondas de Elliott como postula Matías Menéndez Larre en el capítulo 11 de su libro "Las ondas de Elliott". Así que, aunque se puede mostrar, lo mantengo oculto y lo que muestro es dónde cambia (SAR cambio).
MACD
No está dibujado porque necesitaría sacarlo del gráfico.
Marco en la parte superior cuándo la señal sobrepasa al MACD hacia arriba o hacia abajo con un flecha indicando el sentido de esta señal.
RSI
Similar al MACD pero en la parte inferior.
Probablemente, programe otro indicador para visualizar en una ventanita MACD, RSI y volumen todo junto. El volumen en la principal hay veces que no te permite ver bien alguna sombra y los otros 2 te quitan mucho espacio para graficar si los tienes permanentemente en 2 ventanas separadas.
[astropark] MACD, RSI+, Awesome Oscillator//******************************************************************************
// Copyright by astropark v3.0.0
// MACD, RSI+, Awesome Oscillator
// 24/10/2018 Added RSI with Center line to have clear glue of current trend
// 10/12/2018 Added MACD
// 13/12/2018 Added multiplier for MACD in order to make it clearly visible over RSI graph
// 11/01/2019 Added Awesome Ascillator (AO)
//******************************************************************************

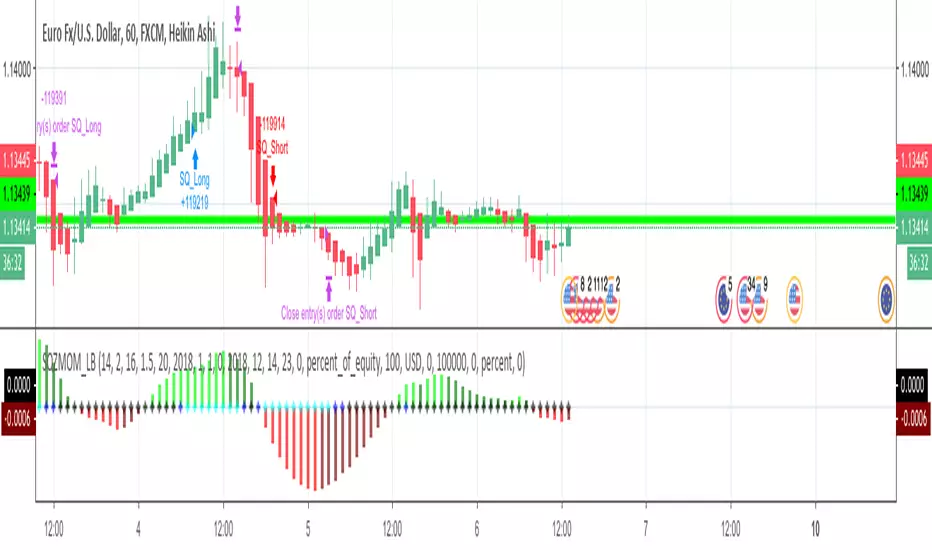
Strategy based on Squeeze Momentum Indicator [LazyBear]This Strategy is based on LazyBear Squeeze Momentum Indicator.
I added some custom feature and filters.
You can customize a lot of features to get a profitable strategy.
Here is a link to original study.
Please use comment section for any feedback.
Next improvement (only to whom is interested to this script and follows me): study with alerts on multiple tickers all at one. Leave a comment if you want to have access to study.
********************************** IMPORTANT*******************************
I have developed an expert advisor for metatrader4 (MT4) and for jforex platform: results of expert advisor form 2015-01-01 to 2018-11-25 are very good with low drawdown and good profit.
********************************************************************************
BTC Volume Index [v2018-11-21] @ LekkerCryptisch.nlIndicates the volume trend:
~50 = short term volume is the same as long term volume
> 50 = short term volume is higher than long term volume (i.e. trend is rising volume)
< 50 = short term volume is lower than long term volume (i.e. trend is declining volume)
