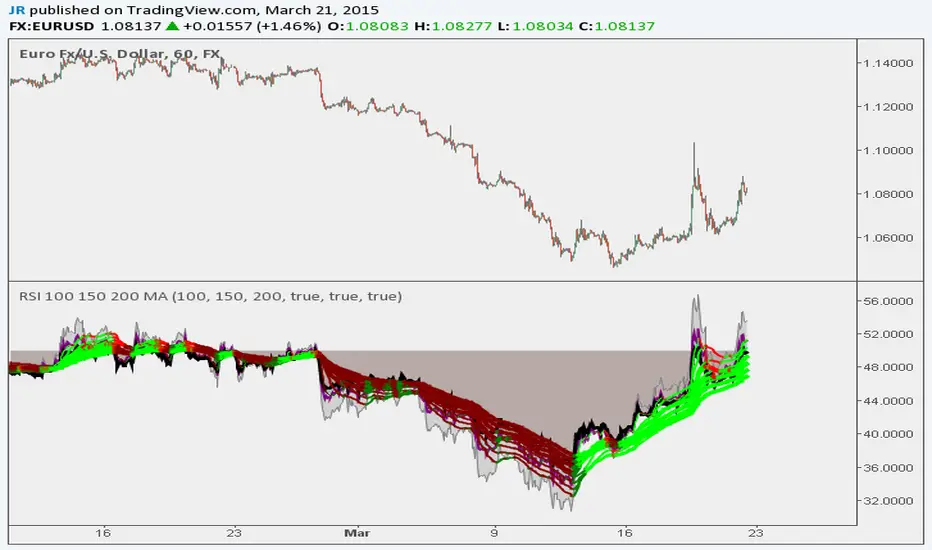
RSI 100 150 200 MA Ribbon
Following Trends and Finding Divergences
Here is a script example that uses a long length (100, 150, 200) RSI MA Ribbon to detect trend reversals using lower time frames. You can also use traditional RSI to find divergences.
Built Best for 1H to 10 Min Charting
BTCUSD
"100年黄金价格走势" için komut dosyalarını ara
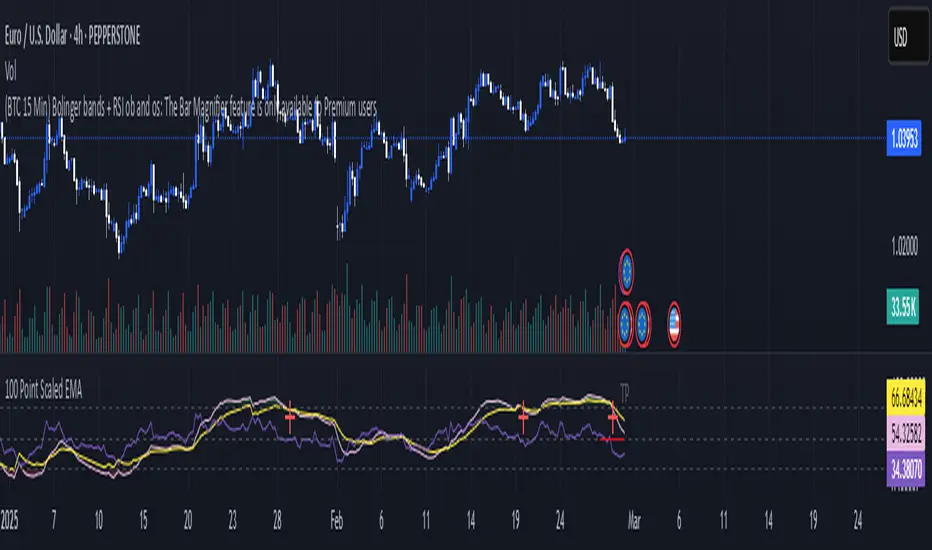
100 Point Scaled EMA100 Point Scaled EMA is a distinctive indicator that standardizes trend analysis by normalizing price data. Here’s a breakdown of its technical features:
Normalized Exponential Moving Averages (EMAs):
Dual EMAs: Configurable lengths (typically 9 and 21) are applied to calculate EMAs.
Scaling Mechanism: The EMAs are normalized to a fixed 0–100 range using the highest and lowest prices over the last 100 bars, enabling consistent analysis regardless of market volatility.
Integrated Relative Strength Index (RSI):
A 14-period RSI is incorporated to provide additional momentum and overbought/oversold insights.
Dynamic Visual Cues:
Gradient Fills: Visual gradients highlight overbought and oversold regions, enhancing the readability of trend shifts.
Crossover Signals:
The script detects EMA crossovers with specific conditions—crossover events occurring below 25 and above 75—to mark potential trade setups.
This technical approach makes the 100 Point Scaled EMA a powerful tool for traders, offering a simple unique and standardized perspective on market trends.
50-100-200 Day SMAA simple indicator that display the 50, 100, and 200 Daily SMA. It will always display the DAILY 50,100, 200, regardless of the time frame you are looking at. Makes it easy to quickly display these key averages while also looking at smaller timeframes like 1H candles.

EMA 20/50/100/200Script that publishes the EMA for 20, 50, 100, and 200.
Follow me on Twitter at @PotatoMcGruff
100s Level LinesPurpose of the Script
- Visualize Key Levels: The script highlights round-number levels (e.g., 100, 200, 300) automatically, making it easy to identify areas where price action might react.
- Improve Decision-Making: These levels can serve as benchmarks for entry, exit, stop-loss, or take-profit placement.
- Simplicity: Instead of manually drawing levels, the script dynamically updates to match the chart's price range.
Features of the Script
- Dynamic Level Calculation: The script calculates 100s levels based on the asset's current price range and plots lines above and below the visible chart area.
- Customizable Settings: Adjust line color, style (solid, dashed, or dotted), and width to suit your charting preferences.
- Auto-Scaling: Automatically adjusts to the chart's visible price range, ensuring plotted levels are always relevant.
- Labeling: Each line can optionally display its exact value (e.g., "1400," "1500") for easy reference.
- Performance Optimization: Efficient calculations ensure the script doesn’t slow down TradingView, even on volatile instruments like the US100.
How the Script Works
- The script detects the highest and lowest visible prices on the chart to define the range.
- Starting from the lowest 100-point increment within the visible range, the script calculates all 100-point levels up to the highest visible price.
- It plots horizontal lines across the chart for each calculated level.
- Optionally, labels can be added to display the value of each level.
How to Use the Script
- Copy the script code into the Pine Script editor in TradingView and apply it to your chart.
- Open the script settings to adjust line color, style, width, and label visibility.
- Use the plotted 100s levels as psychological support and resistance zones for trade entries, exits, and stop-loss or take-profit placement.
Example Use Cases
- Identify potential reversal points as the price approaches a 100s level in intraday trading.
- Confirm support or resistance zones on higher timeframes for swing trading setups.
- Use the levels to trail stop-losses during trending markets and lock in profits incrementally.
Customizable Options
- Line Color: Change the color of the horizontal lines.
- Line Style: Choose solid, dashed, or dotted lines.
- Line Width: Adjust the thickness of the lines for better visibility.
- Show Labels: Toggle price values on or off for each level.
Advantages
- Saves Time: Automatically plots levels, eliminating manual effort.
- Adaptable: Works on all timeframes and assets.
- Psychological Relevance: Highlights levels that align with trader psychology and market behavior.

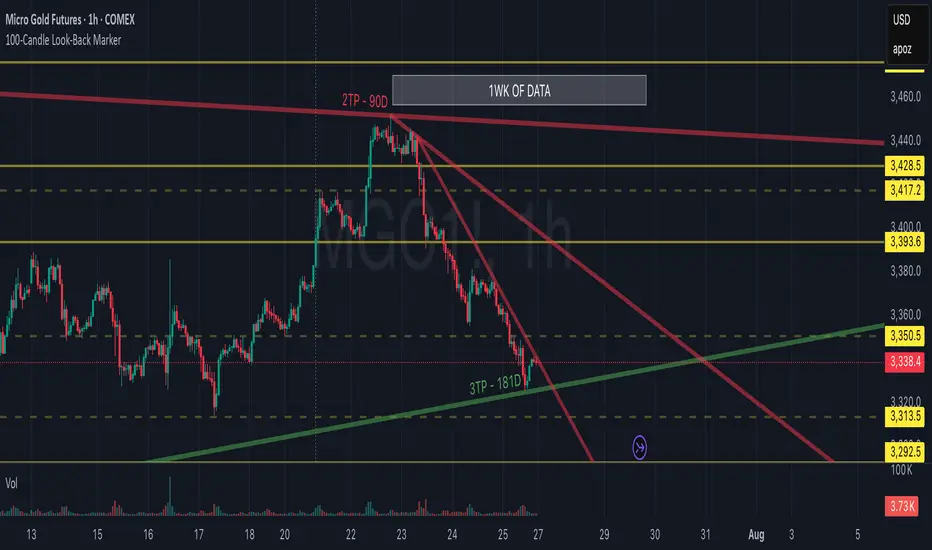
100-Candle Look-Back MarkerIt simply redraws one vertical dotted line that always sits exactly 100 bars behind the current bar, so you can check at a glance that any trend-line you draw has at least 100 candles of data to the right of it.
FlowFusion Money Flow — FP + VWAP Drift + PVT (−100..+100)Title (ASCII only)
FlowFusion Money Flow — Flow Pressure + Rolling VWAP Drift + PVT (Normalized −100..+100)
Short Description
Original money-flow oscillator combining Flow Pressure, Rolling VWAP Drift, and PVT Momentum into one normalized score (−100..+100) with a signal line, thresholds, optional component plots, and ready-made alerts.
Full Description (meets “originality & usefulness”)
What’s original
FlowFusion Money Flow is not a generic mashup. It builds a single score from three complementary, volume-aware components that target different facets of order flow:
Flow Pressure (FP) — In-bar directional drive scaled by relative volume.
Drive
=
close
−
open
max
(
high
−
low
,
tick
)
∈
=
max(high−low, tick)
close−open
∈ .
Relative Volume
=
volume
average volume over
𝑓
𝑝
𝐿
𝑒
𝑛
=
average volume over fpLen
volume
.
𝐹
𝑃
𝑟
𝑎
𝑤
=
Drive
×
RelVol
FP
raw
=Drive×RelVol then squashed (softsign) to
.
Why it belongs: distinguishes real pushes (big body and big volume) from noise.
Rolling VWAP Drift — Direction of VWAP itself over a rolling window, normalized by ATR.
𝑉
𝑊
𝐴
𝑃
𝑡
=
∑
(
𝑇
𝑃
×
𝑉
𝑜
𝑙
)
∑
𝑉
𝑜
𝑙
VWAP
t
=
∑Vol
∑(TP×Vol)
over vwapLen.
Drift
=
𝑉
𝑊
𝐴
𝑃
𝑡
−
𝑉
𝑊
𝐴
𝑃
𝑡
−
1
𝐴
𝑇
𝑅
=
ATR
VWAP
t
−VWAP
t−1
→ squashed to
.
Why it belongs: persistent VWAP movement signals sustained accumulation/distribution.
PVT Momentum — Price-Volume Trend standardized (z-score) and squashed.
𝑃
𝑉
𝑇
𝑡
=
𝑃
𝑉
𝑇
𝑡
−
1
+
𝑉
𝑜
𝑙
×
Δ
𝐶
𝑙
𝑜
𝑠
𝑒
𝐶
𝑙
𝑜
𝑠
𝑒
𝑡
−
1
PVT
t
=PVT
t−1
+Vol×
Close
t−1
ΔClose
.
𝑧
=
𝑃
𝑉
𝑇
−
SMA
(
𝑃
𝑉
𝑇
)
StDev
(
𝑃
𝑉
𝑇
)
z=
StDev(PVT)
PVT−SMA(PVT)
→ squashed to
.
Why it belongs: captures volume-weighted trend pressure without relying on price alone.
Composite score:
Score
=
𝑤
𝐹
𝑃
⋅
𝐹
𝑃
+
𝑤
𝑉
𝑊
𝐴
𝑃
⋅
𝑉
𝑊
𝐴
𝑃
_
𝐷
𝑟
𝑖
𝑓
𝑡
+
𝑤
𝑃
𝑉
𝑇
⋅
𝑃
𝑉
𝑇
_
𝑀
𝑜
𝑚
𝑤
𝐹
𝑃
+
𝑤
𝑉
𝑊
𝐴
𝑃
+
𝑤
𝑃
𝑉
𝑇
Score=
w
FP
+w
VWAP
+w
PVT
w
FP
⋅FP+w
VWAP
⋅VWAP_Drift+w
PVT
⋅PVT_Mom
with a Signal = SMA(Score, sigLen). Thresholds mark strong accumulation/distribution zones.
How it works (step-by-step)
Compute FP, VWAP Drift, PVT Momentum.
Normalize each to the same
scale.
Weighted average → FlowFusion Score.
Smooth with a Signal line to reduce whipsaw.
Optional background shading when Score exceeds thresholds.
How to use
Direction filter:
Score > 0 favors longs; Score < 0 favors shorts.
Momentum turns:
Score crosses above Signal → setup for long; below → setup for short.
Strength zones:
Above Upper Threshold (default +40) = strong buy pressure; below Lower (−40) = strong sell pressure.
Confluence:
Best near S/R, trendlines, or HTF bias. For scalping on 1–5m, consider sigLen 9–13 and thresholds ±40 to ±50.
Alerts included: zero cross, zone entries, and Score/Signal crossovers.
Inputs (key)
fpLen (20): relative-volume lookback for Flow Pressure.
vwapLen (34): rolling VWAP window.
pvtLen (50): PVT z-score window.
sigLen (9): Signal smoothing.
Weights: wFP, wVWAP, wPVT to bias the blend.
Thresholds: upperBand / lowerBand (defaults +40/−40).
Display: toggle component plots and background shading.
Best practices
Trending markets: increase wVWAP (VWAP Drift) or widen thresholds.
Ranging markets: increase wFP and wPVT; take quicker profits.
News: wait for bar close confirmation or reduce size.
Data quality: use consistent volume feeds (especially in crypto).
Limitations
Oscillators can stay extreme in strong trends; use structure/trend filters.
Volume anomalies (illiquid pairs, API glitches) can distort signals—sanity-check with another venue when possible.
Disclaimer
This indicator is for educational purposes only and is not financial advice. Trading involves risk; past performance does not guarantee future results. Always paper-trade first and use appropriate risk controls.

EMA 50/200/100 [NevoxCore]⯁ OVERVIEW
EMA 50/200/100 is a clean EMA trio for trend mapping.
It highlights the classic 50/200 bias, keeps a constant EMA-100 anchor in white, plots cross dots, and can mark the first pullback back to a target EMA within an ATR tolerance.
Solid bias bar coloring (Nevox pink/orange or classic green/red) and compact visuals make it fast and reliable with no repainting.
⯁ HOW IT WORKS
Calculates Fast EMA 50, Slow EMA 200, and an always-on EMA 100 (white).
Bias = Fast vs. Slow: Fast > Slow → long regime; Fast < Slow → short regime.
Cross dots appear at confirmed 50/200 crosses (once per bar close).
First Pullback: after a cross, the script arms a window and marks the first return to the chosen EMA (100 or Fast) within ATR × tolerance.
Bar coloring is solid by regime (pink/orange by default, classic green/red when enabled).
No lookahead; signals confirm on bar close.
⯁ KEY FEATURES
• EMA 50/200 with EMA-100 anchor (always visible, white)
• Cross Up/Down dots (style-configurable)
• First Pullback marker (toggle) with ATR tolerance & window
• Solid bias bar coloring (Nevox or classic)
• Optional bias fill between Fast/Slow
• Minimal 1-cell HUD (OFF by default)
• Ready-made alerts with clean prefixes
⯁ SETTINGS (quick)
Visual: Classic colors toggle; Bias Fill (ON); Fill Transparency (85); Bar Color (solid, ON; auto-disabled when Classic is ON).
Core: Source = Close; EMA Fast = 50; EMA Slow = 200.
Pullback: Show marker (ON); Target EMA = EMA 100; Tolerance × ATR = 0.5; Max Bars After Cross = 40; ATR Length = 14.
HUD: Mini HUD OFF; Position selector.
Status Line: OFF by default (optional EMA values).
⯁ ALERTS (built-in)
• Cross Up (Fast above Slow) — confirmed at bar close
• Cross Down (Fast below Slow) — confirmed at bar close
• First Pullback LONG — first return to target after long cross
• First Pullback SHORT — first return to target after short cross
Prefix: EMA and message includes {{ticker}} {{interval}} @ {{close}}.
Suggested: set TradingView alerts to Once Per Bar Close.
⯁ HOW TO USE
• Read trend quickly: 50 above 200 with a rising 100 = healthy long bias.
• Use the First Pullback to time entries after a cross (default target = EMA 100).
• Tune Tolerance × ATR by symbol/TF; 0.3–0.7 is a good start.
• Keep charts clean: bias fill + barcolor ON; switch to Classic for green/red if preferred.
⯁ WHY IT’S DIFFERENT
It preserves the classic 50/200 logic but adds a consistent EMA-100 anchor, a single, one-shot pullback detector, and clean bias bars — all in a lightweight overlay with no repaint tricks.
⯁ DISCLAIMER
Backtest and paper-trade before using live. Not financial advice. Performance depends on market, timeframe, and parameters.

Volume Profile Free Ultra SLI (100 Levels Value Area VWAP) - RRBVolume Profile Free Ultra SLI by RagingRocketBull 2019
Version 1.0
This indicator calculates Volume Profile for a given range and shows it as a histogram consisting of 100 horizontal bars.
This is basically the MAX SLI version with +50 more Pinescript v4 line objects added as levels.
It can also show Point of Control (POC), Developing POC, Value Area/VWAP StdDev High/Low as dynamically moving levels.
Free accounts can't access Standard TradingView Volume Profile, hence this indicator.
There are several versions: Free Pro, Free MAX SLI, Free Ultra SLI, Free History. This is the Free Ultra SLI version. The Differences are listed below:
- Free Pro: 25 levels, +Developing POC, Value Area/VWAP High/Low Levels, Above/Below Area Dimming
- Free MAX SLI: 50 levels, 2x SLI modes for Buy/Sell or even higher res 150 levels
- Free Ultra SLI: 100 levels, packed to the limit, 2x SLI modes for Buy/Sell or even higher res 300 levels
- Free History: auto highest/lowest, historic poc/va levels for each session
Features:
- High-Res Volume Profile with up to 100 levels (line implementation)
- 2x SLI modes for even higher res: 300 levels with 3x vertical SLI, 100 buy/sell levels with 2x horiz SLI
- Calculate Volume Profile on full history
- POC, Developing POC Levels
- Buy/Sell/Total volume modes
- Side Cover
- Value Area, VAH/VAL dynamic levels
- VWAP High/Low dynamic levels with Source, Length, StdDev as params
- Show/Hide all levels
- Dim Non Value Area Zones
- Custom Range with Highlighting
- 3 Anchor points for Volume Profile
- Flip Levels Horizontally
- Adjustable width, offset and spacing of levels
- Custom Color for POC/VA/VWAP levels, Transparency for buy/sell levels
WARNING:
- Compilation Time: 1 min 20 sec
Usage:
- specify max_level/min_level/spacing (required)
- select range (start_bar, range length), confirm with range highlighting
- select volume type: Buy/Sell/Total
- select mode Value Area/VWAP to show corresponding levels
- flip/select anchor point to position the buy/sell levels
- use Horiz Buy/Sell SLI mode with 100 or Vertical SLI with 300 levels if needed
- use POC/Developing POC/VA/VWAP High/Low as S/R levels. Usually daily values from 1-3 days back are used as levels for the current day.
SLI:
use SLI modes to extend the functionality of the indicator:
- Horiz Buy/Sell 2x SLI lets you view 100 Buy/Sell Levels at the same time
- Vertical Max_Vol 3x SLI lets you increase the resolution to 300 levels
- you need at least 2 instances of the indicator attached to the same chart for SLI to work
1) Enable Horiz SLI:
- attach 2 indicator instances to the chart
- make sure all instances have the same min_level/max_level/range/spacing settings
- select volume type for each instance: you can have a buy/sell or buy/total or sell/total SLI. Make sure your buy volume instance is the last attached to be displayed on top of sell/total instances without overlapping.
- set buy_sell_sli_mode to true for indicator instances with volume_type = buy/sell, for type total this is optional.
- this basically tells the script to calculate % lengths based on total volume instead of individual buy/sell volumes and use ext offset for sell levels
- Sell Offset is calculated relative to Buy Offset to stack/extend sell after buy. Buy Offset = Zero - Buy Length. Sell Offset = Buy Offset - Sell Length = Zero - Buy Length - Sell Length
- there are no master/slave instances in this mode, all indicators are equal, poc/va levels are not affected and can work independently, i.e. one instance can show va levels, another - vwap.
2) Enable Vertical SLI:
- attach the first instance and evaluate the full range to roughly determine where is the highest max_vol/poc level i.e. 0..20000, poc is in the bottom half (third, middle etc) or
- add more instances and split the full vertical range between them, i.e. set min_level/max_level of each corresponding instance to 0..10000, 10000..20000 etc
- make sure all instances have the same range/spacing settings
- an instance with a subrange containing the poc level of the full range is now your master instance (bottom half). All other instances are slaves, their levels will be calculated based on the max_vol/poc of the master instance instead of local values
- set show_max_vol_sli to true for the master instance. for slave instances this is optional and can be used to check if master/slave max_vol values match and slave can read the master's value. This simply plots the max_vol value
- you can also attach all instances and set show_max_vol_sli to true in all of them - the instance with the largest max_vol should become the master
Auto/Manual Ext Max_Vol Modes:
- for auto vertical max_vol SLI mode set max_vol_sli_src in all slave instances to the max_vol of the master indicator: "VolumeProfileFree_MAX_RRB: Max Volume for Vertical SLI Mode". It can be tricky with 2+ instances
- in case auto SLI mode doesn't work - assign max_vol_sli_ext in all slave instances the max_vol value of the master indicator manually and repeat on each change
- manual override max_vol_sli_ext has higher priority than auto max_vol_sli_src when both values are assigned, when they are 0 and close respectively - SLI is disabled
- master/slave max_vol values must match on each bar at all times to maintain proper level scale, otherwise slave's levels will look larger than they should relative to the master's levels.
- Max_vol (red) is the last param in the long list of indicator outputs
- the only true max_vol/poc in this SLI mode is the master's max_vol/poc. All poc/va levels in slaves will be irrelevant and are disabled automatically. Slaves can only show VWAP levels.
- VA Levels of the master instance in this SLI mode are calculated based on the subrange, not the whole range and may be inaccurate. Cross check with the full range.
WARNING!
- auto mode max_vol_sli_src is experimental and may not work as expected
- you can only assign auto mode max_vol_sli_src = max_vol once due to some bug with unhandled exception/buffer overflow in Tradingview. Seems that you can clear the value only by removing the indicator instance
- sometimes you may see a "study in error state" error when attempting to set it back to close. Remove indicator/Reload chart and start from scratch
- volume profile may not finish to redraw and freeze in an ugly shape after an UI parameter change when max_vol_sli_src is assigned a max_vol value. Assign it to close - VP should redraw properly, but it may not clear the assigned max_vol value
- you can't seem to be able to assign a proper auto max_vol value to the 3rd slave instance
- 2x Vertical SLI works and tested in both auto/manual, 3x SLI - only manual seems to work (you can have a mixed mode: 2nd instance - auto, 3rd - manual)
Notes:
- This code uses Pinescript v3 compatibility framework
- This code is 20x-30x faster (main for cycle is removed) especially on lower tfs with long history - only 4-5 sec load/redraw time vs 30-60 sec of the old Pro versions
- Instead of repeatedly calculating the total sum of volumes for the whole range on each bar, vol sums are now increased on each bar and passed to the next in the range making it a per range vs per bar calculation that reduces time dramatically
- 100 levels consist of 50 main plot levels and 50 line objects used as alternate levels, differences are:
- line objects are always shown on top of other objects, such as plot levels, zero line and side cover, it's not possible to cover/move them below.
- all line objects have variable lengths, use actual x,y coords and don't need side cover, while all plot levels have a fixed length of 100 bars, use offset and require cover.
- all key properties of line objects, such as x,y coords, color can be modified, objects can be moved/deleted, while this is not possible for static plot levels.
- large width values cause line objects to expand only up/down from center while their length remains the same and stays within the level's start/end points similar to an area style.
- large width values make plot levels expand in all directions (both h/v), beyond level start/end points, sometimes overlapping zero line, making them an inaccurate % length representation, as opposed to line objects/plot levels with area style.
- large width values translate into different widths on screen for line objects and plot levels.
- you can't compensate for this unwanted horiz width expansion of plot levels because width uses its own units, that don't translate into bars/pixels.
- line objects are visible only when num_levels > 50, plot levels are used otherwise
- Since line objects are lines, plot levels also use style line because other style implementations will break the symmetry/spacing between levels.
- if you don't see a volume profile check range settings: min_level/max_level and spacing, set spacing to 0 (or adjust accordingly based on the symbol's precision, i.e. 0.00001)
- you can view either of Buy/Sell/Total volumes, but you can't display Buy/Sell levels at the same time using a single instance (this would 2x reduce the number of levels). Use 2 indicator instances in horiz buy/sell sli mode for that.
- Volume Profile/Value Area are calculated for a given range and updated on each bar. Each level has a fixed length. Offsets control visible level parts. Side Cover hides the invisible parts.
- Custom Color for POC/VA/VWAP levels - UI Style color/transparency can only change shape's color and doesn't affect textcolor, hence this additional option
- Custom Width - UI Style supports only width <= 4, hence this additional option
- POC is visible in both modes. In VWAP mode Developing POC becomes VWAP, VA High and Low => VWAP High and Low correspondingly to minimize the number of plot outputs
- You can't change buy/sell level colors from input (only transparency) - this requires 2x plot outputs => 2x reduces the number of levels to fit the max 64 limit. That's why 2 additional plots are used to dim the non Value Area zones
- You can change level transparency of line objects. Due to Pinescript limitations, only discrete values are supported.
- Inverse transp correlation creates the necessary illusion of "covered" line objects, although they are shown on top of the cover all the time
- If custom lines_transp is set the illusion will break because transp range can't be skewed easily (i.e. transp 0..100 is always mapped to 100..0 and can't be mapped to 50..0)
- transparency can applied to lines dynamically but nva top zone can't be completely removed because plot/mixed type of levels are still used when num_levels < 50 and require cover
- transparency can't be applied to plot levels dynamically from script this can be done only once from UI, and you can't change plot color for the past length bars
- All buy/sell volume lengths are calculated as % of a fixed base width = 100 bars (100%). You can't set show_last from input to change it
- Range selection/Anchoring is not accurate on charts with time gaps since you can only anchor from a point in the future and measure distance in time periods, not actual bars, and there's no way of knowing the number of future gaps in advance.
- Adjust Width for Log Scale mode now also works on high precision charts with small prices (i.e. 0.00001)
- in Adjust Width for Log Scale mode Level1 width extremes can be capped using max deviation (when level1 = 0, shift = 0 width becomes infinite)
- There's no such thing as buy/sell volume, there's just volume, but for the purposes of the Volume Profile method, assume: bull candle = buy volume, bear candle = sell volume
P.S. I am your grandfather, Luke! Now, join the Dark Side in your father's steps or be destroyed! Once more the Sith will rule the Galaxy, and we shall have peace...

50/100 EMA Crossover with Candle Confirmation📘 **50/100 EMA Crossover with Candle Confirmation – Strategy Description**
The **50/100 EMA Crossover with Candle Confirmation** is a trend-following strategy designed to filter high-probability entries by combining exponential moving average (EMA) crossovers with strong price action confirmation. This strategy aims to reduce false signals commonly associated with EMA-only systems by requiring a **candle close confirmation in the direction of the trend**, making it more reliable for intraday or swing trading across Forex, crypto, and stock markets.
---
### 🔍 **Core Logic**
* The strategy is based on the interaction of the **50 EMA** (fast-moving average) and the **100 EMA** (slow-moving average).
* **Trend direction** is determined by the crossover:
* **Bullish Trend**: When the 50 EMA crosses **above** the 100 EMA.
* **Bearish Trend**: When the 50 EMA crosses **below** the 100 EMA.
* To **filter out false breakouts**, a **candle confirmation** is used:
* For a **Buy signal**: After a bullish crossover, wait for a strong bullish candle (e.g., full-body green candle) to **close above both EMAs**.
* For a **Sell signal**: After a bearish crossover, wait for a strong bearish candle to **close below both EMAs**.
---
### ✅ **Entry Conditions**
**Buy Entry:**
* 50 EMA crosses above 100 EMA.
* Latest candle closes **above both EMAs**.
* Candle must be bullish (green/full body preferred).
**Sell Entry:**
* 50 EMA crosses below 100 EMA.
* Latest candle closes **below both EMAs**.
* Candle must be bearish (red/full body preferred).
---
### 🛑 **Exit or Take-Profit Options**
* **Fixed TP/SL**: 1:2 or 1:3 risk-reward.
* **Trailing Stop**: Based on recent swing highs/lows or ATR.
* **EMA Exit**: Exit trade when the candle closes on the opposite side of 50 EMA.
---
### ⚙️ **Best Settings**
* **Timeframes**: 5M, 15M, 1H, 4H (works well on most).
* **Markets**: Forex, Crypto (e.g., BTC/ETH), Indices (e.g., NASDAQ, NIFTY50).
* **Recommended filters**:
* Use with RSI divergence or volume confirmation.
* Avoid using during high-impact news (especially on lower timeframes).
---
### 🧠 **Why This Works**
The 50/100 EMA crossover provides a **medium-term trend signal**, reducing noise seen in fast EMAs (like 9 or 21). The candle confirmation adds a **momentum filter**, ensuring price supports the directional bias. This makes it suitable for traders who want a balance of trend and entry precision without overcomplicating with too many indicators.
---
### 📈 **Advantages**
* Simple yet effective for identifying trends.
* Filters out fakeouts using candle confirmation.
* Easy to automate in Pine Script or other trading bots.
* Can be combined with support/resistance or SMC zones for better confluence.
---
### ⚠️ **Limitations**
* May lag slightly in ranging markets.
* Late entries possible due to confirmation candle.
* Works best with additional volume or volatility filter.

EMA Ribbon with 100 MA BY TIJUThe EMA Ribbon with 100 MA is a powerful and visually intuitive indicator designed to help traders identify trends, momentum, and potential support/resistance levels using multiple Exponential Moving Averages (EMAs). By plotting a series of EMAs with varying periods, the script creates a "ribbon" effect on the chart, making it easier to spot trend direction and strength at a glance.
Key Features:
Multiple EMAs for Trend Analysis:
The script plots 8 EMAs with periods ranging from 20 to 55, creating a gradient ribbon effect.
The 100-period EMA is added as a thick blue line, acting as a key level for long-term trend analysis.
Customizable Periods:
Each EMA period is fully customizable, allowing traders to tailor the indicator to their preferred trading style and timeframe.
Visual Clarity:
The EMAs are color-coded, making it easy to distinguish between different periods and identify the overall trend direction.
Dynamic Support/Resistance:
The EMAs act as dynamic support and resistance levels, helping traders identify potential entry and exit points.
Drop Candles Feature:
The script includes an option to drop the first N candles, ensuring cleaner calculations and avoiding false signals during the initial periods.
How to Use:
Trend Identification:
Uptrend: When the shorter-period EMAs are stacked above the longer-period EMAs, it indicates a strong uptrend.
Downtrend: When the longer-period EMAs are stacked above the shorter-period EMAs, it indicates a strong downtrend.
Consolidation: When the EMAs are intertwined, it suggests a sideways or weak trend.
Support/Resistance Levels:
Use the EMAs as dynamic support/resistance levels. For example, in an uptrend, the price may bounce off the lower EMAs.
100-Period EMA:
The 100-period EMA (thick blue line) acts as a key level for long-term trend analysis. A price above this line suggests a bullish bias, while a price below suggests a bearish bias.
Customization:
Adjust the EMA periods and colors to suit your trading strategy.
Use the Drop first N candles option to avoid false signals during the initial periods.
Example Use Cases:
Trend Following:
Enter long positions when the price is above the EMA ribbon and the EMAs are stacked in an uptrend.
Enter short positions when the price is below the EMA ribbon and the EMAs are stacked in a downtrend.
Dynamic Support/Resistance:
Use the EMAs as dynamic support/resistance levels for setting stop-loss or take-profit targets.
Confirmation Tool:
Combine the EMA Ribbon with other indicators (e.g., RSI, MACD) to confirm trade signals.
Settings:
MA-1 to MA-8 Periods: Adjust the periods for the 8 EMAs (default: 20, 25, 30, 35, 40, 45, 50, 55).
MA-100 Period: Adjust the period for the 100 EMA (default: 100).
Source: Choose the price source for the EMAs (default: Close).
Drop First N Candles: Drop the first N candles to avoid false signals (default: 1).
Why Use EMA Ribbon ?
Versatility: Suitable for all trading styles (scalping, day trading, swing trading) and timeframes.
Visual Appeal: The color-coded ribbon makes it easy to interpret the trend at a glance.
Customizable: Tailor the indicator to your specific trading strategy.
Dynamic Levels: Use the EMAs as dynamic support/resistance levels for better risk management.

S&P 100 Option Expiration Week StrategyThe Option Expiration Week Strategy aims to capitalize on increased volatility and trading volume that often occur during the week leading up to the expiration of options on stocks in the S&P 100 index. This period, known as the option expiration week, culminates on the third Friday of each month when stock options typically expire in the U.S. During this week, investors in this strategy take a long position in S&P 100 stocks or an equivalent ETF from the Monday preceding the third Friday, holding until Friday. The strategy capitalizes on potential upward price pressures caused by increased option-related trading activity, rebalancing, and hedging practices.
The phenomenon leveraged by this strategy is well-documented in finance literature. Studies demonstrate that options expiration dates have a significant impact on stock returns, trading volume, and volatility. This effect is driven by various market dynamics, including portfolio rebalancing, delta hedging by option market makers, and the unwinding of positions by institutional investors (Stoll & Whaley, 1987; Ni, Pearson, & Poteshman, 2005). These market activities intensify near option expiration, causing price adjustments that may create short-term profitable opportunities for those aware of these patterns (Roll, Schwartz, & Subrahmanyam, 2009).
The paper by Johnson and So (2013), Returns and Option Activity over the Option-Expiration Week for S&P 100 Stocks, provides empirical evidence supporting this strategy. The study analyzes the impact of option expiration on S&P 100 stocks, showing that these stocks tend to exhibit abnormal returns and increased volume during the expiration week. The authors attribute these patterns to intensified option trading activity, where demand for hedging and arbitrage around options expiration causes temporary price adjustments.
Scientific Explanation
Research has found that option expiration weeks are marked by predictable increases in stock returns and volatility, largely due to the role of options market makers and institutional investors. Option market makers often use delta hedging to manage exposure, which requires frequent buying or selling of the underlying stock to maintain a hedged position. As expiration approaches, their activity can amplify price fluctuations. Additionally, institutional investors often roll over or unwind positions during expiration weeks, creating further demand for underlying stocks (Stoll & Whaley, 1987). This increased demand around expiration week typically leads to temporary stock price increases, offering profitable opportunities for short-term strategies.
Key Research and Bibliography
Johnson, T. C., & So, E. C. (2013). Returns and Option Activity over the Option-Expiration Week for S&P 100 Stocks. Journal of Banking and Finance, 37(11), 4226-4240.
This study specifically examines the S&P 100 stocks and demonstrates that option expiration weeks are associated with abnormal returns and trading volume due to increased activity in the options market.
Stoll, H. R., & Whaley, R. E. (1987). Program Trading and Expiration-Day Effects. Financial Analysts Journal, 43(2), 16-28.
Stoll and Whaley analyze how program trading and portfolio insurance strategies around expiration days impact stock prices, leading to temporary volatility and increased trading volume.
Ni, S. X., Pearson, N. D., & Poteshman, A. M. (2005). Stock Price Clustering on Option Expiration Dates. Journal of Financial Economics, 78(1), 49-87.
This paper investigates how option expiration dates affect stock price clustering and volume, driven by delta hedging and other option-related trading activities.
Roll, R., Schwartz, E., & Subrahmanyam, A. (2009). Options Trading Activity and Firm Valuation. Journal of Financial Markets, 12(3), 519-534.
The authors explore how options trading activity influences firm valuation, finding that higher options volume around expiration dates can lead to temporary price movements in underlying stocks.
Cao, C., & Wei, J. (2010). Option Market Liquidity and Stock Return Volatility. Journal of Financial and Quantitative Analysis, 45(2), 481-507.
This study examines the relationship between options market liquidity and stock return volatility, finding that increased liquidity needs during expiration weeks can heighten volatility, impacting stock returns.
Summary
The Option Expiration Week Strategy utilizes well-researched financial market phenomena related to option expiration. By positioning long in S&P 100 stocks or ETFs during this period, traders can potentially capture abnormal returns driven by option market dynamics. The literature suggests that options-related activities—such as delta hedging, position rollovers, and portfolio adjustments—intensify demand for underlying assets, creating short-term profit opportunities around these key dates.

EMA Regime (9/20/50/100/200) — Stacked with 200 FilterEMA Regime (9/20/50/100/200) — Stacked Long/Short Box
Plots the 9, 20, 50, 100, and 200 EMAs on the chart.
Checks if price is above or below each EMA and whether the EMAs are stacked in order.
LONG signal: price above all selected EMAs and EMAs stacked 9 > 20 > 50 > 100 >(> 200 if strict mode on).
SHORT signal: price below all selected EMAs and EMAs stacked 9 < 20 < 50 < 100 (< 200 if strict mode on).
Shows a two-row table (LONGS / SHORTS) so you can quickly see which EMAs are aligned.
Optionally colors candles green/red when a full long/short regime is active.
Can show labels when a new LONG or SHORT condition appears.
Has alerts you can use for automated notifications when the regime flips.
“Use 200 EMA in the stack” lets you choose ultra-strict mode (9>20>50>100>200) or lighter mode (9>20>50>100 but price & 9 above 200).

Volume Index (0-100)Volume Index (0-100) Indicator
The Volume Index (0-100) indicator is a powerful tool designed to help traders understand current volume levels in relation to past activity over a specified period. By normalizing volume data to a scale from 0 to 100, this indicator makes it easy to compare today's volume against recent history and gauge the strength of market movements.
Key Features:
Normalized Volume Index: The indicator indexes volume between 0 and 100, allowing traders to easily determine if the current volume is unusually high or low compared to recent trends.
Colored Visualization: The line graph is colored green for positive volume (increasing activity) and red for negative volume (decreasing activity). This helps traders quickly grasp the market sentiment and volume direction.
User-Defined Lookback Period: Traders can customize the lookback period to best fit their trading strategy, providing flexibility for different market conditions.
How Traders Can Use It:
Identifying Volume Extremes: The Volume Index helps identify periods of unusually high or low volume. Values approaching 100 indicate high volume, while values close to 0 indicate low volume.
Confirmation Tool: During price movements, high volume (near 100) can act as a confirmation signal for the strength of the trend. For instance, a high volume during an uptrend may indicate strong buying interest.
Divergence Analysis: Traders can look for divergences between volume and price. For example, if the price is consolidating while the Volume Index remains high, it could signal an impending breakout.
Volume Alerts: The indicator includes an alert feature when the Volume Index exceeds 80, helping traders stay informed about potential shifts in market volatility.
NASDAQ 100 Peak Hours StrategyNASDAQ 100 Peak Hours Trading Strategy
Description
Our NASDAQ 100 Peak Hours Trading Strategy leverages a carefully designed algorithm to trade within specific hours of high market activity, particularly focusing on the first two hours of the trading session from 09:30 AM to 11:30 AM GMT-5. This period is identified for its increased volatility and liquidity, offering numerous trading opportunities.
The strategy incorporates a blend of technical indicators to identify entry and exit points for both long and short positions. These indicators include:
Exponential Moving Averages (EMAs) : A short-term 9-period EMA and a longer-term 21-period EMA to determine the market trend and momentum.
Relative Strength Index (RSI) : A 14-period RSI to gauge the market's momentum.
Average True Range (ATR) : A 14-period ATR to assess market volatility and to set dynamic stop losses and trailing stops.
Volume Weighted Average Price (VWAP) : To identify the market's average price weighted by volume, serving as a benchmark for the trading day.
Our strategy uniquely applies a volatility filter using the ATR, ensuring trades are only executed in conditions that favor our setup. Additionally, we consider the direction of the EMAs to confirm the market's trend before entering trades.
Originality and Usefulness
This strategy stands out by combining these indicators within the NASDAQ 100's peak hours, exploiting the specific market conditions that prevail during these times. The inclusion of a volatility filter and dynamic stop-loss mechanisms based on the ATR provides a robust method for managing risk.
By focusing on the early trading hours, the strategy aims to capture the initial market movements driven by overnight news and the opening rush, often characterized by higher volatility. This approach is particularly useful for traders looking to maximize gains from short-term fluctuations while limiting exposure to longer-term market uncertainty.
Strategy Results
To ensure the strategy's effectiveness and reliability, it has undergone rigorous backtesting over a significant dataset to produce a sample size of more than 100 trades. This testing phase helps in identifying the strategy's potential in various market conditions, its consistency, and its risk-to-reward ratio.
Our backtesting adheres to realistic trading conditions, accounting for slippage and commission to reflect actual trading scenarios accurately. The strategy is designed with a conservative approach to risk management, advising not to risk more than 5-10% of equity on a single trade. The default settings in the script align with these principles, ensuring that users can replicate our tested conditions.
Using the Strategy
The strategy is designed for simplicity and ease of use:
Trade Hours : Focuses on 09:30 AM to 11:30 AM GMT-5, during the NASDAQ 100's peak activity hours.
Entry Conditions : Trades are initiated based on the alignment of EMAs, RSI, VWAP, and the ATR's volatility filter within the designated time frame.
Exit Conditions : Includes dynamic trailing stops based on ATR, a predefined time exit strategy, and a trend reversal exit condition for risk management.
This script is a powerful tool for traders looking to leverage the NASDAQ 100's peak hours, providing a structured approach to navigating the early market hours with a robust set of criteria for making informed trading decisions.

Contrarian 100 MAPairs nicely with Enhanced-Stock-Ticker-with-50MA-vs-200MA located here:
Description
The Contrarian 100 MA is a sophisticated Pine Script v6 indicator designed for traders seeking to identify key market structure shifts and trend reversals using a combination of a 100-period Simple Moving Average (SMA) envelope and Inner Circle Trader (ICT) Break of Structure (BoS) and Market Structure Shift (MSS) logic. By overlaying a semi-transparent SMA-based shadow on the price chart and plotting bullish and bearish structure signals, this indicator helps traders visualize critical price levels and potential trend changes. It leverages higher timeframe (HTF) pivot points and dynamic logic to adapt to various chart timeframes, making it ideal for swing and contrarian trading strategies. Customizable colors, timeframes, and alert conditions enhance its versatility for manual and automated trading setups.
Key Features
SMA Envelope: Plots a 100-period SMA for high and low prices, creating a semi-transparent (50% opacity) purple shadow to highlight the price range and provide context for price movements.
ICT BoS/MSS Logic: Identifies Break of Structure (BoS) and Market Structure Shift (MSS) signals for both bullish and bearish conditions, based on HTF pivot points.
Dynamic Timeframe Support: Adjusts pivot detection based on user-selected HTF (default: 1D) and chart timeframe (1M, 5M, 15M, 30M, 1H, 4H, 1D), ensuring adaptability across markets.
Visual Signals: Draws dotted lines for BoS (bullish/bearish) and MSS (bullish/bearish) signals at pivot levels, with customizable colors for easy identification.
Contrarian Approach: Signals potential reversals by combining SMA context with ICT structure breaks, ideal for traders looking to capitalize on trend shifts.
Alert Conditions: Supports alerts for bullish/bearish BoS and MSS signals, enabling integration with TradingView’s alert system for automated trading.
Performance Optimization: Uses efficient pivot detection and line management to minimize resource usage while maintaining accuracy.
Technical Details
SMA Calculation:
Computes 100-period SMAs for high (smaHigh) and low (smaLow) prices.
Plots invisible SMAs (fully transparent) and fills the area between them with 50% transparent purple for visual context.
Pivot Detection:
Uses ta.pivothigh and ta.pivotlow to identify HTF swing points, with dynamic lookback periods (rlBars: 5 for daily, 2 for intraday).
Tracks pivot highs (pH, nPh) and lows (pL, nPl) using a custom piv type for price and time.
BoS/MSS Logic:
Bullish BoS: Triggered when price breaks above a pivot high in a bullish trend, drawing a line at the pivot level.
Bearish BoS: Triggered when price breaks below a pivot low in a bearish trend.
Bullish MSS: Occurs when price breaks a pivot high in a bearish trend, signaling a potential trend reversal.
Bearish MSS: Occurs when price breaks a pivot low in a bullish trend.
Lines are drawn using line.new with xloc.bar_time for precise alignment, styled as dotted with customizable colors.
HTF Integration: Fetches HTF close prices and pivot data using request.security with lookahead_on for accurate signal timing.
Line Management: Maintains an array of lines (lin), removing outdated lines when new MSS signals occur to keep the chart clean.
Pivot Reset: Clears broken pivots (e.g., when price exceeds a pivot high or falls below a pivot low) to ensure fresh signal generation.
How to Use
Add to Chart:
Copy the script into TradingView’s Pine Editor and apply it to your chart.
Configure Settings:
SMA Length: Adjust the SMA period (default: 100 bars) to suit your trading style.
Structure Timeframe: Set the HTF for pivot detection (default: 1D).
Chart Timeframe: Select the chart timeframe (1M, 5M, 15M, 30M, 1H, 4H, 1D) to adjust pivot sensitivity.
Colors: Customize bullish/bearish BoS and MSS line colors via input settings.
Interpret Signals:
Bullish BoS: White dotted line (default) at a broken pivot high in a bullish trend, indicating trend continuation.
Bearish BoS: White dotted line at a broken pivot low in a bearish trend.
Bullish MSS: White dotted line at a broken pivot high in a bearish trend, suggesting a reversal to bullish.
Bearish MSS: White dotted line at a broken pivot low in a bullish trend, suggesting a reversal to bearish.
Use the SMA shadow to gauge price position within the recent range.
Set Alerts:
Create alerts for bullish/bearish BoS and MSS signals using TradingView’s alert system.
Customize Visuals:
Adjust line colors or SMA fill transparency via TradingView’s settings for better visibility.
Example Use Cases
Swing Trading: Use MSS signals to enter trades at potential trend reversals, with the SMA envelope confirming price extremes.
Contrarian Trading: Capitalize on BoS and MSS signals to trade against prevailing trends, using the SMA shadow for context.
Automated Trading: Integrate BoS/MSS alerts with trading bots for systematic entries and exits.
Multi-Timeframe Analysis: Combine HTF signals (e.g., 1D) with lower timeframe charts (e.g., 1H) for precise entries.
Notes
Testing: Backtest the indicator on your chosen market and timeframe to validate performance.
Compatibility: Built for Pine Script v6 and tested on TradingView as of June 19, 2025.
Limitations: Signals rely on HTF pivot accuracy, which may lag in fast-moving markets. Adjust rlBars or timeframe for sensitivity.
Optional Enhancements: Consider uncommenting or adding a histogram for SMA divergence (e.g., smaHigh - smaLow) for additional insights.
Acknowledgments
This indicator combines ICT’s market structure concepts with a dynamic SMA envelope to provide a unique contrarian trading tool. Share your feedback or suggestions in the TradingView comments, and happy trading!

Distance between EMA 50-100/100-150This script calculates and plots the percentage difference between the 50-period, 100-period, and 150-period Exponential Moving Averages (EMA) on a TradingView chart. The aim is to provide a clear visual representation of the market's momentum by analyzing the distance between key EMAs over time.
Key features of this script:
1. EMA Calculation : The script computes the EMA values for 50, 100, and 150 periods and calculates the percentage difference between EMA 50 and 100, and between EMA 100 and 150.
2. Custom Threshold : Users can adjust a threshold percentage to highlight significant divergences between the EMAs. A default threshold is set to 0.1%.
3. Visual Alerts : When the percentage difference exceeds the threshold, a visual marker appears on the chart:
Green Circles for bullish momentum (positive divergence),
Red Circles for bearish momentum (negative divergence),
Diamonds to indicate the first occurrence of new bullish or bearish signals, allowing users to catch fresh market trends.
4. Dynamic Plotting : The script plots two lines representing the percentage difference for each EMA pair, offering a quick and intuitive way to monitor trends.
Ideal for traders looking to gauge market direction using the relationship between multiple EMAs, this script simplifies analysis by focusing on key moving average interactions.

Bitcoin 100 Pips Indicator 5Bitcoin 100 Pips Indicator
Description: The Bitcoin 100 Pips Indicator is a powerful tool designed for traders who seek to capitalize on rapid price movements in the Bitcoin market. This indicator provides clear entry and exit signals based on a combination of price action analysis and pre-defined profit targets.
Key Features:
Quick Entry and Exit Signals: The indicator generates buy and sell signals in real-time, allowing traders to enter and exit positions quickly and effectively.
Targeting 100 Pips: Specifically designed to target 100 pips of profit for each trade, this indicator sets clear take profit and stop loss levels, helping traders manage their risk and reward effectively.
User-Friendly Interface: With easily visible signals and annotations directly on the chart, the indicator enhances your trading experience without cluttering your view.
Adjustable Settings: Traders can customize the pip target and stop loss levels according to their individual strategies, providing flexibility to accommodate different trading styles.
Ideal for Short-Term Trading: Whether you are a scalper or a day trader, this indicator is optimized for M5 and M15 timeframes, making it ideal for capturing quick price movements in the volatile Bitcoin market.
How to Use:
Apply the Bitcoin 100 Pips Indicator to your chart and select your preferred trading timeframe (M5 or M15).
Look for buy signals indicated by green labels when market conditions favor upward movement.
Conversely, watch for sell signals marked by red labels during downward trends.
Use the provided take profit and stop loss levels to manage your trades effectively.
Disclaimer: This indicator is for informational purposes only and does not guarantee profits. Always practice proper risk management and conduct your own analysis before trading.

Nasdaq 100 ScreenerNasdaq 100 screener is comprehensive table displaying the following parameters :
Op = Open Price of the Day.
LaP = Last Price.
O-L = Open Price of the Day - Last Price.
ROC = Rate of Change .
SMA20 = Simple Moving Average 20 period.
S20d = Last Price - SMA 20.
SMA50 = Simple Moving Average 50 period.
S50d = Last Price - SMA 50.
SMA200 = Simple Moving Average 200 period.
S200d = Last Price - SMA 200.
ADX(14) = Average Directional Index.
RSI(14) = Relative Strength Index.
CCI(20) = Commodity Channel Index.
ATR(14) = Average True Range.
MOM(10) = Momentum.
AcDis(K) = Accumulation/Distribution.
CMF(20) = Chaikin Money Flow.
MACD = Moving Average Convergence Divergence.
Sig = MACD signal.
Nasdaq 100 stocks are divided into following alphabetical grouping for input access purpose under “Options” in “Settings” menu.
A to B 21 stocks “Input symbols” are listed under the “Options” in “Input A to B”
C to E 18 stocks “Input symbols” are listed under the head “Options” in “Input C to E”
F to L 19 stocks “Input symbols” are listed under the head “Options” in “Input F to L”
M to P 22 stocks “Input symbols” are listed under the head “Options” in “Input M to P”
R to Z 20 stocks “Input symbols” are listed under the head “Options” in “Input R to Z”
A to Z 100 stocks “Input symbols” are listed under the head “Options” in “Input A to Z”
User after visiting the “Settings” menu simply is required to select the “input symbol” from the stock listed under respective alphabetical Input lists to which the particular stock belongs. The resultant data is tabulated under respective row in Table .At a time User can see 5 different stocks i.e one each in different alphabetical lists in respective alphabetical order rows stated in the Table. User can scroll in each list to access and shift to any other stock in the list. In addition a Master list of all 100 stocks is given under “ Input A to Z “ at the last row of table.
Nasdaq 100 screener is a simple table , which facilitate to view 6 different stocks at a time (inclusive one from Master list of “Input A to Z” with a display of 19 parameters.

EMA SMA 100 CrossThis script utilizes the 100 EMA and the 100 SMA with printing labels for "Buy", "Short", and "Take Profit".
Essentially this indicator will print a "Buy" label when the 100 EMA(green line) is above the 100 SMA(red line) and "Take Profit" at the pivot points.
NOTE: There will be instances where the labels print based on coded criteria but will be false compared to trend. This is because the 100 EMA and SMA crosses can be short periods and reversals can happen frequently. This indicator should be used in conjunction with other indicators to help build a case for potential long or short entries.
