Combine & Merge Candlesticks + EMACombine & Merge Candlesticks with EMA
You can do the following:-
1 min - look back 5 (5 min) up to 15 (15 min)
5 min - look back 3 (15 min) up to 12 (1 hour)
15 min - look back 4 (1 hour) up to 16 ( 4 hours)
1 hour - look back 4 (4 hours) up to 8 (8 hours - 1 trading session)
4 hour - look back 2 (8 hours - 1 trading session) up to 6 ( 1 Day)
1 day - look back 5 ( 1 week)
"跨境通12月4日地天板" için komut dosyalarını ara

MTF MACD (PPO) [TANHEF]Mult-Timeframe Moving Average Convergence Divergence (MACD) and Percentage Price Oscillator (PPO) indicator that allows for viewing of 1 to 5 different Timeframes.
Brief Summary
The primary benefit of multi-timeframe indicators is getting better entries and confirmation from viewing multiple time frames at once, which can often get overlooked.
MACD shouldn't be only used by itself, it is a lot more consistent when applied in the same direction as the trend as well as multiple other things including support, resistance, and volume improve the outcomes of the MACD results.
Personally, I look for good entries on higher and lower time frames (multiple timeframes must agree with the buying or selling). For example, if a higher timeframe looks like a good long entry (MACD line is crossing up and below the zero line), then the lower timeframes should be checked to ensure they are not oversold or overextended (the MACD line must be low or below the zero), once the lower and higher timeframes are in agreeance an entry can be made.
What is Moving Average Convergence Divergence (MACD)?
Moving average convergence divergence (MACD) is a trend-following momentum indicator that shows the relationship between two moving averages of the price. The MACD is calculated by subtracting the 26-period exponential moving average (EMA) from the 12-period EMA.
What is the Percentage Price Oscillator (PPO)?
The PPO is identical to the MACD indicator, except the PPO measures percentage difference between two EMAs, while the MACD measures absolute (or dollar) difference. The PPO has the advantage of being comparable to other assets with different prices, whereas MACD readings are not comparable. For example, regardless of the asset's price, a PPO result of 10 means the short-term average is 10% above the long-term average.
A signal line can be displayed on Timeframe, including:
- MACD & Signal Line crosses (Green when MACD above Signal Line and Red when MACD below Signal Line)
- Histogram Direction (fast and slow EMA gap)
- SuperTrend for identifying trend direction (green for uptrend, red for downtrend)
- EMA Trend for identifying trend direction (above EMA = up trend and green, below EMA = down trend and red)
Cross Dots and Potential cross dots
- Green Dot, is displayed when the MACD crosses the Signal Line
- Red Dot, is displayed when the MACD crosses the Signal Line
- Yellow Dot. Potential cross up (green dot) on next bar. Displayed when if the same distance a MACD moves on a bar is applied to the next bar will cause a MACD and Signal Line Cross. This is calculated by checking if the value change of one bar is added to the current MACD value would lead to a cross on the next bar, the it is a potential up dot.
- Purple Dot. Potential cross down (red dot) on next bar. Displayed when if the same distance a MACD moves on a bar is applied to the next bar will cause a MACD and Signal Line Cross. This is calculated by checking if the value change of one bar is added to the current MACD value would lead to a cross on the next bar, the it is a potential down dot.
Best Fit Settings
- Can be applied to the MACD, Signal Line, and Histogram to re-scale (stretch) to fit them within the space of the +2 and -2 range that each timeframe is provided on this indicator.
- The lookback distance value is used to lookback a certain distance to ensure everything scaled to fit well.
Labels are displayed on the right of the indicators, including:
- a label identifying 'line indicator' is currently being displayed
- the Timeframe corresponding to each MACD or PPO indicator
- the MACD or PPO of each Timeframe

BTC buy/sell effectivenessDescribing how much bitcoin price moves due to active buy/sell orders, using price data from BINANCE:BTCUSDT but summing up the volume data from BINANCE:BTCUSDT, COINBASE:BTCUSD, BITHUMB:BTCKRW, BITFLYER:BTCJPY, KRAKEN:BTCEUR, FTX:BTCUSD, BITSTAMP:BTCUSD, BITFINEX:BTCUSD. The script is based on another script in the following
The recommended setting is 1m resolution with 1H time frame, EMA lengths 12 and 18. The upper and lower dashed lines show regions of high and low volatility of price.

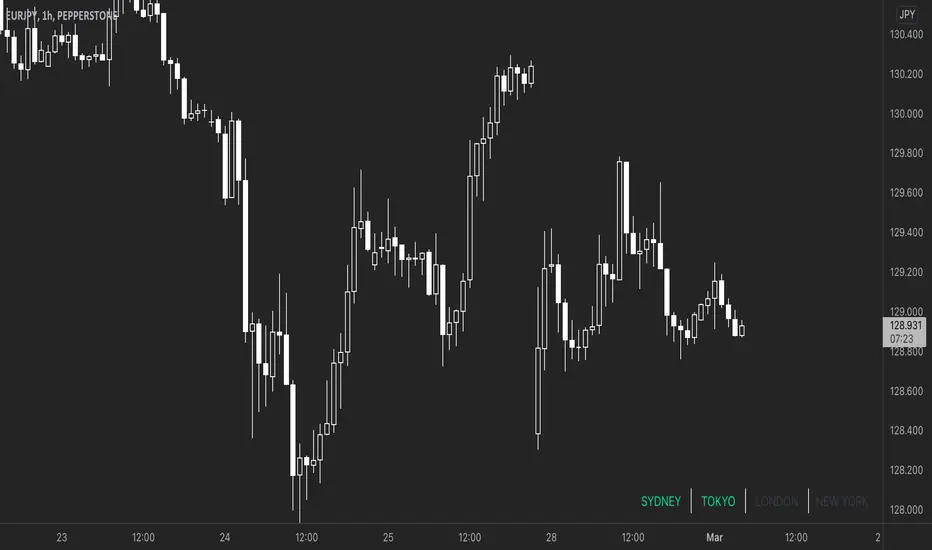
Simple FX Market Hours█ OVERVIEW
A simple market session indicator that show you what market is in session according to the timezone you configured. It will draw a table with 4 cells matching 4 market Sydney, Tokyo, London and New York. Whenever market is in session the matching text will change colour.
█ WHAT MAKE THIS DIFFERENT
All other indicator on the market are either bar colouring, background colouring, or some sort of box drawing on the chart which is very messy and cluttered your chart. This indicator is as simple as it gets. The label are positions by default at the top right corner (you can change this in the config). It doesn’t draw anything on your chart so you can get right into your price action without anything blocking you.
Also, these type of indicator on the market are not auto converting the market session time to your your configured timezone, you will have to manually entered in the market session hours in your local time. This indicator does! Or perhaps I didn’t look hard enough. Either way I think there aren’t any indicator that are this simple.
█ HOW IT WORKS
I’m using table function (available to pinescript version 4 and above) to position the market labels and change colour of them according to if the market is in session or not.
For timezone, I have predefined all the market hours in all of the timezone from GMT-12 to GMT+12. When you select your timezone it will convert it to the symbol’s exchange timezone. Feel free to update the timezone if I had it incorrectly.
This script doesn’t take into account the DST because DST doesn’t starts or ends on a fixed date.
I also put in a check for symbol type using: syminfo.type == "forex”. So that it will only display if you are on forex pairs. You don’t need to hide it while you are looking at crypto or other assets. For convenience purposes.
█ NOTES
If you like the script be sure to press the like button it will help shows other people that this is useful. Thank you very much!
Igor Sessions Average Candle RangeCalculated Average Candle Range for Igor Sessions. Resets average at these time UTC: 00:00, 06:00, 12:00, 20:00.

CA - Indicators ColorsThe following indicator help to have an idea of the current state of the MACD and FullStochastic in 1 hour and 1 day. If you are a trader that is regularly using stochastics and macd indicator and don't have enough space in you screen this might help to increase the space in your screen.
Parameters used on MACD: 12, 26,9
Parameters used on Stochastics: 14,5,5
The whole idea of the indicator is if you see an entry for a long position, you can confirm that a higher timeframe its aligned by both indicators and if you are seeing an entry for a short position you can confirm with a higher timeframe.
This indicator doesn't provide an entry or exit signal, but lets you verify where is the trend going in those timeframes so it helps you decide to make the trade.
Stochastic
Green: going up
Red: going down
Macd
Green: going up
Light Green: previous was green and going down.
Red: going down
Light Red: previous was red and going up
Keep in mind, the colors are going to get updated as long as the market is active.
Any feedback its appreciated.

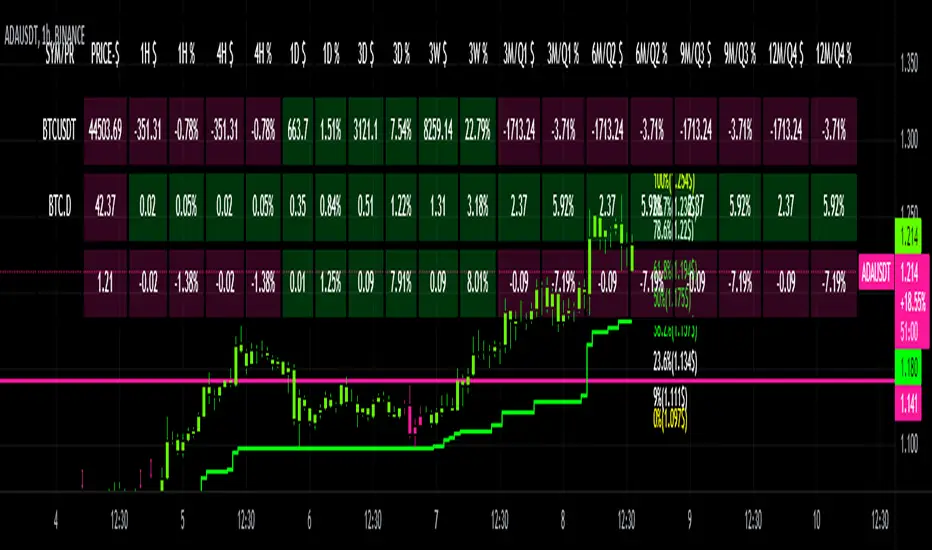
CRYPTO DASHBOARD Gs₿A Simple Crypto Dashboard/Screener which indicates the Price and percentage changes for the Given Period of time i.e for 1 Hr ,4 Hrs, 1 Day, 3 Days, 3 Weeks and 3 - 12 Months. By Default it displays #BTC and its Dominance and current trading pair Price and % changes.
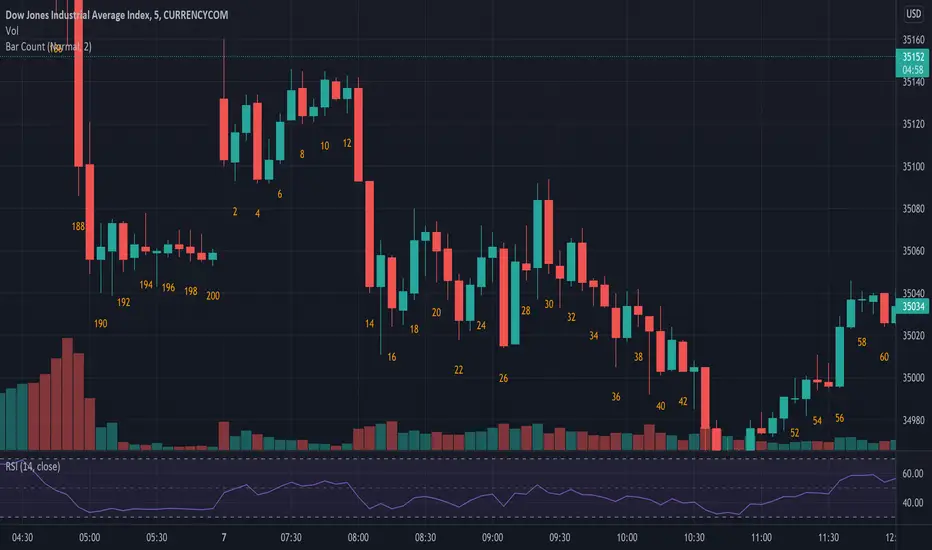
Bar CountBar Count Indicator for TradingView. It will label bars with numbers underneath which is awesome when sharing analysis or waiting for bars 7 (50% chance), 12 (70% chance), and 18 (90% chance) looking for higher probability for the High or Low of the day to have formed.
CHOPORSI
CHOPORSI is a multiindicator.
This indicator help You to recognize potential in or out singal.
Base singals are from Choppines, RSI, AND DMI indicators.
It is a combination of 3 separate indicators like choppines RSI and DMI.
Then our new indicator see like bellow on next image.
Yellow line is sum of CHOP index and RSI , in this case we can say its a CHOPORSI Index.
Green line is DMI- line , this show us strength of sell position on the market.
We schould use other signals, like LSMA 50/100 to improve trend changing. Like on next picture.
Now how this indicator works?
Yellow line is the sum oF Chop and RSI value - 50.
Max and minimum value of CHOP and RSI are the same from 0 to 100.
We have sum of them.
Our minimum signal is 0+0-50=-50
maximum signal is 100+100-50= 150
Most times if both of tem are on top level ( then we have 150) the trend is chanhing from bullish to bearish.
The same way if the RSI ist on 0 and chop is over 50 ( then we have index 0 ) wee changing the tren from bearish to bullish.
Off course it not every time. We see other signals, to take our risk self not sugested by some art of indicators.
But if we are abowe topline, witch is set to 85 we can sey, we have have oversold signal.
Underline 30 isour potentialy buy signal.
Midrange 50 is mostly trand changin line.
This valu of top, mid bottom line you can change on the setting.
Every Coin have another level of this lines, and need to be checked individual to the coin.
Standard, settings are set fo timeframe : 12 min. 24 min, 1H and 4 H >
Blue crosses signalize possibilities trend changing.
This picture shou us how this indicator works.
Buy long signal : If yellow line is mostly at the bottom and green mostly on the top.
Sell long signal l. Yellow -top , green -bottom.
The Green line is from Directional Movement Index and is - DI line. Its show us selling trend. even higher position then mor sell of .
Standard value of CHOPPINES is 14 , works fin on 1H and abowe also wit the value of 28
Standard value for RSI AND -DI unchanging 14.
I tjink this is a simplu helpfull indycator.
WARNING!!! IF YOU AT THIS POINT CANT UNDERSUD THIS INDICATOR, PLEASE DONT USE THEM .
Signal, schould be confirmed with other indicators like MA, EMA even better with LSMA .
Please try it an make only paper trading, to undertand how its realy works.
Thank You!

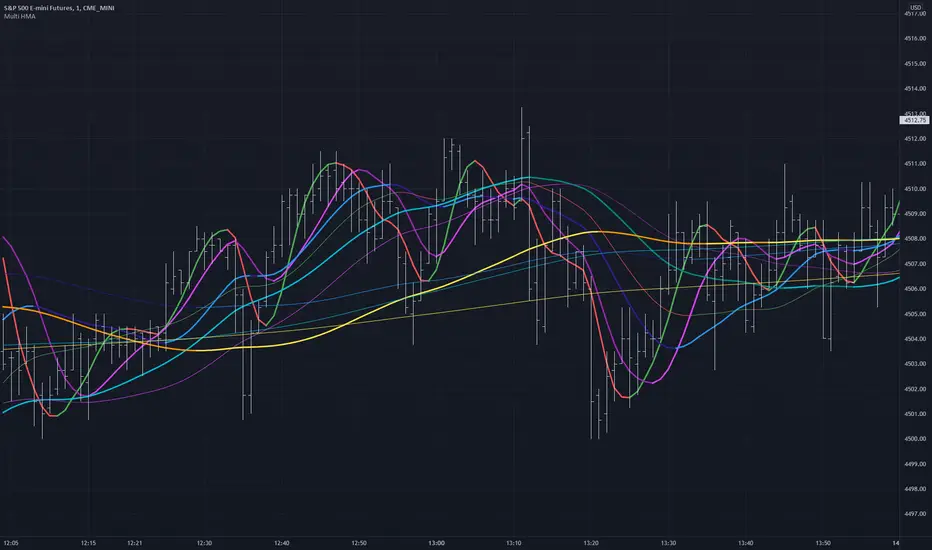
Multiple HMA Original Indicator Script for calculation and color change Hull Ma written and published by huyfibo
I found his version preferable and superior due to the method of mathematics used to get the Hull Ma
I have duplicated huyfibo's calculation for 1 line multiple times, changed variables on each one to create 12 total lines, and customized the color and width of each to help them be identifiable on the 1 minute chart.
This indicator was requested and written for a study to replace multiple SMA's with Hull MAs to compare accuracy as the Hull has much less lag.
As you can see on the above chart, it displays both the 200(1 min) and 1000 ( 5 min) HMA in gold . If user was watching the 1 min chart expecting price to resist at the 200, it would not hold. Although on the 5 min chart it does. This combination gives the user the expectation that price could jump the first line and resist at the second, which it does here.
Combining multiple lines into 1 also to take up much less room at the top of the chart for cleaner visual.
Default values are as such so that the user can have 5 min values displayed on a 1 min chart, as well as the equiv of 200 on the 30 min chart for the 2 and 4 hour.
This is a simply a matter of convenience for the study and can be unchecked to be hidden.
Coded colors and lengths are to visually discern comparable values. Both 1 and 5 min timeframes are the same color, but 1 min timeframe value has larger linewidth
Hull # 10 and 11 are intended for 30 min timeframe and should be unchecked for anything less as their value with be invalid.
All period values, color combinations, and line width can be changed in the the input menu.
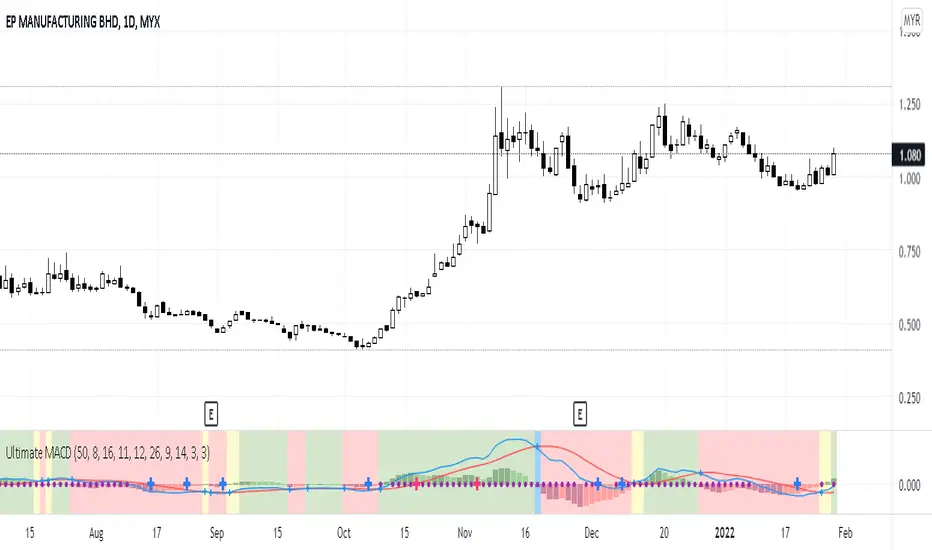
Ultimate MACDThis indicator is an improved version of MACD+RSI (refer to my script list). Basically, this indicator is a combination of several indicators:
1. Fast MACD (preset at 8, 16, 11 - it is my own preference settings and the red and blue line in this indicator are referring to the Fast MACD settings)
2. Slow MACD (preset at 12, 26, 9 - standard settings and the Slow MACD lines are not displayed in this indicator)
3. RSI (preset over value 50)
4. Stochastic (preset overbought at 80, oversold at 20)
How to read:
1. Fast and Slow MACD:
- Two red and blue lines are displaying the Fast MACD lines
- Small blue cross will appear at every crossover of the Fast MACD lines
- Golden Cross 1: Yellow background will appear if only Fast MACD lines are crossing to each other (blue crossover red)
- Golden Cross 2: Green background will appear if both Fast and Slow MACD lines are crossing to each other (blue crossover red but for Slow MACD, I didn't put those lines in this indicator)
- Death Cross 1: Blue background will appear if only Fast MACD lines are crossing to each other (red crossover blue)
- Death Cross 2: Red background will appear if both Fast and Slow MACD lines are crossing to each other (red crossover blue)
2. RSI:
- Purple dots will appear on the center line if RSI value is over 50
3. Stochastic:
- Big Blue cross will appear on the center line if stochastic line are crossing to each other in the oversold area (preset at 20)
- Big Red cross will appear on the center line if stochastic line are crossing to each other in the overbought area (preset at 80)
That's all about this indicator, you can use it based on your own trading style if it suits you. And again I let the script open for anyone to modify it based on your own preferences.
Logger Library For Pinescript (Logging and Debugging)Library "LoggerLib"
This is a logging library for Pinescript. It is aimed to help developers testing and debugging scripts with a simple to use logger function.
Pinescript lacks a native logging implementation. This library would be helpful to mitigate this insufficiency.
This library uses table to print outputs into its view. It is simple, customizable and robust.
You can start using it's .log() method just like any other logging method in other languages.
//////////////////
USAGE
//////////////////
-- Recommended: Please Read The Documentation From Source Code Below. It Is Much More Readable There And Will Be Updated Along With Newer Versions. --
Importing the Library
---------------------
import paragjyoti2012/LoggerLib/ as Logger
.init() : Initializes the library and returns the logger pointer. (Later will be used as a function parameter)
.initTable: Initializes the Table View for the Logger and returns the table id. (Later will be used as a function parameter)
parameters:
logger: The logger pointer got from .init()
max_rows_count: Number of Rows to display in the Logger Table (default is 10)
offset: The offset value for the rows (Used for scrolling the view)
position: Position of the Table View
Values could be:
left
right
top-right
(default is left)
size: Font Size of content
Values could be:
small
normal
large
(default is small)
hide_date: Whether to hide the Date/Time column in the Logger (default is false)
returns: Table
example usage of .initTable()
import paragjyoti2012/LoggerLib/1 as Logger
var logger=Logger.init()
var logTable=Logger.initTable(logger, max_rows_count=20, offset=0, position="top-right")
-------------------
LOGGING
-------------------
.log() : Logging Method
params: (string message, |string| logger, table table_id, string type="message")
logger: pass the logger pointer from .init()
table_id: pass the table pointer from .initTable()
message: The message to log
type: Type of the log message
Values could be:
message
warning
error
info
success
(default is message)
returns: void
///////////////////////////////////////
Full Boilerplate For Using In Indicator
///////////////////////////////////////
P.S: Change the | (pipe) character into square brackets while using in script (or copy it from the source code instead)
offset=input.int(0,"Offset",minval=0)
size=input.string("small","Font Size",options=|"normal","small","large"|)
rows=input.int(15,"No Of Rows")
position=input.string("left","Position",options=|"left","right","top-right"|)
hide_date=input.bool(false,"Hide Time")
import paragjyoti2012/LoggerLib/1 as Logger
var logger=Logger.init()
var logTable=Logger.initTable(logger,rows,offset,position,size,hide_date)
rsi=ta.rsi(close,14)
|macd,signal,hist|=ta.macd(close,12,26,9)
if(ta.crossunder(close,34000))
Logger.log("Dropped Below 34000",logger,logTable,"warning")
if(ta.crossunder(close,35000))
Logger.log("Dropped Below 35000",logger,logTable)
if(ta.crossover(close,38000))
Logger.log("Crossed 38000",logger,logTable,"info")
if(ta.crossunder(rsi,20))
Logger.log("RSI Below 20",logger,logTable,"error")
if(ta.crossover(macd,signal))
Logger.log("Macd Crossed Over Signal",logger,logTable)
if(ta.crossover(rsi,80))
Logger.log("RSI Above 80",logger,logTable,"success")
////////////////////////////
// For Scrolling the Table View
////////////////////////////
There is a subtle way of achieving nice scrolling behaviour for the Table view. Open the input properties panel for the table/indicator. Focus on the input field for "Offset", once it's focused, you could use your mouse scroll wheel to increment/decrement the offset values; It will smoothly scroll the Logger Table Rows as well.
/////////////////////
For any assistance using this library or reporting issues, please write in the comment section below.
I will try my best to guide you and update the library. Thanks :)
/////////////////////

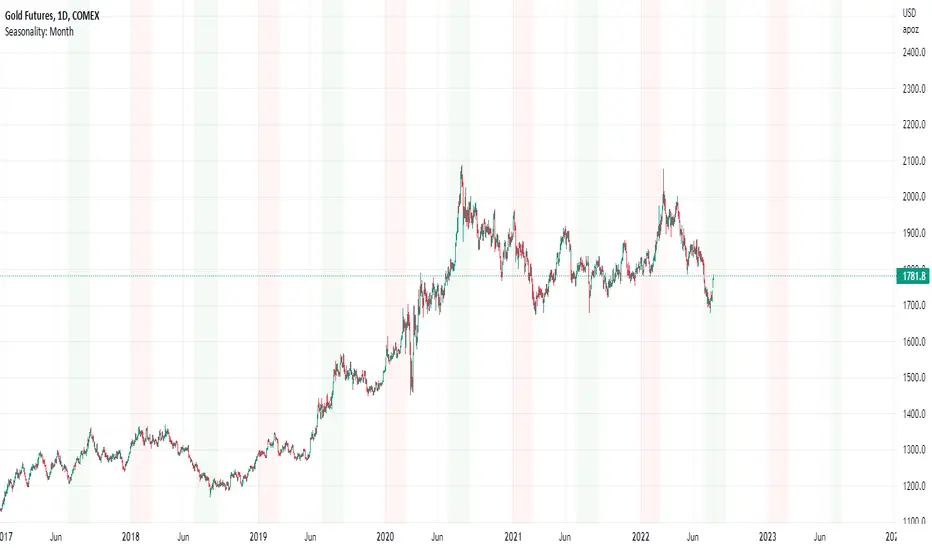
Seasonality: Month HighlightMany Assets, especially Commodities , have patterns of seasonality: Periods in the year when they have shown a greater tendency to rise or a greater tendency to fall.
The Seasonality of an asset is based on historical data (20yrs+): Specific asset seasonality charts can be found via an online search.
This is a simple tool that allows users to highlight and color code each of the 12 months of the year; depending on the seasonality of the specific asset.
The above chart shows Sugar Futures ; which are a seasonal 'sell' in February , and a seasonal 'buy' in May and August.
Seasonality should only be used to compliment a trading setup, NOT as a single reason in itself to buy or sell. Simply put: if you find a good setup, AND you have seasonality on your side; your odds of success are increased.
How Old Is this Bull Run Getting? Check MA Test Bars SinceThere are many price-based techniques for anticipating the end of a move. However, the simple passage of time can also help because bull markets don’t last forever. While old age doesn’t necessarily cause investors to sell, a reversal becomes more likely the longer a trend lasts.
So, how long have prices been going up? There are various ways to measure that. Our earlier script, MA streak , offered one solution by counting the number of bars that a given moving average has been rising or falling.
Today’s script takes a different approach by counting the number of candles since price touched or crossed a given moving average. It tracks the 50-day simple moving average (SMA) by default. It can be adjusted to other types like exponential and weighted with the AvgType input.
In the chart above, Bars Since MA Test was adjusted to use the 200-day SMA. Viewing the S&P 500 with this study helps put the current market into context.
We can see that prices last touched the 200-day SMA 386 sessions ago (June 29, 2020). That’s relatively long based on history, but not unprecedented. For example, the indicator was at 407 in February 2018 as the market pulled back. It also hit 475 in October 2014 (following the breakout above 2007 highs).
Additionally, the S&P 500 is nearing the record of the 1990s bull market (393 candles on July 12, 1996).
Before that, you have to look all the way back to the 1950s, when it twice peaked at 627.
The conclusion? The current run without a test of the 200-day SMA is above average, but not yet record-setting. It may be interesting to watch as earnings season approaches and the Federal Reserve looks to tighten monetary policy.
TradeStation is a pioneer in the trading industry, providing access to stocks, options, futures and cryptocurrencies. See our Overview for more.
Important Information
TradingView is not affiliated with TradeStation Securities Inc. or its affiliates. TradeStation Securities, Inc., TradeStation Crypto, Inc., and TradeStation Technologies, Inc. are each wholly owned subsidiaries of TradeStation Group, Inc., all operating, and providing products and services, under the TradeStation brand and trademark. When applying for, or purchasing, accounts, subscriptions, products and services, it is important that you know which company you will be dealing with. Please click here for further important information explaining what this means.
This content is for informational and educational purposes only. This is not a recommendation regarding any investment or investment strategy. Any opinions expressed herein are those of the author and do not represent the views or opinions of TradeStation or any of its affiliates.
Investing involves risks. Past performance, whether actual or indicated by historical tests of strategies, is no guarantee of future performance or success. There is a possibility that you may sustain a loss equal to or greater than your entire investment regardless of which asset class you trade (equities, options, futures, or digital assets); therefore, you should not invest or risk money that you cannot afford to lose. Before trading any asset class, first read the relevant risk disclosure statements on the Important Documents page, found here: www.tradestation.com .

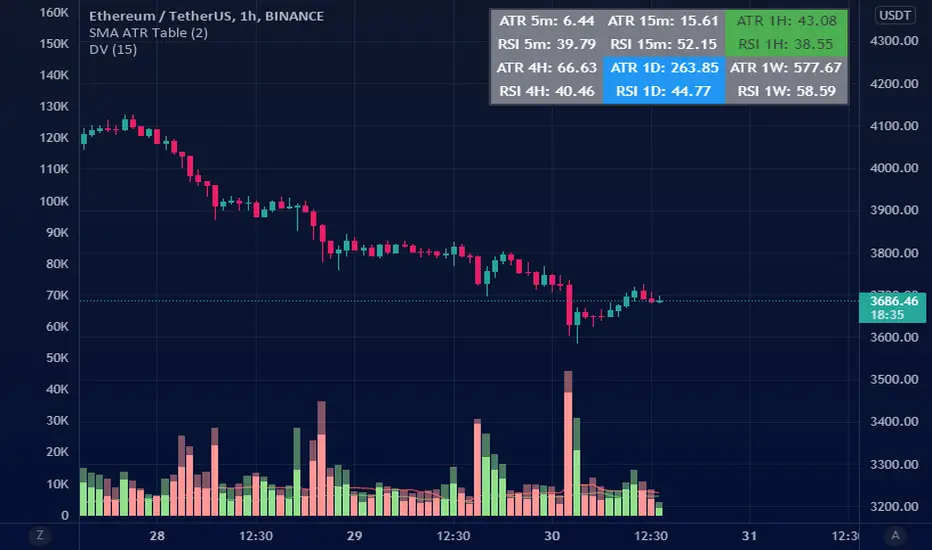
ATR Table (SMA)ATR table for select time frames.
Using Simple Moving Average (SMA) to get ATR.
MA periods is based on numbers suggested by Saeed Khakestar (Trigger Price Action)
You can change them in code
5m => 12
15m => 16
1H => 24
4H => 42
1D => 30
1W => 52
RSI is calculated the same way
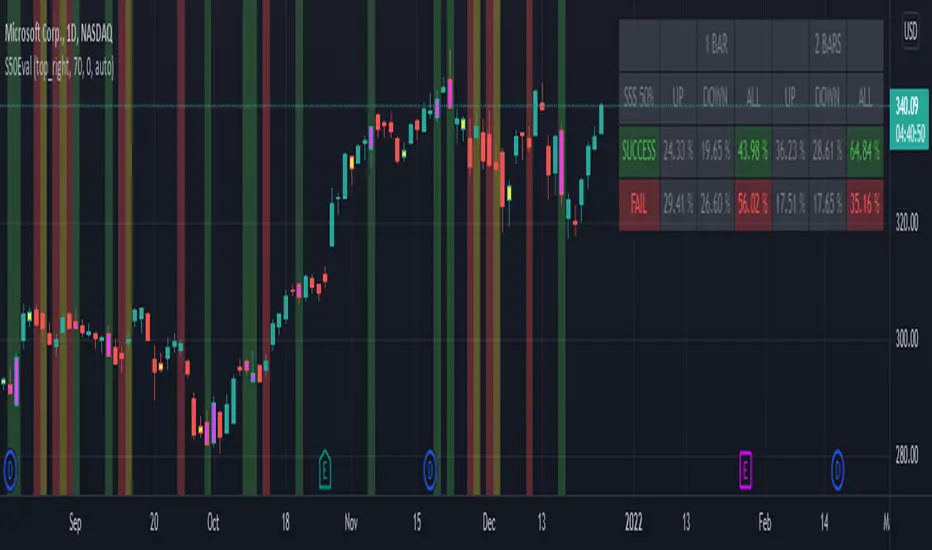
[BM] SSS 50% Rule EvaluatorSara Strat Sniper 50% Rule Evaluator
█ OVERVIEW
This indicator is based on Sara Strat Sniper's - 50% Rule for trading Outside Bars and helps you to evaluate the historical success rate of that rule.
█ FEATURES
Calculation
• You can choose to evaluate only the current bar to see if it forms an outside bar (success) or not (fail), but you can also choose to include the next bar to see if that one forms a compound outside bar.
• You can enable a start and/or end date to limit the calculation period.
Table
• Show or hide the table with the calculation results.
• Show or hide the calculation details (up/down data).
• Position of the table, opacity, cell width and text size can be customized.
Colors
• Table colors can be customized.
• You can choose to show the inside/outside bars in customizable bar colors.
• You can choose to identify successful/failed/recovered outside bars in customizable background colors.
█ LIMITATIONS
• This script uses a special characteristic of the `security()` function allowing the inspection of intrabars — which is not officially supported by TradingView.
• Intrabar inspection only works on some chart timeframes: 5, 10, 15, 30, 45 and 195 minutes, 1, 2, 3, 4, 5, 6, 7 and 8 hours, 1, 2, 3, 4 and 5 days, 1, 2, 3 and 4 weeks, 1, 2, 3, 4, 5, 6, 7, 8, 9, 10, 11 and 12 months. The script’s code can be modified to run on other resolutions.
• There is a limit to how far back intrabar calculations can be performed, and is dependant on both the intrabar resolution and your subscription (which determines the number of available bars).