BOSS_ROC_ZONES📌 BOSS ROC ZONES — Indicator Description
BOSS ROC ZONES is a precision momentum-intensity oscillator that transforms the 5-bar Rate-of-Change into a clean, color-coded, 7-zone heat map. Instead of a messy, noisy ROC line, this tool converts momentum into clear visual “temperature” zones that show you exactly how strong (or weak) the market really is.
Neutral conditions are shown in tan, while momentum increases transition through yellow (warm) → light green (hot) → bright green (flaming) for both bullish and bearish moves. The result is a smooth, continuous oscillator that reveals trend acceleration, reversals, and exhaustion with zero guesswork.
🔥 Zone Definitions (5-Bar ROC %)
0 — Neutral: |ROC| < 0.05% (Tan)
±1 — Warm / Cool: 0.05%–0.10% (Yellow)
±2 — Hot / Cold: 0.10%–0.20% (Light Green)
±3 — Flaming / 0-Kelvin: > 0.20% (Bright Green)
Zones appear symmetrically whether momentum is bullish or bearish.
🚀 What BOSS ROC ZONES Shows You
Momentum acceleration before a breakout or breakdown
When a trend is strengthening vs fading
Hidden weakness inside pullbacks
Low-energy chop (avoid these zones)
High-velocity legs where the best trades form
Early warning signs of reversal through momentum contraction
🎯 Best Use Cases
Intraday scalping
Trend continuation trades
Breakdown/flip entries
Identifying “false strength” pullbacks
Filtering low-momentum environments
Spotting velocity shifts before the candles show it
💡 Why Traders Love It
Momentum is the heartbeat of a chart—BOSS ROC ZONES makes that heartbeat visible.
No noise. No guessing. Just pure price velocity read in seconds.
"芯片龙头etf" için komut dosyalarını ara

Market Breadth Decision HelperMarket Breadth Decision Helper (NYSE/NASDAQ VOLD, ADD, TICK)
Combines NYSE VOLD, NASDAQ VOLD (VOLDQ), NYSE/NASDAQ ADD, and TICK into a single intraday dashboard for tactical bias and risk management.
Tiered pressure scale (sign shows direction, abs(tier) shows intensity): 0 = Neutral, 1 = Mild, 2 = Strong, 3 = Severe, 4 = Panic. On-chart legend makes this explicit.
Table view highlights value, tier, bull/bear point contributions, and notes (PANIC, OVERRIDE, DIVERGENCE). VOLD and ADD panic trigger “stand down”; VOLD ±2 triggers bull/bear overrides; NYSE vs NASDAQ ADD divergence triggers “scalp only.”
Bull/bear points: VOLD 2 pts, ADD NYSE 2 pts, ADD NASDAQ 1 pt, TICK 1 pt. ≥3 pts on a side lifts that side’s multiplier to 1.5. Bias flips Bullish/Bearish only if a side leads and has ≥2 pts; otherwise Neutral.
Breadth modes: PANIC_NO_TRADE → DIVERGENCE_SCALP_ONLY → VOLD_OVERRIDE_BULL/BEAR → NORMAL/NO_EDGE.
Intraday context: tracks current session day_high / day_low for the chart symbol.
JSON/Alert export (optional) sends raw values plus *_tier and *_tier_desc labels (NEUTRAL/MILD/STRONG/SEVERE/PANIC) with sign/magnitude hints, so agents/bots never have to guess what “1 vs 2 vs 3 vs 4” mean.
Customizable bands for VOLD/ADD/TICK, table styling, label placement, and dashboard bias input to align with higher-timeframe context.
Best use
Quick read on internal participation and pressure magnitude.
Guardrails: respect PANIC and overrides; treat divergence as “scalp only.”
Pair with your strategy entries; let breadth govern when to press, scale back, or stand down.
Symbols (defaults)
VOLD (NYSE volume diff), VOLDQ (NASDAQ volume diff), ADD (NYSE), ADDQ (NASDAQ), TICK (NYSE). Adjust in Inputs as needed.
Alerts
Panic, divergence, strong bullish/bearish breadth. Enable JSON export to feed algo/agent workflows.

ORB 9:30 AM 15-Min Range - All TimeframesMy NYC session ORB stategy script. It find the NYC opening range on the 15min timeframe and displays it across all timeframes.

3 Band Volume matched Candles3 Band Volume matched Candles– is a clean, high-signal volume-based candle colouring system designed to highlight the extremes of market participation. Instead of using complex multi-band gradients, this simplified version focuses on what truly matters to scalpers and intraday traders:
🔵 Very Weak Volume (Exhaustion)
Shows when the market is running out of participation. These candles often appear near tops, stalled moves, fake breakouts, and areas where liquidity is drying up. Perfect for spotting potential reversals or rug-pull conditions.
⚪ Normal Volume (Baseline Flow)
Represents regular market activity. These neutral candles keep the chart clean and make the extremes stand out instantly.
🟥 Neon Hot-Red (High-Impact Volume)
Highlights moments of significant volume — intervention, aggression, absorption, stop hunts, or strong rejection wicks. These candles are critical for identifying real moves vs. fake ones, spotting wickbacks, and confirming momentum shifts.
Why This Tool Works
By focusing only on the very low and very high ends of market volume, the indicator cuts through noise and exposes the true behaviour behind each candle. Traders can instantly see:
When a move is losing strength
When a trend is topping or stalling
When big volume enters the market
When a wickback is driven by strong rejection
Whether a breakout is real or weak
When reversals are highly probable
This makes it ideal for scalpers, and anyone who trades fast-moving instruments
Customisation
Fully customisable weak/normal and normal/strong thresholds
User-defined colours for each band
Brightness control
Borders-only mode
Adjustable fill opacity
Optional corner legend for clarity

2-Stage Dashboard (SQZPRO Wide + EMA)Dashboard for Darvas Box EMA momentum traders, located in the bottom right, mostly for quickly screening if a setup is viable.
- EMAs are 9 & 21
- SQZPRO set to wide squeezes
Long setup:
- Green SQZPRO row
- Green EMA row
Short setup:
- Green SQZPRO row
- Red EMA row

Day Open ± Ø DailyRangeScript Function Description
This indicator draws two horizontal dashed lines during the Regular Trading Hours (RTH) session.
The upper line is calculated as the RTH Open price plus the average daily range (based on the last 10 days).
The lower line is calculated as the RTH Open price minus the average daily range.
🔍 How it works
Average Daily Range (ADR): The script requests daily candles and computes the 10‑day simple moving average of the daily range (High–Low). This value remains constant throughout the trading day.
RTH Detection: The script identifies the first bar of the RTH session (e.g., 09:00 local exchange time). The open price of this bar is stored as the RTH Open.
Line Creation: At the first RTH bar, two dashed lines are drawn:
Green line above the RTH Open (Open + ADR).
Red line below the RTH Open (Open – ADR).
Dynamic Extension: As new bars appear, the lines are automatically extended to the current bar, keeping their Y‑values constant. This ensures the levels remain visible throughout the session.
✅ What Users See
A green dashed line above the RTH Open, marking the typical upside boundary.
A red dashed line below the RTH Open, marking the typical downside boundary.
Both lines start at the first RTH bar and extend to the latest bar of the session.
This helps traders quickly assess whether price action is staying within or breaking beyond the typical daily range relative to the RTH Open.

IDRV – Market Structure & Projection ("cup and handle")1. Market Context
1. IDRV has completed a multi-month bottoming structure resembling a rounded accumulation base.
2. Price has broken above local resistance, confirming a bullish shift in trend.
3. RSI signals alternating bear/bull divergences, showing momentum compression before expansion.
2. Accumulation & Breakout Structure
4. Multiple higher lows since early 2024 indicate sustained accumulation.
5. The breakout above the neckline marks the beginning of an upward trend cycle.
6. Volume and structure support continuation rather than a fake-out.
3. Bullish Continuation Zone
7. The chart highlights a bullish expansion zone between $38 and $42.
8. Holding above this zone confirms trend strength and supports further upside.
9. A clean retest in this area offers a high-probability reload opportunity.
4. Projection Target
10. The projected upside shows a potential +56% move, targeting the $48–$52 region.
11. This aligns with previous supply zones and Fibonacci extension symmetry.
12. Price is expected to follow an ascending impulse pattern into 2026.
5. Risk Management
13. Invalidations occur below the $34–$35 support band where trend structure breaks.
14. A loss of this zone signals a likely return to the accumulation range.
15. Watch RSI bear signals during the climb for early signs of exhaustion.
6. Summary
16. Rounded base → Breakout → Retest → Expansion.
17. Structure supports continued bullish momentum into 2026.
18. Target zone remains $48–$52 if support is maintained.

ATR EMA Bands (Kerry Lovvorn Style) - Fixed Scale//@version=5
indicator("ATR EMA Bands (Kerry Lovvorn Style) - Fixed Scale",
overlay = true,
scale = scale.right, // ⭐ 强制使用右侧价格刻度
precision = 2)
// ——— 参数 ———
src = input.source(close, "Source")
emaLength = input.int(34, "EMA Length")
atrLength = input.int(13, "ATR Length")
atrMult1 = input.float(1.0, "ATR ×1")
atrMult2 = input.float(2.0, "ATR ×2")
atrMult3 = input.float(3.0, "ATR ×3")
// ——— 计算 ———
ema = ta.ema(src, emaLength)
atr = ta.atr(atrLength)
// 上下轨
upper1 = ema + atr * atrMult1
upper2 = ema + atr * atrMult2
upper3 = ema + atr * atrMult3
lower1 = ema - atr * atrMult1
lower2 = ema - atr * atrMult2
lower3 = ema - atr * atrMult3
// ——— 绘图 ———
plot(ema, "EMA", color = color.white, linewidth = 2)
plot(upper1, "Upper 1×ATR", color = color.new(color.green, 0))
plot(upper2, "Upper 2×ATR", color = color.new(color.green, 30))
plot(upper3, "Upper 3×ATR", color = color.new(color.green, 60))
plot(lower1, "Lower 1×ATR", color = color.new(color.red, 0))
plot(lower2, "Lower 2×ATR", color = color.new(color.red, 30))
plot(lower3, "Lower 3×ATR", color = color.new(color.red, 60))
// ——— 可选:在当前 K 线上标记数值,方便你肉眼对比 ———
showDebug = input.bool(false, "Show Debug Labels (for checking value vs position)")
if showDebug
var label lb = na
if barstate.islast
label.delete(lb)
txt = "EMA: " + str.tostring(ema, format.mintick) + "\n" +
"U1: " + str.tostring(upper1, format.mintick) + "\n" +
"U2: " + str.tostring(upper2, format.mintick) + "\n" +
"U3: " + str.tostring(upper3, format.mintick)
lb := label.new(bar_index, upper1, txt, style = label.style_label_right, textcolor = color.white, color = color.new(color.black, 40))

Myanverse Scalper BurmeseThis is Public Indicators from many resources and translated into burmese to use at ease.
I have another option sale indicators to use together.
CNN Fear and Greed Strategy改編© EdgeTools製作的指標
改編內容:
1. Put/Call Ratio的資料來源。
2. 債券的資料來源。
3. 調整normalize的方法,使CNN恐懼貪婪指數可以顯示更長期週期,以利於回測用。
4. 修改顯示樣式,讓樣式更為簡單
5. 增加進場條件【index >=25 & index crossover index 5ma】以及出場條件【持有252日】。

RSI + BB + ATR Short SignalThis indicator highlights potential short setups by combining three conditions:
RSI Overbought – RSI must be above the user-defined level.
Bollinger Band Break – Price must close above the upper Bollinger Band.
Extended Above the 5-Day Low – Price must sit at least X ATR above the recent 5-day low.
When all conditions line up on the same bar, the script plots a red triangle above the candle and triggers an alert so you can act immediately.
To help visualise the setup, the script also plots the full Bollinger Bands (upper, middle, lower) and a line showing the threshold of 5-day-low + ATR × multiplier. You can adjust RSI length and level, Bollinger settings, ATR length, and the ATR multiplier.
TNT TRADER MARKET ClOSEVertical Line of red showing the New York market close. Color and time can be changed
TNT TRADER EMA FANEMA fan of 8 20 50 200, very simple and straight forward with color change options.

Slope Rank ReversalThis tool is designed to solve the fundamental problem of "buying low and selling high" by providing objective entry/exit signals based on momentum extremes and inflection points.
The System employs three core components:
Trend Detection (PSAR): The Parabolic SAR is used as a filter to confirm that a trend reversal or transition is currently underway, isolating actionable trade setups.
Dynamic Momentum Ranking: The indicator continuously measures the slope of the price action. This slope is then ranked against historical data to objectively identify when an asset is in an extreme state (overbought or oversold).
Signal Generation (Inflection Points):
Oversold/Buy: A 🟢 Green X is generated only when the slope ranking indicates the market is steeply negative (oversold), and the slope value begins to tick upwards (the inflection point), signaling potential mean reversion.
Overbought/Sell: A 🔴 Red X is generated only when the slope ranking indicates the market is steeply positive (overbought), and the slope value begins to tick downwards, signaling momentum exhaustion.
The core philosophy is simple: Enter only when the market is exhausted and has started to turn.

O'Neil Market TimingBill O'Neil Market Timing Indicator - User Guide
Overview
This Pine Script indicator implements William O'Neil's market timing methodology, which assigns one of four distinct states to a market index (such as SPY or QQQ) to help traders identify optimal market conditions for investing. The indicator is designed to work exclusively on Daily timeframe charts.
The Four Market States
The indicator tracks the market through four distinct states, with specific transition rules between them:
1. Confirmed Uptrend (Green)
- Meaning: The market is in a healthy uptrend with institutional support
- Action: Favorable conditions for building positions in leading stocks
- Can transition to: State 2 (Uptrend Under Pressure)
2. Uptrend Under Pressure (Yellow)
- Meaning: The uptrend is showing signs of weakness with increasing distribution
- Action: Be cautious, tighten stops, reduce position sizes
- Can transition to: State 1 (Confirmed Uptrend) or State 3 (Downtrend)
3. Downtrend (Red)
- Meaning: The market is in a confirmed downtrend
- Action: Stay mostly in cash, avoid new purchases
- Can transition to: State 4 (Rally Attempt)
4. Rally Attempt (Pink/Fuchsia)
- Meaning: The market is attempting to bottom and reverse
- Action: Watch for Follow-Through Day to confirm new uptrend
- Can transition to: State 1 (Confirmed Uptrend) or State 3 (Downtrend)
Key Concepts
Distribution Day
A distribution day occurs when:
1. The index closes down by more than the critical percentage (default 0.2%)
2. Volume is higher than the previous day's volume
Distribution days indicate institutional selling and are marked with red triangles on the indicator.
Follow-Through Day
A follow-through day occurs during a Rally Attempt when:
1. The index closes up by more than the critical percentage (default 1.6%)
2. Volume is higher than the previous day's volume
A Follow-Through Day confirms a new uptrend and triggers the transition from Rally Attempt to Confirmed Uptrend.
State Transition Logic
Valid Transitions
The system only allows specific transitions:
- 1 → 2: When distribution days reach the "pressure number" (default 5) within the lookback period (default 25 bars)
- 2 → 1: When distribution days drop below the pressure number
- 2 → 3: When distribution days reach "downtrend number" (default 7) AND price drops by "downtrend criterion" (default 6%) from the lookback high
- 3 → 4: When the market doesn't make a new low for 3 consecutive days
- 4 → 3: When a new low is made, undercutting the downtrend low
- 4 → 1: When a Follow-Through Day occurs during the Rally Attempt
Input Parameters
Distribution Day Parameters
- Distribution Day % Threshold (default 0.2%, range 0.1-2.0%)
- Minimum percentage decline required to qualify as a distribution day. While 0.2% seems to be the canonical number I see in literature about this, I use a much higher threshold (at least 0.5%)
Follow-Through Day Parameters
- Follow-Through Day % Threshold (default 1.6%, range 1.0-2.0%)
- Minimum percentage gain required to qualify as a follow-through day
### State Transition Parameters
- Pressure Number (default 5, range 3-6)
- Number of distribution days needed to transition from Confirmed Uptrend to Uptrend Under Pressure
- Lookback Period (default 25 bars, range 20-30)
- Number of days to count distribution days
- Downtrend Number (default 7, range 4-10)
- Number of distribution days needed (with price drop) to transition to Downtrend
- Downtrend % Drop from High (default 6%, range 5-10%)
- Percentage drop from lookback high required for downtrend confirmation
Visual Settings
- Color customization for each state
- Table position selection (Top Left, Top Right, Bottom Left, Bottom Right)
## How to Use This Indicator
### Installation
1. Open TradingView and navigate to SPY or QQQ (or another major index)
2. **Important**: Switch to the Daily (1D) timeframe
3. Click on "Indicators" at the top of the chart
4. Click "Pine Editor" at the bottom of the screen
5. Copy and paste the Pine Script code
6. Click "Add to Chart"
### Interpretation
**When the indicator shows:**
- **Green (State 1)**: Market is healthy - consider adding quality positions
- **Yellow (State 2)**: Exercise caution - tighten stops, be selective
- **Red (State 3)**: Defensive mode - preserve capital, avoid new buys
- **Pink (State 4)**: Watch closely - prepare for potential Follow-Through Day
### The Information Table
The table displays:
- **Current State**: The current market condition
- **Distribution Days**: Number of distribution days in the lookback period
- **Lookback Period**: Number of bars being analyzed
- **Rally Attempt Day**: (Only in State 4) Days into the current rally attempt
### Visual Elements
1. **State Line**: A stepped line showing the current state (1-4)
2. **Red Triangles**: Mark each distribution day
3. **Horizontal Reference Lines**: Dotted lines marking each state level
4. **Color-Coded Display**: The state line changes color based on the current market condition
## Trading Strategy Guidelines
### In Confirmed Uptrend (State 1)
- Build positions in stocks breaking out of proper bases
- Use normal position sizing
- Focus on stocks showing institutional accumulation
- Hold winners as long as they act properly
### In Uptrend Under Pressure (State 2)
- Take partial profits in extended positions
- Tighten stop losses
- Be more selective with new entries
- Reduce overall exposure
### In Downtrend (State 3)
- Move to cash or maintain very light exposure
- Avoid new purchases
- Focus on preservation of capital
- Use the time for research and watchlist building
### In Rally Attempt (State 4)
- Stay mostly in cash but prepare
- Build a watchlist of strong stocks
- On Day 4+ of the rally attempt, watch for Follow-Through Day
- If FTD occurs, begin cautiously adding positions
## Best Practices
1. **Use with Major Indices**: This indicator works best with SPY, QQQ, or other broad market indices
2. **Daily Timeframe Only**: The indicator is designed for daily bars - do not use on intraday timeframes
3. **Combine with Stock Analysis**: Use the market state as a filter for individual stock decisions
4. **Respect the Signals**: When the market enters Downtrend, reduce exposure regardless of individual stock setups
5. **Monitor Distribution Days**: Pay attention when distribution days accumulate - it's a warning sign
6. **Wait for Follow-Through**: Don't jump back in too early during Rally Attempt - wait for confirmation
## Alert Conditions
The indicator includes built-in alert conditions for:
- State changes (entering any of the four states)
- Distribution Day detection
- Follow-Through Day detection during Rally Attempt
To set up alerts:
1. Click the "Alert" button while the indicator is on your chart
2. Select "O'Neil Market Timing"
3. Choose your desired alert condition
4. Configure notification preferences
## Customization Tips
### For More Sensitive Detection
- Lower the "Pressure Number" to 3-4
- Lower the "Distribution Day % Threshold" to 0.15%
- Reduce the "Downtrend Number" to 5-6
### For More Conservative Detection
- Raise the "Pressure Number" to 6
- Raise the "Distribution Day % Threshold" to 0.3-0.5%
- Increase the "Downtrend Number" to 8-9
### For Different Market Conditions
- **Bull Market**: Consider slightly higher thresholds
- **Bear Market**: Consider slightly lower thresholds
- **Volatile Market**: May need to increase percentage thresholds
## Limitations and Considerations
1. **Not a Crystal Ball**: The indicator identifies conditions but doesn't predict the future
2. **False Signals**: Follow-Through Days can fail - use proper risk management
3. **Whipsaws Possible**: In choppy markets, the indicator may switch states frequently
4. **Confirmation Lag**: By design, there's a lag as the system waits for confirmation
5. **Works Best with Price Action**: Combine with your analysis of individual stocks
## Historical Context
This methodology is based on William J. O'Neil's decades of market research, documented in books like "How to Make Money in Stocks" and through Investor's Business Daily. O'Neil's research showed that:
- Most major market tops are preceded by accumulation of distribution days
- Most successful rallies begin with a Follow-Through Day on Day 4-7 of a rally attempt
- Identifying market state helps prevent buying during unfavorable conditions
## Troubleshooting
**Problem**: Indicator shows "Initializing"
- **Solution**: Let the chart load at least 5 bars to establish the initial state
**Problem**: No distribution day markers appear
- **Solution**: Verify you're on daily timeframe and check if volume data is available
**Problem**: Table not visible
- **Solution**: Check the table position setting and ensure it's not off-screen
**Problem**: State seems to change too frequently
- **Solution**: Increase the lookback period or adjust threshold parameters
## Support and Further Learning
For deeper understanding of this methodology:
- Read "How to Make Money in Stocks" by William J. O'Neil
- Study Investor's Business Daily's "Market Pulse"
- Review historical market tops and bottoms to see the pattern
- Practice identifying distribution days and follow-through days manually
## Version History
**Version 1.0** (November 2025)
- Initial implementation
- Four-state system with proper transitions
- Distribution day detection and marking
- Follow-through day detection
- Customizable parameters
- Information table display
- Alert conditions
---
## Quick Reference Card
| State | Number | Color | Action |
|-------|--------|-------|--------|
| Confirmed Uptrend | 1 | Green | Buy quality setups |
| Uptrend Under Pressure | 2 | Yellow | Tighten stops, be selective |
| Downtrend | 3 | Red | Cash position, no new buys |
| Rally Attempt | 4 | Pink | Watch for Follow-Through Day |
**Distribution Day**: Down > 0.2% on higher volume (red triangle)
**Follow-Through Day**: Up > 1.6% on higher volume during Rally Attempt (triggers State 4→1)
---
*Remember: This indicator is a tool to help identify market conditions. It should be used as part of a comprehensive trading strategy that includes proper risk management, position sizing, and individual stock analysis.*
Also, I created this with the help of an AI coding framework, and I didn't exhaustively test it. I don't actually use this for my own trading, so it's quite possible that it's materially wrong, and that following this will lead to poor investment decisions.. This is "copy left" software, so feel free to alter this to your own tastes, and claim authorship.

PEGY Ratio (Div Adj PEG)Identifying the PEGY (Dividend Adjusted PEG) to find value investment opportunities.

Lorentzian Length Adaptive Moving Average [LLAMA] Adaptation of "Machine Learning: Lorentzian Classification" by
Gradient color by base on work by
LLAMA: A regime-aware adaptive moving average that bends with the market.
Start with a problem traders know:
Traditional moving averages are either too slow (EMA200) or too fast (EMA9)
Adaptive MAs exist, but they often hug price too tightly or smooth too much, failing to balance bias and tactics
LLAMA uses a Lorentzian distance function to adapt its length dynamically. Instead of a fixed smoothing window, it stretches or contracts depending on market conditions. This distortion reduces lag while still providing a clear bias line.
The indicator looks back at recent bars and measures how similar they are using a Lorentzian distance (a log‑scaled absolute difference). It keeps track of the “nearest neighbors” — bars that most resemble the current regime. Each neighbor carries a label (long, short, neutral) based on simple price comparisons. By averaging these labels, LLAMA predicts whether the market is leaning bullish or bearish. That prediction is then mapped into a dynamic length between and .
Bullish bias -> length stretches toward max (smoother, more stable).
Bearish bias -> length contracts toward min (snappier, more reactive).
During breakouts, LLAMA tightens and comes into contact with bars, giving actionable signals. During chop, it stretches to avoid false triggers. It covers both ends of the spectrum (bias and tactics) in one line, something static MA's can't do.
Think of LLAMA as a lens that bends with the market:
Wide lens (max length) for big picture bias.
Narrow lens (min length) for tactical precision.
The "Lorentzian Loop" is the math that decides when to widen or narrow.

Bullish ATR Level indicatorThis indicator is used by OVTLYR Golden Ticket Trading strategy to determine the stop loss and option rollover levels. Super simple indicator that just shows the current price, -1/2 ATR for a stop loss and 1 and 2 ATR levels for possible take profit or option rollover points.

Smart Trail Signals NO CONDITIONSSmart Trail Signals Indicator
Overview
This is a trend-following indicator that uses a dynamic trailing stop system to identify bullish and bearish trends. It adapts to market volatility using ATR (Average True Range) and provides visual signals when the trend direction changes.
Core Components
Smart Trail System:
Calculates dynamic support (trail_up) and resistance (trail_down) levels
Adjusts trail levels based on price movement and volatility
Maintains trend direction until price crosses the opposite trail level
Key Parameters:
Length (14): Period for ATR calculation
Multiplier (2.0): Distance of trail from price relative to ATR
Sensitivity (1-5): Fine-tunes how quickly the trail adapts to price changes
How It Works
Trend Detection: Monitors whether price is above the support trail (bullish) or below the resistance trail (bearish)
Trail Movement:
In uptrends: Support trail rises with price but never decreases
In downtrends: Resistance trail falls with price but never increases
Signals: Diamond shapes appear when trend flips:
Green diamond below bar = bullish trend change
Red diamond above bar = bearish trend change
Visual Aids:
Trail line changes color (lime for uptrend, red for downtrend)
Candles colored green (bullish), red (bearish), or gray (neutral)
Best Use Cases
Identifying trend reversals on any timeframe
Following strong directional moves
Setting dynamic stop-loss levels
Works 24/7 on all instruments (stocks, crypto, forex)
RetryClaude can make mistakes. Please double-check responses. Sonnet 4.5

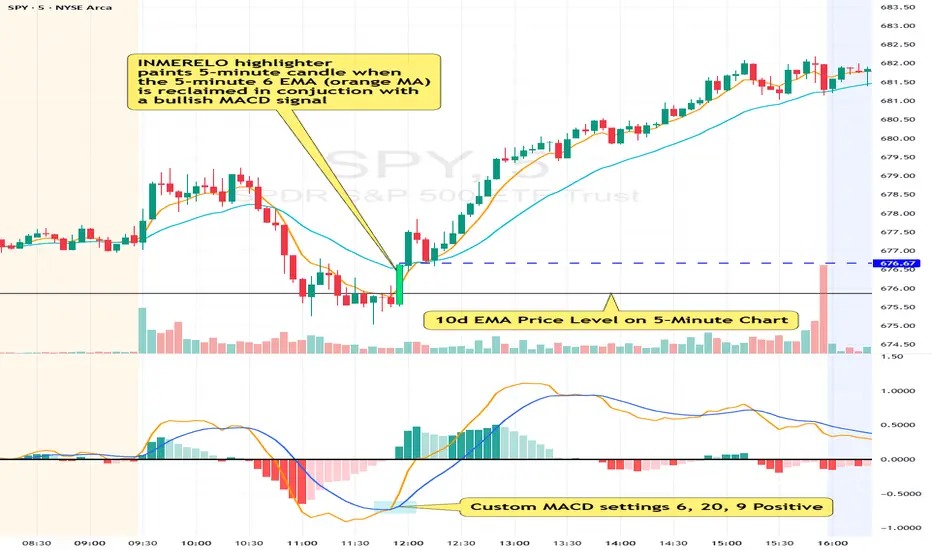
INMERELO EMA Reclaim HighlighterOverview
The INMERELO EMA Reclaim indicator highlights intraday candles reclaiming a configurable EMA on any timeframe. It identifies candles based on customizable candle geometry filters and confirms momentum using a custom MACD setup.
Features
Configurable Intraday EMA
Any EMA length and timeframe. Default: 6-period EMA on chart timeframe.
Highlights when price reclaims the EMA after a configurable number of prior closes below it.
Candle Geometry Filters (ORB-Style)
Open Position: Maximum position of open relative to candle range (0–1). Default: 0.40
Close Position: Minimum position of close relative to candle range (0–1). Default: 0.70
Body Fraction: Minimum body size relative to candle range. Default: 0.50
Custom MACD Filter
Fast line above slow line.
Configurable: Fast (default 6), Slow (default 20), Signal (default 9).
Prior Closes Below EMA Filter
Configurable minimum number of prior closes below EMA. Default: 2
Visual Options
Paint candle with configurable color.
Optional arrow display above reclaim candle (toggleable).
Flexible
Works on any intraday timeframe, including 5-minute, 2-minute, 15-minute, etc.
Settings Overview
Setting Default Notes
EMA Length 6 EMA used for reclaim detection
EMA Timeframe Chart TF Can be set to any intraday timeframe
Open ≤ 0.40 ORB-style filter
Close ≥ 0.70 ORB-style filter
Body Fraction 0.50 ORB-style filter
Min Prior Closes Below EMA 2 Minimum closes below EMA before reclaim
MACD Fast 6 Custom MACD fast line
MACD Slow 20 Custom MACD slow line
MACD Signal 9 Custom MACD signal line
Paint Candle True Highlights valid candles
Candle Color Lime Configurable
Show Arrow False Optional visual
Summary:
The INMERELO EMA Reclaim indicator identifies intraday candles reclaiming a configurable EMA, filtered by customizable candle geometry and MACD momentum. Visual options include painted candles and optional arrows, and all settings are fully configurable.
RSI Divergence on 15-Minute with 5min & 1min CorrectionUse the 5 minute chart to identify 15 minute rsi divergence, showing the 5 and 1 min rsi levels "participating in" the correction of the 15 minute rsi divergence.

RSI Divergence on 1-Hour with 15min & 5min CorrectionUsing the 15 minute timeframe, rsi divergence on the hourly chart is "tracked" by the 15 and 5 min rsi levels to watch for the hourly chart's rsi correction.
