Volume Range EventsChanges in the feelings (positive, negative, neutral) in the market concerning the valuation of an instrument are often preceded with sudden outbursts of buying and selling frenzies. The aim of this indicator is to report such outbursts. We can see them as expansions of volume, sometimes 10 times more than usual. and as extensions of the trading range, also sometimes 10 times more than usual (e.g. usual range is 10 cent suddenly a whole dollar.) The changes are calculated in such a way that these fit between plus and minus 100 percent, the bars are scaled in some sort of logarithmic way. The Emoline is the same as the one in the True Balance of Power indicator, which I already published
ONLY RISES ARE EVENTS
Sometimes analysts are tempted to give meaning to low volume or small ranges. These simply mean that the market has little interest in trading this instrument. I believe that in such cases the trader needs to wait for expansion and extension events to happen, then he can make a better guess of where the market is heading. As events often mark the beginning or ending of a trend, this indicator provides an early and clear signal, because it doesn’t bother us about non-events.
WHAT IS USUAL?
If the algorithm would use an average as a normal to scale volume or range events, then previous peaks will act as spoilers by making the average so high that a following peak is scaled too small. I developed a function, usual() , that kicks out all extremes of a ‘population of values’ and which returns the average of the non-extreme values. It can be called with any serial. This function is called by both algorithms that report volume and range peaks, which guarantees that the results are really comparable. As this function has a fixed look back of 8 periods, we might state that ‘usual’ is a short lived relative value. I think this doesn’t matter for the practical use of the indicator.
COLORING AND INTERPRETATION
I follow the categories in the ‘Better Volume Indicator’, published by LeazyBear, these are:
1. Climactic Volumes, event >40 % (this means peak is 1.5 X usual)
LIME: Climax Buying Volume, direction up, range event also > 30 %
RED: Climax Selling Volume, direction down, range event also > 30 %
AQUA: Climax Churning Volume, both directions, range event < 30%
2. Smaller Volumes, event <40 %
GREEN: Supportive Volume, both directions, if combined with range event
BLUE: Churning Volume, both directions, if not combined with range event (Professional Trading)
3. Just Range Events
BLACK histogram bars (Amateurish Trading)
"腾讯10大股东" için komut dosyalarını ara

Forex Master v4.0 (EUR/USD Mean-Reversion Algorithm)DESCRIPTION
Forex Master v4.0 is a mean-reversion algorithm currently optimized for trading the EUR/USD pair on the 5M chart interval. All indicator inputs use the period's closing price and all trades are executed at the open of the period following the period where the trade signal was generated.
There are 3 main components that make up Forex Master v4.0:
I. Trend Filter
The algorithm uses a version of the ADX indicator as a trend filter to trade only in certain time periods where price is more likely to be range-bound (i.e., mean-reverting). This indicator is composed of a Fast ADX and a Slow ADX, both using the same look-back period of 50. However, the Fast ADX is smoothed with a 6-period EMA and the Slow ADX is smoothed with a 12-period EMA. When the Fast ADX is above the Slow ADX, the algorithm does not trade because this indicates that price is likelier to trend, which is bad for a mean-reversion system. Conversely, when the Fast ADX is below the Slow ADX, price is likelier to be ranging so this is the only time when the algorithm is allowed to trade.
II. Bollinger Bands
When allowed to trade by the Trend Filter, the algorithm uses the Bollinger Bands indicator to enter long and short positions. The Bolliger Bands indicator has a look-back period of 20 and a standard deviation of 1.5 for both upper and lower bands. When price crosses over the lower band, a Long Signal is generated and a long position is entered. When price crosses under the upper band, a Short Signal is generated and a short position is entered.
III. Money Management
Rule 1 - Each trade will use a limit order for a fixed quantity of 50,000 contracts (0.50 lot). The only exception is Rule
Rule 2 - Order pyramiding is enabled and up to 10 consecutive orders of the same signal can be executed (for example: 14 consecutive Long Signals are generated over 8 hours and the algorithm sends in 10 different buy orders at various prices for a total of 350,000 contracts).
Rule 3 - Every order will include a bracket with both TP and SL set at 50 pips (note: the algorithm only closes the current open position and does not enter the opposite trade once a TP or SL has been hit).
Rule 4 - When a new opposite trade signal is generated, the algorithm sends in a larger order to close the current open position as well as open a new one (for example: 14 consecutive Long Signals are generated over 8 hours and the algorithm sends in 10 different buy orders at various prices for a total of 350,000 contracts. A Short Signal is generated shortly after the 14th Long Signal. The algorithm then sends in a sell order for 400,000 contracts to close the 350,000 contracts long position and open a new short position of 50,000 contracts).

My5min1. Follow the instructions for entry and exit exactly as above. Don’t second guess, or assume/presume anything.
2. Avoid entering the trade when the price is temporarily above /below 10 day MA, but the price candle hasn’t fully formed yet. Enter the trade only after the price candle closes above/below the 10 day MA.
3. Exit the trade immediately when the price candle closes above/below 10 day MA in the direction opposite to the trade. Don’t remain in the trade wishing it to turn in your favor.
4. Never ever trade in the opposite direction of the market. i.e. don’t buy when the price is below 200 day MA and sell when the price is above 200 day MA.
5. Take profits when limit is reached. Don’t be greedy and keep on increasing the target. Remember- A bird in hand is worth two in the bush.

MACD, backtest 2015+ only, cut in half and doubledThis is only a slight modification to the existing "MACD Strategy" strategy plugin!
found the default MACD strategy to be lacking, although impressive for its simplicity. I added "year>2014" to the IF buy/sell conditions so it will only backtest from 2015 and beyond ** .
I also had a problem with the standard MACD trading late, per se. To that end I modified the inputs for fast/slow/signal to double. Example: my defaults are 10, 21, 10 so I put 20, 42, 20 in. This has the effect of making a 30min interval the same as 1 hour at 10,21,10. So if you want to backtest at 4hr, you would set your time interval to 2hr on the main chart. This is a handy way to make shorter time periods more useful even regardless of strategy/testing, since you can view 15min with alot less noise but a better response.
Used on BTCCNY OKcoin, with the chart set at 45 min (so really 90min in the strategy) this gave me a percent profitable of 42% and a profit factor of 1.998 on 189 trades.
Personally, I like to set the length/signals to 30,63,30. Meaning you need to triple the time, it allows for much better use of shorter time periods and the backtests are remarkably profitable. (i.e. 15min chart view = 45min on script, 30min= 1.5hr on script)
** If you want more specific time periods you need to try plugging in different bar values: replace "year" with "n" and "2014" with "5500". The bars are based on unix time I believe so you will need to play around with the number for n, with n being the numbers of bars.

Dual Session Range Boxes with FIB Lines█ OVERVIEW
The Dual Session Range Boxes with FIB Lines indicator is a powerful tool for identifying and visualizing Range Breakout or Inside Boxes Strategy setups with dual session tracking, customizable Fibonacci extensions, and trade zone levels. Perfect for traders who focus on session-based strategies across multiple markets.
█ FEATURES
◆ DUAL SESSION RANGES
- Range 1: Defines the Range (ORB) based on a specific time window
- Range 2: Extends the Range levels throughout a second session for trade management
- Both ranges can be independently configured with preset sessions or custom times
◆ SESSION PRESETS
- Tokyo Session (00:00 - 09:00)
- London Session (08:00 - 17:00)
- New York Session (14:00 - 21:00)
- Pre Market Session (10:00 - 15:30)
- Custom Time: Define your own session windows
◆ FIBONACCI EXTENSION LEVELS
- Automatically calculated from Range 1 High/Low
- Buy Side Levels: Projected above the range (green)
- Sell Side Levels: Projected below the range (red)
- 10 customizable Fib levels with individual on/off toggles:
- 23.6%, 38.2%, 50%, 61.8%, 78.6%, 100%, 127.2%, 161.8%, 200%, 261.8%
- Special color highlighting for key levels (50%, 100%, 200%)
- All percentage values are fully editable
◆ INSIDE TRADE ZONES
- Two horizontal lines drawn inside the Range 1 box
- Configurable percentage from High/Low (default: 10%)
- Helps identify premium/discount zones within the range
◆ LABELS & DISPLAY OPTIONS
- Show/hide price values on labels
- Show/hide percentage values on labels
- Adjustable label size (Tiny, Small, Normal, Large, Huge)
- Configurable label offset (distance above lines)
- Multiple rounding options for price display:
- 0.25 (quarter points - ideal for indices)
- 0.1 (tenth points)
- 0.01 (two decimals)
◆ STYLE CUSTOMIZATION
- Independent fill and border colors for both ranges
- Adjustable border width (1-5)
- Line style options: Solid, Dashed, Dotted
- Separate color settings for:
- Buy side Fibonacci levels
- Sell side Fibonacci levels
- Trade zone lines
- Special levels (50%, 100%, 200%)
◆ HISTORICAL DATA CONTROL
- Toggle to show/hide historical sessions
- Current session always remains visible
- Clean chart view when analyzing only the active session
█ HOW TO USE
1. Set your timezone in General settings
2. Configure Range 1 to capture your desired Opening Range period
3. Configure Range 2 to define how long levels should extend
4. Adjust Fibonacci levels based on your trading strategy
5. Use Trade Zones to identify key areas within the range
6. Toggle historical data on/off based on your analysis needs
█ USE CASES
- Opening Range Breakout (ORB) strategies
- Session-based trading (London, New York, Tokyo, Pre-Market)
- Fibonacci extension targets for breakout trades
- Identifying support/resistance from session ranges
- Multi-session analysis and confluence zones
█ NOTES
- Indicator works on timeframes lower than Daily
- All times are based on the selected timezone setting
- Range 2 only activates after Range 1 completes
- Fibonacci levels extend from Range 1 start to Range 2 end
Let me know if you like to have any enhancements.
Leave a like if you like it!

Gyspy Bot Trade Engine - V1.2B - Alerts - 12-7-25 - SignalLynxGypsy Bot Trade Engine (MK6 V1.2B) - Alerts & Visualization
Brought to you by Signal Lynx | Automation for the Night-Shift Nation 🌙
1. Executive Summary & Architecture
Gypsy Bot (MK6 V1.2B) is not merely a strategy; it is a massive, modular Trade Engine built specifically for the TradingView Pine Script V6 environment. While most tools rely on a single dominant indicator to generate signals, Gypsy Bot functions as a sophisticated Consensus Algorithm.
Note: This is the Indicator / Alerts version of the engine. It is designed for visual analysis and generating live alert signals for automation. If you wish to see Backtest data (Equity Curves, Drawdown, Profit Factors), please use the Strategy version of this script.
The engine calculates data from up to 12 distinct Technical Analysis Modules simultaneously on every bar closing. It aggregates these signals into a "Vote Count" and only fires a signal plot when a user-defined threshold of concurring signals is met. This "Voting System" acts as a noise filter, requiring multiple independent mathematical models—ranging from volume flow and momentum to cyclical harmonics and trend strength—to agree on market direction.
Beyond entries, Gypsy Bot features a proprietary Risk Management suite called the Dump Protection Team (DPT). This logic layer operates independently of the entry modules, specifically scanning for "Moon" (Parabolic) or "Nuke" (Crash) volatility events to signal forced exits, preserving capital during Black Swan events.
2. ⚠️ The Philosophy of "Curve Fitting" (Must Read)
One must be careful when applying Gypsy Bot to new pairs or charts.
To be fully transparent: Gypsy Bot is, by definition, a very advanced curve-fitting engine. Because it grants the user granular control over 12 modules, dozens of thresholds, and specific voting requirements, it is extremely easy to "over-fit" the data. You can easily toggle switches until the charts look perfect in hindsight, only to have the signals fail in live markets because they were tuned to historical noise rather than market structure.
To use this engine successfully:
Visual Verification: Do not just look for "green arrows." Look for signals that occur at logical market structure points.
Stability: Ensure signals are not flickering. This script uses closed-candle logic for key decisions to ensure that once a signal plots, it remains painted.
Regular Maintenance is Mandatory: Markets shift regimes (e.g., from Bull Trend to Crab Range). Gypsy Bot settings should be reviewed and adjusted at regular intervals to ensure the voting logic remains aligned with current market volatility.
Timeframe Recommendations:
Gypsy Bot is optimized for High Time Frame (HTF) trend following. It generally produces the most reliable results on charts ranging from 1-Hour to 12-Hours, with the 4-Hour timeframe historically serving as the "sweet spot" for most major cryptocurrency assets.
3. The Voting Mechanism: How Entries Are Generated
The heart of the Gypsy Bot engine is the ActivateOrders input (found in the "Order Signal Modifier" settings).
The engine constantly monitors the output of all enabled Modules.
Long Votes: GoLongCount
Short Votes: GoShortCount
If you have 10 Modules enabled, and you set ActivateOrders to 7:
The engine will ONLY plot a Buy Signal if 7 or more modules return a valid "Buy" signal on the same closed candle.
If only 6 modules agree, the signal is rejected.
4. Technical Deep Dive: The 12 Modules
Gypsy Bot allows you to toggle the following modules On/Off individually to suit the asset you are trading.
Module 1: Modified Slope Angle (MSA)
Logic: Calculates the geometric angle of a moving average relative to the timeline.
Function: Filters out "lazy" trends. A trend is only considered valid if the slope exceeds a specific steepness threshold.
Module 2: Correlation Trend Indicator (CTI)
Logic: Measures how closely the current price action correlates to a straight line (a perfect trend).
Function: Ensures that we are moving up with high statistical correlation, reducing fake-outs.
Module 3: Ehlers Roofing Filter
Logic: A spectral filter combining High-Pass (trend removal) and Super Smoother (noise removal).
Function: Isolates the "Roof" of price action to catch cyclical turning points before standard moving averages.
Module 4: Forecast Oscillator
Logic: Uses Linear Regression forecasting to predict where price "should" be relative to where it is.
Function: Signals when the regression trend flips. Offers "Aggressive" and "Conservative" calculation modes.
Module 5: Chandelier ATR Stop
Logic: A volatility-based trend follower that hangs a "leash" (ATR multiple) from extremes.
Function: Used as an entry filter. If price is above the Chandelier line, the trend is Bullish.
Module 6: Crypto Market Breadth (CMB)
Logic: Pulls data from multiple major tickers (BTC, ETH, and Perpetual Contracts).
Function: Calculates "Market Health." If Bitcoin is rising but the rest of the market is dumping, this module can veto a trade.
Module 7: Directional Index Convergence (DIC)
Logic: Analyzes the convergence/divergence between Fast and Slow Directional Movement indices.
Function: Identifies when trend strength is expanding.
Module 8: Market Thrust Indicator (MTI)
Logic: A volume-weighted breadth indicator using Advance/Decline and Volume data.
Function: One of the most powerful modules. Confirms that price movement is supported by actual volume flow. Recommended setting: "SSMA" (Super Smoother).
Module 9: Simple Ichimoku Cloud
Logic: Traditional Japanese trend analysis.
Function: Checks for a "Kumo Breakout." Price must be fully above/below the Cloud to confirm entry.
Module 10: Simple Harmonic Oscillator
Logic: Analyzes harmonic wave properties to detect cyclical tops and bottoms.
Function: Serves as a counter-trend or early-reversal detector.
Module 11: HSRS Compression / Super AO
Logic: Detects volatility compression (HSRS) or Momentum/Trend confluence (Super AO).
Function: Great for catching explosive moves resulting from consolidation.
Module 12: Fisher Transform (MTF)
Logic: Converts price data into a Gaussian normal distribution.
Function: Identifies extreme price deviations. Uses Multi-Timeframe (MTF) logic to ensure you aren't trading against the major trend.
5. Global Inhibitors (The Veto Power)
Even if 12 out of 12 modules vote "Buy," Gypsy Bot performs a final safety check using Global Inhibitors.
Bitcoin Halving Logic: Prevents trading during chaotic weeks surrounding Halving events (dates projected through 2040).
Miner Capitulation: Uses Hash Rate Ribbons to identify bearish regimes when miners are shutting down.
ADX Filter: Prevents trading in "Flat/Choppy" markets (Low ADX).
CryptoCap Trend: Checks the total Crypto Market Cap chart for broad market alignment.
6. Risk Management & The Dump Protection Team (DPT)
Even in this Indicator version, the RM logic runs to generate Exit Signals.
Dump Protection Team (DPT): Detects "Nuke" (Crash) or "Moon" (Pump) volatility signatures. If triggered, it plots an immediate Exit Signal (Yellow Plot).
Advanced Adaptive Trailing Stop (AATS): Dynamically tightens stops in low volatility ("Dungeon") and loosens them in high volatility ("Penthouse").
Staged Take Profits: Plots TP1, TP2, and TP3 events on the chart for visual confirmation or partial exit alerts.
7. Recommended Setup Guide
When applying Gypsy Bot to a new chart, follow this sequence:
Set Timeframe: 4 Hours (4H).
Tune DPT: Adjust "Dump/Moon Protection" inputs first. These filter out bad signals during high volatility.
Tune Module 8 (MTI): Experiment with the MA Type (SSMA is recommended).
Select Modules: Enable/Disable modules based on the asset's personality (Trending vs. Ranging).
Voting Threshold: Adjust ActivateOrders to filter out noise.
Alert Setup: Once visually satisfied, use the "Any Alert Function Call" option when creating an alert in TradingView to capture all Buy/Sell/Close events generated by the engine.
8. Technical Specs
Engine Version: Pine Script V6
Repainting: This indicator uses Closed Candle data for all Risk Management and Entry decisions. This ensures that signals do not vanish after the candle closes.
Visuals:
Blue Plot: Buy/Sell Signal.
Yellow Plot: Risk Management (RM) / DPT Close Signal.
Green/Lime/Olive Plots: Take Profit hits.
Disclaimer:
This script is a complex algorithmic tool for market analysis. Past performance is not indicative of future results. Cryptocurrency trading involves substantial risk of loss. Use this tool to assist your own decision-making, not to replace it.
9. About Signal Lynx
Automation for the Night-Shift Nation 🌙
Signal Lynx focuses on helping traders and developers bridge the gap between indicator logic and real-world automation. The same RM engine you see here powers multiple internal systems and templates, including other public scripts like the Super-AO Strategy with Advanced Risk Management.
We provide this code open source under the Mozilla Public License 2.0 (MPL-2.0) to:
Demonstrate how Adaptive Logic and structured Risk Management can outperform static, one-layer indicators
Give Pine Script users a battle-tested RM backbone they can reuse, remix, and extend
If you are looking to automate your TradingView strategies, route signals to exchanges, or simply want safer, smarter strategy structures, please keep Signal Lynx in your search.
License: Mozilla Public License 2.0 (Open Source).
If you make beneficial modifications, please consider releasing them back to the community so everyone can benefit.

Gyspy Bot Trade Engine - V1.2B - Strategy 12-7-25 - SignalLynxGypsy Bot Trade Engine (MK6 V1.2B) - Ultimate Strategy & Backtest
Brought to you by Signal Lynx | Automation for the Night-Shift Nation 🌙
1. Executive Summary & Architecture
Gypsy Bot (MK6 V1.2B) is not merely a strategy; it is a massive, modular Trade Engine built specifically for the TradingView Pine Script environment. While most strategies rely on a single dominant indicator (like an RSI cross or a MACD flip) to generate signals, Gypsy Bot functions as a sophisticated Consensus Algorithm.
The engine calculates data from up to 12 distinct Technical Analysis Modules simultaneously on every bar closing. It aggregates these signals into a "Vote Count" and only executes a trade entry when a user-defined threshold of concurring signals is met. This "Voting System" acts as a noise filter, requiring multiple independent mathematical models—ranging from volume flow and momentum to cyclical harmonics and trend strength—to agree on market direction before capital is committed.
Beyond entries, Gypsy Bot features a proprietary Risk Management suite called the Dump Protection Team (DPT). This logic layer operates independently of the entry modules, specifically scanning for "Moon" (Parabolic) or "Nuke" (Crash) volatility events to force-exit positions, overriding standard stops to preserve capital during Black Swan events.
2. ⚠️ The Philosophy of "Curve Fitting" (Must Read)
One must be careful when applying Gypsy Bot to new pairs or charts.
To be fully transparent: Gypsy Bot is, by definition, a very advanced curve-fitting engine. Because it grants the user granular control over 12 modules, dozens of thresholds, and specific voting requirements, it is extremely easy to "over-fit" the data. You can easily toggle switches until the backtest shows a 100% win rate, only to have the strategy fail immediately in live markets because it was tuned to historical noise rather than market structure.
To use this engine successfully, you must adopt a specific optimization mindset:
Ignore Raw Net Profit: Do not tune for the highest dollar amount. A strategy that makes $1M in the backtest but has a 40% drawdown is useless.
Prioritize Stability: Look for a high Profit Factor (1.5+), a high Percent Profitable, and a smooth equity curve.
Regular Maintenance is Mandatory: Markets shift regimes (e.g., from Bull Trend to Crab Range). Parameters that worked perfectly in 2021 may fail in 2024. Gypsy Bot settings should be reviewed and adjusted at regular intervals (e.g., quarterly) to ensure the voting logic remains aligned with current market volatility.
Timeframe Recommendations:
Gypsy Bot is optimized for High Time Frame (HTF) trend following. It generally produces the most reliable results on charts ranging from 1-Hour to 12-Hours, with the 4-Hour timeframe historically serving as the "sweet spot" for most major cryptocurrency assets.
3. The Voting Mechanism: How Entries Are Generated
The heart of the Gypsy Bot engine is the ActivateOrders input (found in the "Order Signal Modifier" settings).
The engine constantly monitors the output of all enabled Modules.
Long Votes: GoLongCount
Short Votes: GoShortCount
If you have 10 Modules enabled, and you set ActivateOrders to 7:
The engine will ONLY trigger a Buy Entry if 7 or more modules return a valid "Buy" signal on the same closed candle.
If only 6 modules agree, the trade is rejected.
This allows you to mix "Leading" indicators (Oscillators) with "Lagging" indicators (Moving Averages) to create a high-probability entry signal that requires momentum, volume, and trend to all be in alignment.
4. Technical Deep Dive: The 12 Modules
Gypsy Bot allows you to toggle the following modules On/Off individually to suit the asset you are trading.
Module 1: Modified Slope Angle (MSA)
Logic: Calculates the geometric angle of a moving average relative to the timeline.
Function: It filters out "lazy" trends. A trend is only considered valid if the slope exceeds a specific steepness threshold. This helps avoid entering trades during weak drifts that often precede a reversal.
Module 2: Correlation Trend Indicator (CTI)
Logic: Based on John Ehlers' work, this measures how closely the current price action correlates to a straight line (a perfect trend).
Function: It outputs a confidence score (-1 to 1). Gypsy Bot uses this to ensure that we are not just moving up, but moving up with high statistical correlation, reducing fake-outs.
Module 3: Ehlers Roofing Filter
Logic: A sophisticated spectral filter that combines a High-Pass filter (to remove long-term drift) with a Super Smoother (to remove high-frequency noise).
Function: It attempts to isolate the "Roof" of the price action. It is excellent at catching cyclical turning points before standard moving averages react.
Module 4: Forecast Oscillator
Logic: Uses Linear Regression forecasting to predict where price "should" be relative to where it is.
Function: When the Forecast Oscillator crosses its zero line, it indicates that the regression trend has flipped. We offer both "Aggressive" and "Conservative" calculation modes for this module.
Module 5: Chandelier ATR Stop
Logic: A volatility-based trend follower that hangs a "leash" (ATR multiple) from the highest high (for longs) or lowest low (for shorts).
Function: Used here as an entry filter. If price is above the Chandelier line, the trend is Bullish. It also includes a "Bull/Bear Qualifier" check to ensure structural support.
Module 6: Crypto Market Breadth (CMB)
Logic: This is a macro-filter. It pulls data from multiple major tickers (BTC, ETH, and Perpetual Contracts) across different exchanges.
Function: It calculates a "Market Health" percentage. If Bitcoin is rising but the rest of the market is dumping, this module can veto a trade, ensuring you don't buy into a "fake" rally driven by a single asset.
Module 7: Directional Index Convergence (DIC)
Logic: Analyzes the convergence/divergence between Fast and Slow Directional Movement indices.
Function: Identifies when trend strength is expanding. A buy signal is generated only when the positive directional movement overpowers the negative movement with expanding momentum.
Module 8: Market Thrust Indicator (MTI)
Logic: A volume-weighted breadth indicator. It uses Advance/Decline data and Up/Down Volume data.
Function: This is one of the most powerful modules. It confirms that price movement is supported by actual volume flow. We recommend using the "SSMA" (Super Smoother) MA Type for the cleanest signals on the 4H chart.
Module 9: Simple Ichimoku Cloud
Logic: Traditional Japanese trend analysis using the Tenkan-sen and Kijun-sen.
Function: Checks for a "Kumo Breakout." Price must be fully above the Cloud (for longs) or below it (for shorts). This is a classic "trend confirmation" module.
Module 10: Simple Harmonic Oscillator
Logic: Analyzes the harmonic wave properties of price action to detect cyclical tops and bottoms.
Function: Serves as a counter-trend or early-reversal detector. It tries to identify when a cycle has bottomed out (for buys) or topped out (for sells) before the main trend indicators catch up.
Module 11: HSRS Compression / Super AO
Logic: Two options in one.
HSRS: Hirashima Sugita Resistance Support. Detects volatility compression (squeezes) relative to dynamic support/resistance bands.
Super AO: A combination of the Awesome Oscillator and SuperTrend logic.
Function: Great for catching explosive moves that result from periods of low volatility (consolidation).
Module 12: Fisher Transform (MTF)
Logic: Converts price data into a Gaussian normal distribution.
Function: Identifies extreme price deviations. This module uses Multi-Timeframe (MTF) logic to look at higher-timeframe trends (e.g., looking at the Daily Fisher while trading the 4H chart) to ensure you aren't trading against the major trend.
5. Global Inhibitors (The Veto Power)
Even if 12 out of 12 modules vote "Buy," Gypsy Bot performs a final safety check using Global Inhibitors. If any of these are triggered, the trade is blocked.
Bitcoin Halving Logic:
Hardcoded dates for past and projected future Bitcoin halvings (up to 2040).
Trading is inhibited or restricted during the chaotic weeks immediately surrounding a Halving event to avoid volatility crushes.
Miner Capitulation:
Uses Hash Rate Ribbons (Moving averages of Hash Rate).
If miners are capitulating (Shutting down rigs due to unprofitability), the engine flags a "Bearish" regime and can flip logic to Short-only or flat.
ADX Filter (Flat Market Protocol):
If the Average Directional Index (ADX) is below a specific threshold (e.g., 20), the market is deemed "Flat/Choppy." The bot will refuse to open trend-following trades in a flat market.
CryptoCap Trend:
Checks the total Crypto Market Cap chart. If the broad market is in a downtrend, it can inhibit Long entries on individual altcoins.
6. Risk Management & The Dump Protection Team (DPT)
Gypsy Bot separates "Entry Logic" from "Risk Management Logic."
Dump Protection Team (DPT)
This is a specialized logic branch designed to save the account during Black Swan events.
Nuke Protection: If the DPT detects a volatility signature consistent with a flash crash, it overrides all other logic and forces an immediate exit.
Moon Protection: If a parabolic pump is detected that violates statistical probability (Bollinger deviations), DPT can force a profit take before the inevitable correction.
Advanced Adaptive Trailing Stop (AATS)
Unlike a static trailing stop (e.g., "trail by 5%"), AATS is dynamic.
Penthouse Level: If price is at the top of the HSRS channel (High Volatility), the stop loosens to allow for wicks.
Dungeon Level: If price is compressed at the bottom, the stop tightens to protect capital.
Staged Take Profits
TP1: Scalp a portion (e.g., 10%) to cover fees and secure a win.
TP2: Take the bulk of profit.
TP3: Leave a "Runner" position with a loose trailing stop to catch "Moon" moves.
7. Recommended Setup Guide
When applying Gypsy Bot to a new chart, follow this sequence:
Set Timeframe: 4 Hours (4H).
Reset: Turn OFF Trailing Stop, Stop Loss, and Take Profits. (We want to see raw entry performance first).
Tune DPT: Adjust "Dump/Moon Protection" inputs first. These have the highest impact on net performance.
Tune Module 8 (MTI): This module is a heavy filter. Experiment with the MA Type (SSMA is recommended).
Select Modules: Enable/Disable modules 1-12 based on the asset's personality (Trending vs. Ranging).
Voting Threshold: Adjust ActivateOrders. A lower number = More Trades (Aggressive). A higher number = Fewer, higher conviction trades (Conservative).
Final Polish: Re-enable Stop Losses, Trailing Stops, and Staged Take Profits to smooth the equity curve and define your max risk per trade.
8. Technical Specs
Engine Version: Pine Script V6
Repainting: This strategy uses Closed Candle data for all Risk Management and Entry decisions. This ensures that Backtest results align closely with real-time behavior (no repainting of historical signals).
Alerts: This script generates Strategy alerts. If you require visual-only alerts, see the source code header for instructions on switching to "Study" (Indicator) mode.
Disclaimer:
This script is a complex algorithmic tool for market analysis. Past performance is not indicative of future results. Use this tool to assist your own decision-making, not to replace it.
9. About Signal Lynx
Automation for the Night-Shift Nation 🌙
Signal Lynx focuses on helping traders and developers bridge the gap between indicator logic and real-world automation. The same RM engine you see here powers multiple internal systems and templates, including other public scripts like the Super-AO Strategy with Advanced Risk Management.
We provide this code open source under the Mozilla Public License 2.0 (MPL-2.0) to:
Demonstrate how Adaptive Logic and structured Risk Management can outperform static, one-layer indicators
Give Pine Script users a battle-tested RM backbone they can reuse, remix, and extend
If you are looking to automate your TradingView strategies, route signals to exchanges, or simply want safer, smarter strategy structures, please keep Signal Lynx in your search.
License: Mozilla Public License 2.0 (Open Source).
If you make beneficial modifications, please consider releasing them back to the community so everyone can benefit.

猛の掟・初動スクリーナー v3//@version=5
indicator("猛の掟・初動スクリーナー v3", overlay=true)
// ===============================
// 1. 移動平均線(EMA)設定
// ===============================
ema5 = ta.ema(close, 5)
ema13 = ta.ema(close, 13)
ema26 = ta.ema(close, 26)
plot(ema5, title="EMA5", color=color.orange, linewidth=2)
plot(ema13, title="EMA13", color=color.new(color.blue, 0), linewidth=2)
plot(ema26, title="EMA26", color=color.new(color.gray, 0), linewidth=2)
// ===============================
// 2. MACD(10,26,9)設定
// ===============================
fast = ta.ema(close, 10)
slow = ta.ema(close, 26)
macd = fast - slow
signal = ta.ema(macd, 9)
macdBull = ta.crossover(macd, signal)
// ===============================
// 3. 初動判定ロジック
// ===============================
// ゴールデン並び条件
goldenAligned = ema5 > ema13 and ema13 > ema26
// ローソク足が26EMAより上
priceAbove26 = close > ema26
// 3条件すべて満たすと「確」
bullEntry = goldenAligned and priceAbove26 and macdBull
// ===============================
// 4. スコア(0=なし / 1=猛 / 2=確)
// ===============================
score = bullEntry ? 2 : (goldenAligned ? 1 : 0)
// ===============================
// 5. スコアの色分け
// ===============================
scoreColor = score == 2 ? color.new(color.yellow, 0) : score == 1 ? color.new(color.lime, 0) : color.new(color.gray, 80)
// ===============================
// 6. スコア表示(カラム)
// ===============================
plot(score,
title="猛スコア (0=なし,1=猛,2=確)",
style=plot.style_columns,
color=scoreColor,
linewidth=3)
// 目安ライン
hline(0, "なし", color=color.new(color.gray, 80))
hline(1, "猛", color=color.new(color.lime, 60))
hline(2, "確", color=color.new(color.yellow, 60))
// ===============================
// 7. チャート上に「確」ラベル
// ===============================
plotshape(score == 2,
title="初動確定",
style=shape.labelup,
text="確",
color=color.yellow,
textcolor=color.black,
size=size.tiny,
location=location.belowbar)
MC² Pullback Screener v1.01//@version=5
indicator("MC² Pullback Screener v1.01", overlay=false)
//----------------------------------------------------
// 🔹 PARAMETERS
//----------------------------------------------------
lenTrend = input.int(20, "SMA Trend Length")
relVolLookback = input.int(10, "Relative Volume Lookback")
minRelVol = input.float(0.7, "Min Relative Volume on Pullback")
maxSpikeVol = input.float(3.5, "Max Spike Vol (Reject News Bars)")
pullbackBars = input.int(3, "Pullback Lookback Bars")
//----------------------------------------------------
// 🔹 DATA
//----------------------------------------------------
// Moving averages for trend direction
sma20 = ta.sma(close, lenTrend)
sma50 = ta.sma(close, 50)
// Relative Volume
volAvg = ta.sma(volume, relVolLookback)
relVol = volume / volAvg
// Trend condition
uptrend = close > sma20 and sma20 > sma50
//----------------------------------------------------
// 🔹 BREAKOUT + PULLBACK LOGIC
//----------------------------------------------------
// Recent breakout reference
recentHigh = ta.highest(close, 10)
isBreakout = close > recentHigh
// Pullback logic
nearSupport = close > recentHigh * 0.98 and close < recentHigh * 1.02
lowVolPullback = relVol < minRelVol
// Reject single-bar news spike
rejectSpike = relVol > maxSpikeVol
//----------------------------------------------------
// 🔹 ENTRY SIGNAL
//----------------------------------------------------
pullbackSignal = uptrend and lowVolPullback and nearSupport and not rejectSpike
//----------------------------------------------------
// 🔹 SCREENER OUTPUT
//----------------------------------------------------
// Pine Screener expects a plot output
plot(pullbackSignal ? 1 : 0, title="MC² Pullback Signal", style=plot.style_columns, color=pullbackSignal ? color.green : color.black)

XAUUSD 1m SMC Zones (BOS + Flexible TP Modes + Trailing Runner)//@version=6
strategy("XAUUSD 1m SMC Zones (BOS + Flexible TP Modes + Trailing Runner)",
overlay = true,
initial_capital = 10000,
pyramiding = 10,
process_orders_on_close = true)
//━━━━━━━━━━━━━━━━━━━
// 1. INPUTS
//━━━━━━━━━━━━━━━━━━━
// TP / SL
tp1Pips = input.int(10, "TP1 (pips)", minval = 1)
fixedSLpips = input.int(50, "Fixed SL (pips)", minval = 5)
runnerRR = input.float(3.0, "Runner RR (TP2 = SL * RR)", step = 0.1, minval = 1.0)
// Daily risk
maxDailyLossPct = input.float(5.0, "Max daily loss % (stop trading)", step = 0.5)
maxDailyProfitPct = input.float(20.0, "Max daily profit % (stop trading)", step = 1.0)
// HTF S/R (1H)
htfTF = input.string("60", "HTF timeframe (minutes) for S/R block")
// Profit strategy (Option C)
profitStrategy = input.string("Minimal Risk | Full BE after TP1", "Profit Strategy", options = )
// Runner stop mode (your option 4)
runnerStopMode = input.string( "BE only", "Runner Stop Mode", options = )
// ATR trail settings (only used if ATR mode selected)
atrTrailLen = input.int(14, "ATR Length (trail)", minval = 1)
atrTrailMult = input.float(1.0, "ATR Multiplier (trail)", step = 0.1, minval = 0.1)
// Pip size (for XAUUSD: 1 pip = 0.10 if tick = 0.01)
pipSize = syminfo.mintick * 10.0
tp1Points = tp1Pips * pipSize
slPoints = fixedSLpips * pipSize
baseQty = input.float (1.0, "Base order size" , step = 0.01, minval = 0.01)
//━━━━━━━━━━━━━━━━━━━
// 2. DAILY RISK MANAGEMENT
//━━━━━━━━━━━━━━━━━━━
isNewDay = ta.change(time("D")) != 0
var float dayStartEquity = na
var bool dailyStopped = false
equityNow = strategy.initial_capital + strategy.netprofit
if isNewDay or na(dayStartEquity)
dayStartEquity := equityNow
dailyStopped := false
dailyPnL = equityNow - dayStartEquity
dailyPnLPct = dayStartEquity != 0 ? (dailyPnL / dayStartEquity) * 100.0 : 0.0
if not dailyStopped
if dailyPnLPct <= -maxDailyLossPct
dailyStopped := true
if dailyPnLPct >= maxDailyProfitPct
dailyStopped := true
canTradeToday = not dailyStopped
//━━━━━━━━━━━━━━━━━━━
// 3. 1H S/R ZONES (for direction block)
//━━━━━━━━━━━━━━━━━━━
htOpen = request.security(syminfo.tickerid, htfTF, open)
htHigh = request.security(syminfo.tickerid, htfTF, high)
htLow = request.security(syminfo.tickerid, htfTF, low)
htClose = request.security(syminfo.tickerid, htfTF, close)
// Engulf logic on HTF
htBullPrev = htClose > htOpen
htBearPrev = htClose < htOpen
htBearEngulf = htClose < htOpen and htBullPrev and htOpen >= htClose and htClose <= htOpen
htBullEngulf = htClose > htOpen and htBearPrev and htOpen <= htClose and htClose >= htOpen
// Liquidity sweep on HTF previous candle
htSweepHigh = htHigh > ta.highest(htHigh, 5)
htSweepLow = htLow < ta.lowest(htLow, 5)
// Store last HTF zones
var float htResHigh = na
var float htResLow = na
var float htSupHigh = na
var float htSupLow = na
if htBearEngulf and htSweepHigh
htResHigh := htHigh
htResLow := htLow
if htBullEngulf and htSweepLow
htSupHigh := htHigh
htSupLow := htLow
// Are we inside HTF zones?
inHtfRes = not na(htResHigh) and close <= htResHigh and close >= htResLow
inHtfSup = not na(htSupLow) and close >= htSupLow and close <= htSupHigh
// Block direction against HTF zones
longBlockedByZone = inHtfRes // no buys in HTF resistance
shortBlockedByZone = inHtfSup // no sells in HTF support
//━━━━━━━━━━━━━━━━━━━
// 4. 1m LOCAL ZONES (LIQUIDITY SWEEP + ENGULF + QUALITY SCORE)
//━━━━━━━━━━━━━━━━━━━
// 1m engulf patterns
bullPrev1 = close > open
bearPrev1 = close < open
bearEngulfNow = close < open and bullPrev1 and open >= close and close <= open
bullEngulfNow = close > open and bearPrev1 and open <= close and close >= open
// Liquidity sweep by previous candle on 1m
sweepHighPrev = high > ta.highest(high, 5)
sweepLowPrev = low < ta.lowest(low, 5)
// Local zone storage (one active support + one active resistance)
// Quality score: 1 = engulf only, 2 = engulf + sweep (we only trade ≥2)
var float supLow = na
var float supHigh = na
var int supQ = 0
var bool supUsed = false
var float resLow = na
var float resHigh = na
var int resQ = 0
var bool resUsed = false
// New resistance zone: previous bullish candle -> bear engulf
if bearEngulfNow
resLow := low
resHigh := high
resQ := sweepHighPrev ? 2 : 1
resUsed := false
// New support zone: previous bearish candle -> bull engulf
if bullEngulfNow
supLow := low
supHigh := high
supQ := sweepLowPrev ? 2 : 1
supUsed := false
// Raw "inside zone" detection
inSupRaw = not na(supLow) and close >= supLow and close <= supHigh
inResRaw = not na(resHigh) and close <= resHigh and close >= resLow
// QUALITY FILTER: only trade zones with quality ≥ 2 (engulf + sweep)
highQualitySup = supQ >= 2
highQualityRes = resQ >= 2
inSupZone = inSupRaw and highQualitySup and not supUsed
inResZone = inResRaw and highQualityRes and not resUsed
// Plot zones
plot(supLow, "Sup Low", color = color.new(color.lime, 60), style = plot.style_linebr)
plot(supHigh, "Sup High", color = color.new(color.lime, 60), style = plot.style_linebr)
plot(resLow, "Res Low", color = color.new(color.red, 60), style = plot.style_linebr)
plot(resHigh, "Res High", color = color.new(color.red, 60), style = plot.style_linebr)
//━━━━━━━━━━━━━━━━━━━
// 5. MODERATE BOS (3-BAR FRACTAL STRUCTURE)
//━━━━━━━━━━━━━━━━━━━
// 3-bar swing highs/lows
swHigh = high > high and high > high
swLow = low < low and low < low
var float lastSwingHigh = na
var float lastSwingLow = na
if swHigh
lastSwingHigh := high
if swLow
lastSwingLow := low
// BOS conditions
bosUp = not na(lastSwingHigh) and close > lastSwingHigh
bosDown = not na(lastSwingLow) and close < lastSwingLow
// Zone “arming” and BOS validation
var bool supArmed = false
var bool resArmed = false
var bool supBosOK = false
var bool resBosOK = false
// Arm zones when first touched
if inSupZone
supArmed := true
if inResZone
resArmed := true
// BOS after arming → zone becomes valid for entries
if supArmed and bosUp
supBosOK := true
if resArmed and bosDown
resBosOK := true
// Reset BOS flags when new zones are created
if bullEngulfNow
supArmed := false
supBosOK := false
if bearEngulfNow
resArmed := false
resBosOK := false
//━━━━━━━━━━━━━━━━━━━
// 6. ENTRY CONDITIONS (ZONE + BOS + RISK STATE)
//━━━━━━━━━━━━━━━━━━━
flatOrShort = strategy.position_size <= 0
flatOrLong = strategy.position_size >= 0
longSignal = canTradeToday and not longBlockedByZone and inSupZone and supBosOK and flatOrShort
shortSignal = canTradeToday and not shortBlockedByZone and inResZone and resBosOK and flatOrLong
//━━━━━━━━━━━━━━━━━━━
// 7. ORDER LOGIC – TWO PROFIT STRATEGIES
//━━━━━━━━━━━━━━━━━━━
// Common metrics
atrTrail = ta.atr(atrTrailLen)
// MINIMAL MODE: single trade, BE after TP1, optional trailing
// HYBRID MODE: two trades (Scalp @ TP1, Runner @ TP2)
// Persistent tracking
var float longEntry = na
var float longTP1 = na
var float longTP2 = na
var float longSL = na
var bool longBE = false
var float longRunEntry = na
var float longRunTP1 = na
var float longRunTP2 = na
var float longRunSL = na
var bool longRunBE = false
var float shortEntry = na
var float shortTP1 = na
var float shortTP2 = na
var float shortSL = na
var bool shortBE = false
var float shortRunEntry = na
var float shortRunTP1 = na
var float shortRunTP2 = na
var float shortRunSL = na
var bool shortRunBE = false
isMinimal = profitStrategy == "Minimal Risk | Full BE after TP1"
isHybrid = profitStrategy == "Hybrid | Scalp TP + Runner TP"
//━━━━━━━━━━ LONG ENTRIES ━━━━━━━━━━
if longSignal
if isMinimal
longEntry := close
longSL := longEntry - slPoints
longTP1 := longEntry + tp1Points
longTP2 := longEntry + slPoints * runnerRR
longBE := false
strategy.entry("Long", strategy.long)
supUsed := true
supArmed := false
supBosOK := false
else if isHybrid
longRunEntry := close
longRunSL := longRunEntry - slPoints
longRunTP1 := longRunEntry + tp1Points
longRunTP2 := longRunEntry + slPoints * runnerRR
longRunBE := false
// Two separate entries, each 50% of baseQty (for backtest)
strategy.entry("LongScalp", strategy.long, qty = baseQty * 0.5)
strategy.entry("LongRun", strategy.long, qty = baseQty * 0.5)
supUsed := true
supArmed := false
supBosOK := false
//━━━━━━━━━━ SHORT ENTRIES ━━━━━━━━━━
if shortSignal
if isMinimal
shortEntry := close
shortSL := shortEntry + slPoints
shortTP1 := shortEntry - tp1Points
shortTP2 := shortEntry - slPoints * runnerRR
shortBE := false
strategy.entry("Short", strategy.short)
resUsed := true
resArmed := false
resBosOK := false
else if isHybrid
shortRunEntry := close
shortRunSL := shortRunEntry + slPoints
shortRunTP1 := shortRunEntry - tp1Points
shortRunTP2 := shortRunEntry - slPoints * runnerRR
shortRunBE := false
strategy.entry("ShortScalp", strategy.short, qty = baseQty * 50)
strategy.entry("ShortRun", strategy.short, qty = baseQty * 50)
resUsed := true
resArmed := false
resBosOK := false
//━━━━━━━━━━━━━━━━━━━
// 8. EXIT LOGIC – MINIMAL MODE
//━━━━━━━━━━━━━━━━━━━
// LONG – Minimal Risk: 1 trade, BE after TP1, runner to TP2
if isMinimal and strategy.position_size > 0 and not na(longEntry)
// Move to BE once TP1 is touched
if not longBE and high >= longTP1
longBE := true
// Base SL: BE or initial SL
float dynLongSL = longBE ? longEntry : longSL
// Optional trailing after BE
if longBE
if runnerStopMode == "Structure trail" and not na(lastSwingLow) and lastSwingLow > longEntry
dynLongSL := math.max(dynLongSL, lastSwingLow)
if runnerStopMode == "ATR trail"
trailSL = close - atrTrailMult * atrTrail
dynLongSL := math.max(dynLongSL, trailSL)
strategy.exit("Long Exit", "Long", stop = dynLongSL, limit = longTP2)
// SHORT – Minimal Risk: 1 trade, BE after TP1, runner to TP2
if isMinimal and strategy.position_size < 0 and not na(shortEntry)
if not shortBE and low <= shortTP1
shortBE := true
float dynShortSL = shortBE ? shortEntry : shortSL
if shortBE
if runnerStopMode == "Structure trail" and not na(lastSwingHigh) and lastSwingHigh < shortEntry
dynShortSL := math.min(dynShortSL, lastSwingHigh)
if runnerStopMode == "ATR trail"
trailSLs = close + atrTrailMult * atrTrail
dynShortSL := math.min(dynShortSL, trailSLs)
strategy.exit("Short Exit", "Short", stop = dynShortSL, limit = shortTP2)
//━━━━━━━━━━━━━━━━━━━
// 9. EXIT LOGIC – HYBRID MODE
//━━━━━━━━━━━━━━━━━━━
// LONG – Hybrid: Scalp + Runner
if isHybrid
// Scalp leg: full TP at TP1
if strategy.opentrades > 0
strategy.exit("LScalp TP", "LongScalp", stop = longRunSL, limit = longRunTP1)
// Runner leg
if strategy.position_size > 0 and not na(longRunEntry)
if not longRunBE and high >= longRunTP1
longRunBE := true
float dynLongRunSL = longRunBE ? longRunEntry : longRunSL
if longRunBE
if runnerStopMode == "Structure trail" and not na(lastSwingLow) and lastSwingLow > longRunEntry
dynLongRunSL := math.max(dynLongRunSL, lastSwingLow)
if runnerStopMode == "ATR trail"
trailRunSL = close - atrTrailMult * atrTrail
dynLongRunSL := math.max(dynLongRunSL, trailRunSL)
strategy.exit("LRun TP", "LongRun", stop = dynLongRunSL, limit = longRunTP2)
// SHORT – Hybrid: Scalp + Runner
if isHybrid
if strategy.opentrades > 0
strategy.exit("SScalp TP", "ShortScalp", stop = shortRunSL, limit = shortRunTP1)
if strategy.position_size < 0 and not na(shortRunEntry)
if not shortRunBE and low <= shortRunTP1
shortRunBE := true
float dynShortRunSL = shortRunBE ? shortRunEntry : shortRunSL
if shortRunBE
if runnerStopMode == "Structure trail" and not na(lastSwingHigh) and lastSwingHigh < shortRunEntry
dynShortRunSL := math.min(dynShortRunSL, lastSwingHigh)
if runnerStopMode == "ATR trail"
trailRunSLs = close + atrTrailMult * atrTrail
dynShortRunSL := math.min(dynShortRunSL, trailRunSLs)
strategy.exit("SRun TP", "ShortRun", stop = dynShortRunSL, limit = shortRunTP2)
//━━━━━━━━━━━━━━━━━━━
// 10. RESET STATE WHEN FLAT
//━━━━━━━━━━━━━━━━━━━
if strategy.position_size == 0
longEntry := na
shortEntry := na
longBE := false
shortBE := false
longRunEntry := na
shortRunEntry := na
longRunBE := false
shortRunBE := false
//━━━━━━━━━━━━━━━━━━━
// 11. VISUAL ENTRY MARKERS
//━━━━━━━━━━━━━━━━━━━
plotshape(longSignal, title = "Long Signal", style = shape.triangleup,
location = location.belowbar, color = color.lime, size = size.tiny, text = "L")
plotshape(shortSignal, title = "Short Signal", style = shape.triangledown,
location = location.abovebar, color = color.red, size = size.tiny, text = "S")

Magic Moving AveragesThis indicator plots up to three adaptive “Magic MAs” plus a weighted combo line, with optional traditional SMAs for comparison.
Instead of averaging only closes, each Magic MA:
looks at the midpoints of highs/lows and opens/closes
decides whether recent behaviour favours the highs or the lows
builds a series of either highs or lows, then smooths it over your chosen length
You can run:
Short / Medium / Long Magic MAs
A weighted combo line (using 1–10 weights)
Optional traditional short/long SMAs on close
How I use it:
Price above the combo line → bullish bias
Price below the combo line → bearish bias
Short/medium/long Magic MAs together → dynamic support/resistance and trend structure
Traditional SMAs on for comparison with “classic” moving average behaviour
Inputs:
Magic MA lengths control how reactive vs smooth each regime is
Weights (1–10) let you emphasise short, medium or long regimes in the combo
This is a free / educational version of the Magic MAs.
It’s not financial advice – always manage your own risk.

SMC + OB + FVG + Reversal + UT Bot + Hull Suite – by Fatich.id🎯 7 INTEGRATED SYSTEMS:
✓ Mxwll Suite (SMC + Auto Fibs + CHoCH/BOS)
✓ UT Bot (Trend Signals + Label Management)
✓ Hull Suite (Momentum Analysis)
✓ LuxAlgo FVG (Fair Value Gaps)
✓ LuxAlgo Order Blocks (Volume Pivots) ⭐ NEW
✓ Three Bar Reversal (Pattern Recognition)
✓ Reversal Signals (Momentum Count Style)
⚡ KEY FEATURES:
• Smart Money Structure (CHoCH/BOS/I-CHoCH/I-BoS)
• Auto Fibonacci (10 customizable levels)
• Order Block Detection (Auto mitigation)
• Fair Value Gap Tracking
• Session Highlights (NY/London/Asia)
• Volume Activity Dashboard
• Multi-Timeframe Support
• Clean Label Management
🎨 PERFECT FOR:
• Smart Money Concept Traders
• Order Flow & Liquidity Analysis
• Support/Resistance Trading
• Trend Following & Reversals
• Multi-Timeframe Analysis
💡 RECOMMENDED SETTINGS:
Clean Charts: OB Count 3, UT Signals 3, FVG 5
Detailed Analysis: OB Count 5-10, All Signals
Scalping: Low sensitivity, Hull 20-30
Swing Trading: High sensitivity, Hull 55-100

CRR SELL BOX MICROWhat it analyzes
Multi-TF:
1m, 5m, 15m, 30m (tf1–tf4).
In each timeframe it looks at:
EMA 15 / 30 / 200 → trend.
MACD → momentum.
RSI → strength.
From this it derives:
t1, t2, t3, t4 = +1 bullish, -1 bearish, 0 neutral.
A bearScore = how many TFs are bearish → multiTfBear.
Volatility / momentum:
ATR in pips (atrPips) → checks for sufficient movement (sufAtr).
1m candlestick body in pips → momentumBear1
(large bearish candle + MACD bearish + RSI bearish).
Strong downward candle in ticks (bigDrop) → type of large vertical red candle.
Global sensitivity:
Mode: Normal / High / Turbo
Automatically adjusts:
Minimum drop in ticks,
Minimum candlestick body,
Minimum ATR.
2️⃣ Main Sell Signal
SELL WITHOUT PULLBACK 1m
sellNoPull:
EMA 15 < EMA 30 < EMA 200 (strong bearish trend 1m),
MACD crosses bearish,
Price below EMA30 1m.
Multi-TF Bear
multiTfBear:
Normal Mode: 1m bearish and 5m–15m–30m not bullish,
High/Turbo Mode: at least 2 bearish TFs (bearScore >= 2).
Final condition (what triggers the setup)
Conservative:
condSellConservative = sellNoPull + multiTfBear + sufAtr + momentumBear1
Aggressive:
condSellAggressive = (t1 == -1 or bigDrop) + 15m not bullish + sufAtr
Final:
condSellFinal
If aggressiveMicro = true → uses aggressive logic.
Otherwise → uses conservative logic.
When condSellFinal is true:
It is considered a valid sell setup for scalping / micro. 3️⃣ States it shows you
Depending on what it detects:
🔴 "MICRO SELL 10-20p"
(aggressive mode ON + everything aligned for a quick drop).
🟥 "SCALPING SELL"
(if you're in conservative mode).
🟧 "NORMAL SELL"
(multi-timeframe bearish but without a strong trigger).
⚪ "NEUTRAL (NO SELL)"
(no setup).
Extra info (below the light bulb):
"STRONG DROP" if there's a large red candlestick indicating a sharp decline.
"MULTI TF BEARISH" if several timeframes are bearish.
"NO SETUP" if conditions are not met.
4️⃣ HUD + Session Clock
Compact HUD at the top center:
Row 1: STATUS: MICRO SELL / NORMAL SELL / NEUTRAL.
Row 2: Light bulb ● (red, orange, or gray) + extra info text.
New York Clock:
Detects session: TOKYO / LONDON / NEW YORK
(for trading time context only).
5️⃣ Alerts
When condSellFinal is met, it triggers:
"CRR SCALPING/MICRO SELL - sell signal activated"
🧠 In simple terms:
It's your specialized SELL radar:
It combines multi-timeframe analysis, momentum, ATR, and strong bearish candlesticks to alert you when gold is ready for a quick 10-20 pip short trade or a more serious bearish scalp.
CRR BUY What it analyzes
4 timeframes:
1m, 5m, 15m, and 30m.
In each timeframe it looks at:
EMA 15 / 30 / 200 → trend.
MACD → momentum.
RSI → strength.
From this it derives:
t1, t2, t3, t4 = +1 bullish, -1 bearish, 0 neutral.
A multi-timeframe bullScore (how many timeframes are bullish).
2️⃣ Volatility / momentum filters
ATR in pips → checks if there is enough movement (suffAtr).
1m candlestick body in pips → momentumBull1
(strong bullish candle with bullish MACD + bullish RSI).
Strong upward candle (bigPump) measured in ticks/pips.
Sensitivity mode:
Normal / High / Turbo → loosens or tightens filters for:
Strong candle,
Minimum body,
Minimum ATR.
3️⃣ Buy logic
There are three levels:
condBuyConservative
CLASSIC BUY WITHOUT RETRACEMENT:
Strong 1m trend, bullish MACD crossover, price above EMA30, + 1m momentum, + sufficient ATR, + multi-timeframe bullish.
condBuyAggressive (if using aggressive mode):
It's enough to have:
1m bullish (t1 == 1) or bigPump,
15m not bearish,
Sufficient ATR.
condBuyFinal
If aggressiveMicro = true → uses condBuyAggressive.
Otherwise → uses condBuyConservative.
Based on this, it displays states:
✅ "MICRO BUY 10-20p" (aggressive mode ON and everything aligned)
✅ "SCALPING BUY" (conservative mode with confirmations)
✅ "NORMAL BUY" (multi-timeframe bullish but without a strong trigger)
⛔ "NEUTRAL (NO BUY)" (no setup)
And triggers an alert:
CRR SCALPING BUY when condBuyFinal is met.
4️⃣ HUD and sessions
Detects session by New York time:
TOKYO / LONDON / NEW YORK (different color). Compact HUD at the top center with:
STATUS (buy or neutral text),
Green/teal/gray light bulb icon (●),
Extra info:
"STRONG UPTREND" if there's a big pump,
"MULTI TF BULLISH" if many timeframes are bullish,
"NO SETUP" if there's nothing.
🧠 In simple terms:
It's a BUY ONLY bullish radar for scalping/micro trading, which combines multi-timeframe analysis + momentum + ATR + strong candlestick patterns, summarizes it in a HUD, and sends you an alert when there's a real setup to go long.Qué analiza
4 marcos de tiempo:
1m, 5m, 15m y 30m.
En cada TF mira:
EMA 15 / 30 / 200 → tendencia.
MACD → impulso.
RSI → fuerza.
De ahí saca:
t1, t2, t3, t4 = +1 toro, -1 oso, 0 neutro.
Un bullScore multi–TF (cuántos TF están alcistas).
2️⃣ Filtros de volatilidad / momentum
ATR en pips → comprueba si hay suficiente movimiento (sufAtr).
Cuerpo de la vela 1m en pips → momentumBull1
(vela alcista fuerte con MACD bull + RSI bull).
Vela de subida fuerte (bigPump) medida en ticks/pips.
Modo sensibilidad:
Normal / Alta / Turbo → relaja o endurece filtros de:
Vela fuerte,
Cuerpo mínimo,
ATR mínimo.
3️⃣ Lógica de compra
Hay tres niveles:
condBuyConservador
BUY SIN RETRO clásico:
Tendencia 1m fuerte, cruce MACD bull, precio sobre EMA30, + momentum 1m, + ATR ok, + multi–TF bull.
condBuyAgresivo (si usas modo agresivo):
Basta con:
1m toro (t1 == 1) o bigPump,
15m no bajista,
ATR suficiente.
condBuyFinal
Si aggressiveMicro = true → usa condBuyAgresivo.
Si no → usa condBuyConservador.
Según eso, muestra estados:
✅ "COMPRA MICRO 10-20p" (modo agresivo ON y todo alineado)
✅ "COMPRA SCALPING" (modo conservador con confirmaciones)
✅ "COMPRA NORMAL" (multi–TF alcista pero sin trigger fuerte)
⛔ "NEUTRO (NO COMPRA)" (no hay setup)
Y dispara alerta:
CRR COMPRA SCALPING cuando condBuyFinal se cumple.
4️⃣ HUD y sesiones
Detecta sesión por hora de New York:
TOKIO / LONDRES / NEW YORK (color distinto).
HUD compacto arriba al centro con:
ESTADO (texto de compra o neutro),
Bombillo (●) verde/teal/gris,
Info extra:
"SUBIDA FUERTE" si hay bigPump,
"MULTI TF ALCISTA" si muchos TF están bull,
"SIN SETUP" si no hay nada.
🧠 En simple:
Es un radar de COMPRA SOLO BULL para scalping/micro, que mezcla multi–TF + momentum + ATR + vela fuerte, te lo resume en un HUD y te manda alerta cuando hay setup real para disparar largo.

RiskCraft - Advanced Risk Management SystemRiskCraft – Risk Intelligence Dashboard
Trade like you actually respect risk
"I know the setup looks good… but how much am I actually risking right now?"
RiskCraft is an open-source Pine Script v6 indicator that keeps risk transparent directly on the chart. It is not a signal generator; it is a risk desk that calculates size, frames volatility, and reminds you when your behaviour drifts away from the plan.
Core utilities
Calculates professional-style position sizing in real time.
Reads volatility and market regime before position size is confirmed.
Adjusts risk based on the trader’s emotional state and confidence inputs.
Maps session risk across Asian, London, and New York hours.
Draws exactly one stop line and one target line in the preferred direction.
Provides rotating education tips plus contextual warnings when risk escalates.
It is intentionally conservative and keeps you in the game long enough for any separate entry logic to matter.
---
Chart layout checklist
Use a clean chart on a liquid symbol (e.g., AMEX:SPY or major FX pairs).
Main RiskCraft dashboard placed on the right edge.
Session Risk box on the left with UTC time visible.
Floating risk badge above price.
Stop/target guide lines enabled.
Education panel visible in the bottom-right corner.
---
1. On-chart components
Right-side dashboard : account risk %, position size/value, stop, target, risk/reward, regime, trend strength, emotional state, behavioural score, correlation, and preferred trade direction.
Session Risk box : highlights active session (Asian, London, NY), current UTC time, and risk label (High/Med/Low) per session.
Floating risk badge : keeps actual account risk percent visible with colour-coded wording from Ultra Cautious to Very Aggressive.
Stop/target lines : exactly one dashed stop and one dashed target aligned with the preferred bias.
Education panel : rotates core principles and AI-style warnings tied to volatility, risk %, and behaviour flags.
---
2. Volatility engine – ATR with context 📈
atr = ta.atr(atrLength)
atrPercent = (atr / close) * 100
atrSMA = ta.sma(atr, atrLength)
volatilityRatio = atr / atrSMA
isHighVol = volatilityRatio > volThreshold
ATR vs ATR SMA shows how wild price is relative to recent history.
Volatility ratio above the threshold flips isHighVol , which immediately trims risk.
An ATR percentile rank over the last 100 bars indicates calm versus chaotic regimes.
Daily ATR sampling via request.security() gives higher time-frame context for intraday sessions.
When volatility spikes the script dials position size down automatically instead of cheering for maximum exposure.
---
3. Market regime radar – Danger or Drift 🌊
ema20 = ta.ema(close, 20)
ema50 = ta.ema(close, 50)
ema200 = ta.ema(close, 200)
trendScore = (close > ema20 ? 1 : -1) +
(ema20 > ema50 ? 1 : -1) +
(ema50 > ema200 ? 1 : -1)
= ta.dmi(14, 14)
Regimes covered:
Danger : high volatility with weak trend.
Volatile : volatility elevated but structure still directional.
Choppy : low ADX and noisy action.
Trending : directional flows without extreme volatility.
Mixed : anything between.
Each regime maps to a 1–10 risk score and a multiplier that feeds the final position size. Danger and Choppy clamp size; Trending restores normal risk.
---
4. Behaviour engine – trader inputs matter 🧠
You provide:
Emotional state : Confident, Neutral, FOMO, Revenge, Fearful.
Confidence : slider from 1 to 10.
Toggle for behavioural adjustment on/off.
Behind the scenes:
Each state triggers an emotional multiplier .
Confidence produces a confidence multiplier .
Combined they form behavioralFactor and a 0–100 Behavioural Score .
High-risk emotions or low conviction clamp the final risk. Calm inputs allow normal size. The dashboard prints both fields to keep accountability on-screen.
---
5. Correlation guardrail – avoid stacking identical risk 📊
Optional correlation mode compares the active symbol to a reference (default AMEX:SPY ):
corrClose = request.security(correlationSymbol, timeframe.period, close)
priceReturn = ta.change(close) / close
corrReturn = ta.change(corrClose) / corrClose
correlation = calcCorrelation()
Absolute correlation above the threshold applies a correlation multiplier (< 1) to reduce size.
Dashboard row shows the live correlation and reference ticker.
When disabled, the row simply echoes the current symbol, keeping the table readable.
---
6. Position sizing engine – heart of the script 💰
baseRiskAmount = accountSize * (baseRiskPercent / 100)
adjustedRisk = baseRiskAmount * behavioralFactor *
regimeAdjustment * volAdjustment *
correlationAdjustment
finalRiskAmount = math.min(adjustedRisk,
accountSize * (maxRiskCap / 100))
stopDistance = atr * atrStopMultiplier
takeProfit = atr * atrTargetMultiplier
positionSize = stopDistance > 0 ? finalRiskAmount / stopDistance : 0
positionValue = positionSize * close
Outputs shown on the dashboard:
Position size in units and value in currency.
Actual risk % back on account after adjustments.
Risk/Reward derived from ATR-based stop and target.
---
7. Intelligent trade direction – bias without signals 🎯
Direction score ingredients:
EMA stack alignment.
Price versus EMA20.
RSI momentum relative to 50.
MACD line vs signal.
Directional Movement (DI+/DI–).
The resulting Trade Direction row prints LONG, SHORT, or NEUTRAL. No orders are generated—this is guidance so you only risk capital when the structure supports it.
---
8. Stop/target guide lines – two lines only ✂️
if showStopLines
if preferLong
// long stop below, target above
else if preferShort
// short stop above, target below
Lines refresh each bar to keep clutter low.
When the direction score is neutral, no lines appear.
Use them as visual anchors, not auto-orders.
---
9. Session Risk map – global volatility clock 🌍
Tracks Asian, London, and New York windows via UTC.
Computes average ATR per session versus global ATR SMA.
Labels each session High/Med/Low and colours the cells accordingly.
Top row shows the active session plus current UTC time so you always know the regime you are trading.
One glance tells you whether you are trading quiet drift or the part of the day that hunts stops.
---
10. Floating risk badge – honesty above price 🪪
Text ranges from Ultra Cautious through Very Aggressive.
Colour matches the risk palette inputs (High/Med/Low).
Updates on the last bar only, keeping historical clutter off the chart.
Account risk becomes impossible to ignore while you stare at price.
---
11. Education engine & warnings 📚
Rotates evergreen principles (risk 1–2%, journal trades, respect plan).
Triggers contextual warnings when volatility and risk % conflict.
Flags when emotional state = FOMO or Revenge.
Highlights sub-standard risk/reward setups.
When multiple danger flags stack, an AI-style warning overrides the tip text so you can course-correct before capital is exposed.
---
12. Alerts – hard guard rails 🚨
Excessive Risk Alert : actual risk % crosses custom threshold.
High Volatility Alert : ATR behaviour signals danger regime.
Emotional State Warning : FOMO or Revenge selected.
Poor Risk/Reward Alert : risk/reward drops below your standard.
All alerts reinforce discipline; none suggest entries or exits.
---
13. Multi-market behaviour 🕒
Intraday (1m–1h): session box and badge react quickly; ideal for scalpers needing constant risk context.
Higher time frames (1D–1W): dashboard shifts slowly, supporting swing planning.
Asset classes confirmed in validation: crypto majors, large-cap equities, indices, major FX pairs, and liquid commodities.
Risk logic is price-based, so it adapts across markets without bespoke tuning.
15. Key inputs & recommended defaults
Account Size : 10,000 (modify to match actual account; min 100).
Base Risk % : 1.0 with a Maximum Risk Cap of 2.5%.
ATR Period : 14, Stop Multiplier 2.0, Target Multiplier 3.0.
High Vol Threshold : 1.5 for ATR ratio.
Behavioural Adjustment : enabled by default; disable for fixed risk.
Correlation Check : optional; default symbol AMEX:SPY , threshold 0.7.
Display toggles : main dashboard, risk badge, session map, education panel, and stop lines can be individually disabled to reduce clutter.
16. Usage notes & limits
Indicator mode only; no automated entries or exits.
Trade history panel intentionally disabled (requires strategy context).
Correlation analysis depends on additional data requests and may lag slightly on illiquid symbols.
Session timing uses UTC; adjust expectations if you trade localized instruments.
HTF ATR sampling uses daily data, so bar replay on lower charts may show brief data gaps while HTF loads.
What does everyone think RISK really means?

CRAZY RAY RAY - Dashboard 1-5-15-1D + SMC + Clock + Candles PRO OANDA:XAUUSD This script is essentially your institutional "nuclear power plant" for scalping and swing trading: it combines the 1-5-15-1D dashboard, SMC, PRO candles, money flow times, institutional filters, Bull/Bear 12C, Liquidity HUD, Fibo Move, and Target Trend with SL + 3 TPs into a single indicator. 1. Dashboard 1–5–15–1D (Central HUD)
Calculates across 4 timeframes: 1m, 5m, 15m, and 1D:
Trend with EMAs 15/30/200.
RSI (strength >50 buy, <50 sell).
MACD (crossover in favor or against).
For each timeframe it shows:
TREND → BULLISH / BEARISH / NEUTRAL.
ACTION → BUY / SELL / WAIT.
If all 4 timeframes align:
MODE = BULLISH BUY
MODE = BEARISH SELL
Filters and displays on the HUD if buys or sells are blocked by SMC context (BLOCKED BUY / BLOCKED SELL).
Also draws 2 simple moving averages on the chart:
SMA 20 white (you can use it as a micro-trend).
SMA 200 red (macro trend and institutional reference).
2. Real-Time Clock + Trading Hours
Calculates the real time for:
New York / Miami
London
Tokyo
using current time and real time zone.
Also calculates GMT time to know which session is dominant.
Marks your trading hours:
LONDON 3:00–5:30 (London time) → goodLondon
NY OPEN 8:30–10:00 (NY time) → goodNYOpen
ASIA 20:00–23:00 (Tokyo) → goodAsiaScalp
Displays a message on the HUD:
LONDON 3:00–5:30 (1–2 TRADES)
NY OPEN 8:30–10:00 (1 TRADE)
ASIA 20–23 (SCALP)
NO TRADE ROLL / DEAD / LATE
ONLY A+ SETUPS (when not in strong trading hours).
3. Institutional Power (volume + ATR + session)
Filter that evaluates whether the moment is institutional or retail:
Checks:
If you are in a strong trading session (London / NY). If the volume is above the average × multiplier.
If the ATR is above the average × multiplier.
If it passes the filters → INST ON, otherwise → RETAIL ZONE.
Used internally to block buys/sells and for the HUD.
4. Micro-signal “NO RETRACEMENT” on 1m (BUY SR / SELL SR)
On the 1-minute timeframe, it detects a very aggressive entry:
Clean trend (15/30/200 EMAs aligned).
Price crosses the 200 EMA.
MACD turns in favor.
Marks on the candle:
BUY SR (buys without retracement below the EMA200).
SELL SR (sales without retracement above the EMA200).
This state is also reflected in the HUD as the “SR” row.
5. SMC Block: HH/HL/LH/LL + BMS + ChoCH + Fibo + Zones
This is the SMC brain of the script:
Detects swings with pivots:
Paints HH, HL, LH, LL (if you activate showHHLL).
Marks BOS (break of structure).
Marks BMS and ChoCH (with strong or weak filter using ATR, volume, MACD, gaps).
Draws:
Internal Fibo of the last range (38–50–61).
Fibo entry zone 38–78% as a green discount/premium box.
Institutional mitigation zones (simple OB type green/red boxes).
Current range with dotted yellow lines.
Calculates logic for:
antiStupidBuy: blocks purchases when the context is very bearish (LL–LL–LH, bearish ChoCH, premium, EQH, etc.).
antiStupidSell: symmetrical for sales.
From this comes:
allowBuyInst
allowSellInst
buyBlockerOn / sellBlockerOn
buyTrapDetected (BUY SR signal but context blocks it → BUY TRAP).
All this feeds the HUD and institutional alerts.
6. PRO Candles (candlestick + smart color)
Candlestick pattern system:
Detects:
Hammer, Inverted Hammer. Doji.
Strong bullish/bearish candle.
Bullish/bearish engulfing.
Uses a trend EMA to determine if the pattern is with or against the trend.
Colors the candles according to the pattern (if you enable useColorCandles).
Defines texts:
patternText (pattern name).
biasText (reversal, momentum, indecision).
Updates the HUD with the current pattern (“CANDLE: Engulf Bull”, etc.).
7. Institutional PRO Combo + Reversals
Connects everything:
fullBuySetup:
allowBuyInst TRUE (SMC + Fibo + mitigation OK).
Institutional candles in favor (engulfing, hammer, etc.).
MultiTF aligned (1m, 5m in favor, 15/1D not strongly against).
Strong session (London or NY).
No blockages.
fullSellSetup: the same for sales.
Marks on the chart:
BUY PRO, SELL PRO.
BUY REV LL → reversal from a LL, at Fibo discount, with an institutional candle and above EMA200.
SELL REV HH → reversal from HH, at Fibo premium, with an institutional candle and below EMA200.
And generates alerts for all of this.
8. Dynamic Main HUD
On barstate.islast, updates the HUD:
Changes “BUY / SELL” to:
BUY BLOCK / SELL BLOCK when the context blocks that direction.
Writes:
Current candle pattern.
Time message.
Global status:
BUY TRAP ❌, BUY REV LL ✅, SELL REV HH ✅, BUY PRO ✅, SELL PRO ✅,
BUY BLOCK, SELL BLOCK, BUY/SELL OK.
9. Bull/Bear 12C HUD (Small right HUD)
12-confirmation bull/bear engine:
Calculates:
Sweep, 5th leg, mitigation, HL/LH, strong BOS.
Volume pattern (high-low-high).
ATR rising.
MACD crossover.
Liquidity.
Fear & Greed (SMA50).
Gap/imbalance. Bull/Bear 180 weak.
Count how many are ON:
bullScore /12
bearScore /12
Define a regime:
INSTITUTIONAL → many confirmations + rvol + ATR.
NORMAL
RETAIL
Show on right HUD:
List 1 to 12 with green/red dots BULL / BEAR.
Summary: “Regime: INSTITUTIONAL / NORMAL / RETAIL”.
10. Liquidity HUD XAU SCALP
Calculates RVOL, normalized ATR, spread vs ATR, current range vs average range.
Generates score and classifies:
LOW / MED / HIGH / INS.
Only moves up one level if you are in London/NY session (depending on sessions)

🟡 GOLD 4H HUD v12 — Time-Safe Nuclear Edition🟡 GOLD 4H HUD v12 — Time-Safe Nuclear Edition
A full–scale Smart Money Concepts (SMC) analytics engine designed exclusively for XAUUSD on the 4-Hour timeframe.
This script combines market structure, liquidity, displacement, order blocks, imbalance, volume profile, SMT divergence, and institutional behavior modeling into a single unified HUD.
Built with a time-safe architecture, all structural elements (OB/FVG/Sweep) are stored by timestamp to minimize repainting and preserve event integrity.
📌 Core Features (12 Modules + Full HUD)
1 — Market Structure Engine
Automatically detects:
HH / HL / LH / LL
BOS (Break of Structure)
MSS (Market Structure Shift)
CHOCH (Change of Character)
Real swing pivots & trend state
2 — Sweep Engine (Liquidity Grab Detection)
Identifies institutional liquidity grabs:
Break + reclaim of highs/lows
ATR-filtered invalidation
Displacement-backed sweeps
3 — Time-Safe FVG Engine
Detects Bullish/Bearish Fair Value Gaps
ATR-tolerant FVG logic
Automatic right-extension
Auto-delete when filled or invalid
4 — Time-Safe Order Block Engine
Demand & Supply OB detection
Strength classification (Weak vs Strong)
FVG-overlap confirmation
Timestamp-locked (non-repainting)
5 — Volume Profile Engine (HVN / LVN / POC)
Real-time micro-profile:
High Volume Node (HVN)
Low Volume Node (LVN)
Point of Control (POC)
6 — SMT Engine (Gold vs DXY Divergence)
Smart Money Divergence built-in:
Bullish SMT
Bearish SMT
Directional confirmation with zero lag
7 — Displacement Engine
Measures institutional impulse:
Body-based impulse detection
Multi-leg continuation signals
FVG continuation moves
Generates displacement score
8 — Premium / Discount Model
Auto-classifies price into:
Discount (Buy zone)
Premium (Sell zone)
9 — SMC Trend Engine (Score-Based)
Combines 10+ factors:
Structure
FVG
OB power
Displacement
POC positioning
SMT conditions
Outputs:
BULL / BEAR / RANGE
Full scoring system
10 — Institutional Imbalance Model (IMB Engine)
Combines:
PD zones
Sweep direction
Displacement
SMT
OB strength
CHOCH/MSS
A complete institutional bias filter.
11 — Entry Engine (Signal Fusion Model)
Entry conditions fuse:
Sweep
CHOCH
Displacement
OB strength
FVG alignment
SMT confirmation
Also outputs:
Suggested SL/TP
Entry score
12 — Trendline Engine
Auto-draws:
HL → HL bullish trendlines
LH → LH bearish trendlines
+ Full Nuclear HUD
Displays:
Market structure
Trend direction
SMT / CHOCH / MSS
FVG / OB zones
HVN / LVN / POC
Liquidity strength
Entry model
Liquidity Magnet direction
SL/TP map
A complete institutional dashboard in one place.
⚠ Usage Requirement
This script is designed ONLY for the 4H timeframe.
✨ Summary
GOLD 4H HUD v12 — Time-Safe Nuclear Edition
is not just an indicator.
It is a full institutional-grade SMC analysis system, built specifically for Gold.
If you trade XAUUSD on the 4H timeframe —
this is your complete market intelligence HUD

Daily Range SeqDaily Range Seq
Time Window: 04:00 - 10:25 EST
Eval. Window: 10:30 - 15:55 EST
Time Window sets the target for price during the Eval. Window.
If high of time window is created first, then target the high during the Eval. Window.
If low of time window is created first, then target the low during the Eval. Window.

Multi-Condition Alert System d//@version=5
indicator("Multi-Condition Alert System", shorttitle="MC Alert", overlay=false)
// Timeframe check - Set to 10 minutes
isCorrectTF = timeframe.isintraday and timeframe.multiplier == 10
// EMA Calculations
ema9 = ta.ema(close, 9)
ema21 = ta.ema(close, 21)
ema50 = ta.ema(close, 50)
// MACD Calculations
= ta.macd(close, 12, 26, 9)
// RSI Calculations
rsiValue = ta.rsi(close, 14)
// Define RSI levels (you can adjust these based on your violet/yellow lines)
// Assuming violet is above 50 and yellow is below 50
rsiVioletLevel = 50 // Adjust based on your actual levels
rsiYellowLevel = 50 // Adjust based on your actual levels
// Conditions
emaCondition = ema9 > ema21 and ema9 > ema50
macdCondition = macdLine > signalLine
rsiCondition = rsiValue > rsiVioletLevel and rsiValue > rsiYellowLevel
// All conditions must be true
buySignal = emaCondition and macdCondition and rsiCondition and isCorrectTF
// Plotting for visualization
plot(ema9, color=color.blue, title="EMA 9")
plot(ema21, color=color.orange, title="EMA 21")
plot(ema50, color=color.red, title="EMA 50")
plot(macdLine, color=color.blue, title="MACD Line", style=plot.style_line)
plot(signalLine, color=color.orange, title="Signal Line", style=plot.style_line)
hline(rsiVioletLevel, "RSI Violet Level", color=color.purple)
hline(rsiYellowLevel, "RSI Yellow Level", color=color.yellow)
plot(rsiValue, color=color.white, title="RSI")
// Plot buy signals
plotshape(buySignal ? 1 : na, title="Buy Signal", location=location.bottom,
color=color.green, style=shape.triangleup, size=size.small)
// Alert condition
if buySignal
alert("BUY SIGNAL: EMA 9 > EMA 21 & 50, MACD blue > orange, RSI above levels", alert.freq_once_per_bar)
// Table display
var table signalTable = table.new(position.top_right, 1, 5, bgcolor=color.black,
border_width=1)
if barstate.islast
table.cell(signalTable, 0, 0, "10min TF Check:",
text_color=isCorrectTF ? color.green : color.red)
table.cell(signalTable, 0, 1, "EMA 9 > 21 & 50:",
text_color=emaCondition ? color.green : color.red)
table.cell(signalTable, 0, 2, "MACD Blue > Orange:",
text_color=macdCondition ? color.green : color.red)
table.cell(signalTable, 0, 3, "RSI Condition:",
text_color=rsiCondition ? color.green : color.red)
table.cell(signalTable, 0, 4, "BUY SIGNAL:",
text_color=buySignal ? color.green : color.red)

4x Stochastic Combo - %K only4x Stochastic Combo in one indicator.
Default parameters: (9, 3, 3), (14, 3, 3), (40, 4, 4), (60, 10, 10)
Only %K is shown.
Possibility to set alerts "all above 80" or "all below 20".
How to use:
Look for divergence after getting an alert for good quality signals. Connect the stochastic signals with multi-timeframe analysis.

3-bar Swing Liquidity Grab📊 3-BAR SWING LIQUIDITY GRAB
WHAT IT DOES
Automatically detects 3-bar swing highs/lows and alerts you to liquidity grab moments — when price breaks structural levels to trigger stop-losses, then reverses.
SIGNALS AT A GLANCE
Signal What It Means Trade Idea
SH 🟠▼ Swing High (Resistance) Reference level
SL 🔵▲ Swing Low (Support) Reference level
LQH 🔴❌ Fake break ABOVE resistance SHORT ⬇️
LQL 🟢❌ Fake break BELOW support LONG ⬆️
HOW TO TRADE IT
Spot the trend — Is price going up or down?
Wait for signal — LQL (green) in uptrend, LQH (red) in downtrend
Enter on signal — Place order on that bar
Stop Loss — Just outside the swing level
Take Profit — At the next swing level
SETTINGS EXPLAINED
Swing length: 1 = 3-bar swing, 2 = 5-bar swing (use 1 for scalp, 2 for larger TF)
Lookback bars: Time window to find liquidity grabs (10-20 for scalp, 50+ for position)
Toggles: Show/hide swing markers and signals
BEST ON THESE TIMEFRAMES
TF Type Settings
M5-M15 Scalp SL: 1, LB: 10-15
M15-H1 Intraday SL: 1, LB: 15-20
H1-H4 Swing SL: 1-2, LB: 20-50
D+ Position SL: 2, LB: 50+
KEY RULES
✅ DO:
Trade signals aligned with major trend
Always use stop loss
Use 2-5% risk per trade
Confirm with price action
❌ DON'T:
Trade choppy/sideways markets
Ignore the trend
Chase signals
Overtrade
REAL EXAMPLE
LONG Trade (LQL Signal):
text
Uptrend → Swing Low forms at 1.0950
→ Price dips to 1.0930 (below SL)
→ Closes at 1.0955 (above SL) = GREEN ❌ (LQL)
→ BUY at 1.0960
→ Stop Loss: 1.0920
→ Take Profit: 1.1050 (previous Swing High)
WORKS ON
✅ Crypto (Bitcoin, Ethereum, Altcoins)
✅ Forex (EUR/USD, GBP/USD, etc.)
✅ Stocks & Indices
✅ Commodities (Gold, Oil, etc.)
Any asset, any timeframe, any market.
DISCLAIMER
This is a technical analysis tool, not financial advice. Past performance does not guarantee future results. Always use proper risk management and test on a demo account first.

Linear Regression CVDHere is the complete user manual and introduction for the Linear Regression CVD indicator in English. You can save this as your documentation for your trading system.
📊 Linear Regression CVD – Trader’s Manual
1. Introduction
Core Concept:
Standard Cumulative Volume Delta (CVD) indicators are often noisy and jagged, making it difficult to decipher the true direction of capital flow. This indicator applies a Linear Regression algorithm to smooth out the CVD data and adds a Standard Deviation Channel. It is designed to answer two critical questions:
What is the "True Trend" of the money flow? (Filtering out noise)
Is the market sentiment currently overheated? (Using the channel to spot extremes)
Best Markets:
Crypto Perpetual Futures (e.g., BTCUSDT.P) — Highly Recommended.
Stocks & Forex (Must have volume data).
Timeframes:
Scalping: 1m, 5m, 15m (To catch rapid capital inflows/outflows).
Swing Trading: 1H, 4H (To identify the dominant direction of "Smart Money").
2. Visual Guide
When you load the indicator, you will see the following elements:
A. The Main Line (Linear Regression)
Appearance: A smooth, thick line.
Meaning: The average trend of capital flow.
Color Logic:
🟢 Green: Money flow is trending UP (Buyers are dominant).
🔴 Red: Money flow is trending DOWN (Sellers are dominant).
B. The Raw Line (Gray Hairline)
Appearance: A thin, jagged gray line fluctuating around the main line.
Meaning: The Raw, Real-time CVD. It calculates the volume delta (Close vs. Open) for every single candle without smoothing.
C. The Channel (Blue Background)
Appearance: A blue shaded area around the main line.
Meaning: The "Normal Volatility Range."
Calculated based on 2 Standard Deviations (2σ) from the Linear Regression.
If the Gray Line stays inside this channel, the market is stable/balanced.
D. The Signal Dots
🟢 Green Dot (Upside Extension): The Raw CVD has broken above the upper channel.
Meaning: Extreme Greed / Aggressive Buying / FOMO.
🔴 Red Dot (Downside Extension): The Raw CVD has broken below the lower channel.
Meaning: Extreme Fear / Panic Selling / Capitulation.
3. Trading Strategies
Strategy 1: Trend Confirmation
The basic "Follow the Money" approach.
Bullish Signal (Long):
Price is making Higher Highs.
CVD Main Line turns Green and slopes upward.
Action: Confirms that the price rise is backed by real volume. Hold or Add to Longs.
Bearish Signal (Short):
Price is making Lower Lows.
CVD Main Line turns Red and slopes downward.
Action: Confirms that sellers are in control. Hold Shorts.
Strategy 2: Divergence (High Win Rate)
Finding disagreements between "Price" and "Money Flow".
Bearish Divergence (Top Signal):
Price makes a Higher High.
CVD Main Line makes a Lower High (or fails to break out).
Meaning: Price is rising, but buying effort is fading (Exhaustion) or Limit Sellers are absorbing the buy orders (Absorption).
Action: Look for Short entries.
Bullish Divergence (Bottom Signal):
Price makes a Lower Low.
CVD Main Line makes a Higher Low.
Meaning: Price is dropping, but selling pressure is drying up, or Smart Money is absorbing sell orders via limit buy orders.
Action: Look for Long entries.
Strategy 3: Mean Reversion (Extreme Extensions)
Using the Red/Green dots to fade extremes.
Long Opportunity (Bounce):
Price crashes rapidly.
Cluster of Red Dots appears at the bottom.
Meaning: Panic selling has peaked (Capitulation). The market is oversold on a volume basis.
Action: Wait for a candle reversal pattern, then Long for a bounce.
Short Opportunity (Pullback):
Price pumps vertically.
Cluster of Green Dots appears at the bottom.
Meaning: Retail traders are chasing the pump (FOMO). Buying power is overextended.
Action: Wait for momentum to stall, then Short.
4. Important Limitations & Notes
Data Source Accuracy:
TradingView Standard Volume is an approximation (Close vs. Open logic).
It is not perfect "Tick Data" (like professional Orderflow software), but it is 90% accurate for trend analysis on 1H/4H charts.
Tip: Always use Perpetual Contract charts (e.g., BTCUSDT.P) for Crypto, not Spot charts, to get the correct volume data.
The "Extension" Trap:
Do not Short just because you see a Green Dot. In a strong parabolic bull run, you will see many Green Dots in a row while price keeps flying.
These dots indicate velocity, not necessarily a reversal. Always look for resistance levels or divergence before fading the move.
Settings:
Default Length: 20.
For faster signals: Try 10 or 14.
For smoother trends: Try 50.
5. Pre-Trade Checklist
Before entering a trade, check the Linear CVD:
Color: Is the CVD Line Green or Red? Does it match my trade direction?
Slope: Is the CVD accelerating or flattening out?
Divergence: Did price break a level, but CVD failed to follow? (Fakeout warning).
Extremes: Are there Red/Green dots appearing? If yes, am I chasing a trade too late?
这是一套完整的线性回归 CVD (Linear Regression CVD) 指标的使用说明书和简介。你可以把它保存下来,作为你的交易系统参考文档。
📊 线性回归 CVD (Linear Regression CVD) —— 交易员手册
1. 指标简介 (Introduction)
核心理念:
普通的 CVD(累积成交量差)往往噪音很大,线条锯齿状严重,导致交易者难以看清真正的资金流向趋势。本指标通过线性回归算法 (Linear Regression) 对 CVD 进行平滑处理,并结合标准差通道 (Standard Deviation Channel),试图解决两个核心问题:
资金流向的真实趋势是什么?(排除噪音)
当前的情绪是否过热?(通过通道判定)
适用市场:
加密货币合约 (BTC, ETH 等永续合约) —— 效果最佳
股票、外汇 (需有成交量数据)
适用周期:
日内短线:1分钟、5分钟、15分钟(捕捉快速的资金进出)。
趋势波段:1小时、4小时(判断主力资金的大方向)。
2. 视觉元素说明 (Visual Guide)
当你加载指标后,你会看到以下几个部分:
A. 彩色主线 (The LinReg Line)
形态:一条平滑的粗线。
含义:资金流向的**“平均趋势”**。
颜色:
🟢 绿色:资金流向趋势向上(买盘主导)。
🔴 红色:资金流向趋势向下(卖盘主导)。
B. 灰色背景细线 (Raw CVD)
形态:一条充满锯齿的灰色细线,在主线周围波动。
含义:原始的、实时的累积成交量。它反应了当下的每一根K线的实际买卖差额。
C. 蓝色背景通道 (The Channel)
形态:包裹在主线周围的深蓝色带状区域。
含义:“正常波动范围”。
基于线性回归的 2倍标准差计算。
如果灰色细线在通道内运行,说明市场情绪稳定,多空力量均衡。
D. 信号点 (The Dots)
🟢 绿点 (底部出现):原始 CVD 向上突破了通道上轨。代表极度贪婪 / 抢筹。
🔴 红点 (底部出现):原始 CVD 向下跌破了通道下轨。代表极度恐慌 / 抛售。
3. 实战交易策略 (Trading Strategies)
策略一:趋势确认 (Trend Following)
这是最基础的顺势用法。
做多信号:
价格处于上升趋势(如在均线之上)。
CVD 主线由红变绿,且持续向上倾斜。
操作:这确认了价格的上涨有真金白银的买盘支持,可以持有或加仓。
做空信号:
价格处于下降趋势。
CVD 主线由绿变红,且持续向下倾斜。
操作:确认卖盘主导,价格下跌是健康的。
策略二:背离交易 (Divergence) —— 胜率最高的用法
寻找“主力资金”与“价格”不一致的地方。
顶背离 (看跌):
价格创出了新高 (Higher High)。
CVD 主线却没有创新高,或者形成更低的高点 (Lower High)。
含义:价格在涨,但买入的资金在减少。这通常是主力在通过限价单悄悄出货,或者是买盘枯竭。
操作:准备做空,或多单止盈。
底背离 (看涨):
价格创出了新低 (Lower Low)。
CVD 主线却形成了更高的低点 (Higher Low)。
含义:价格在跌,但卖出的资金在减少,或者有大资金在底部通过挂单吸筹 (Absorption)。
操作:准备做多,或空单止盈。
策略三:极端情绪反转 (Mean Reversion)
利用红绿点判断短期的超买超卖。
做多机会 (反弹):
价格快速下跌,甚至暴跌。
指标底部出现密集的红点 (Downside Extension)。
含义:恐慌盘被杀出来了 (Capitulation),市场短期内无可再卖。
操作:等待K线出现反转形态(如长下影线)后尝试博反弹。
做空机会 (回调):
价格快速拉升(垂直上涨)。
指标底部出现密集的绿点 (Upside Extension)。
含义:大量的散户在追涨 (FOMO),透支了买盘动能。
操作:等待上涨停滞后尝试做空。
4. 关键注意事项 (Limitations)
数据源区别:
TradingView 的普通 Volume 是基于 K 线的近似计算(Close > Open 算买,Close < Open 算卖)。
这与专业的 Orderflow 软件(如 Exocharts)使用的逐笔 Tick 数据有一定误差,但在 1小时/4小时 级别上,趋势方向基本一致。
建议:如果你是做合约,请务必加载 合约图表(如 BTCUSDT.P),不要用现货图表看 CVD。
红绿点的陷阱:
不要一看到绿点就做空! 在超级大单边行情(比如牛市主升浪)中,绿点会连续出现,价格会一直涨。
红绿点必须配合 关键支撑/阻力位 使用。如果在“半空中”出现绿点,往往意味着趋势加速,而不是反转。
参数调整:
默认 LinReg Length = 20。
如果你觉得反应太慢,可以改为 10 或 14。
如果你觉得假信号太多,可以改为 50,但这会牺牲灵敏度。
5. 快速检查清单 (Checklist)
在开单前,看一眼 CVD:
颜色:CVD 是绿的还是红的?和我想做的方向一致吗?
斜率:CVD 是在加速上升/下降,还是开始变平了?
背离:价格破位了,CVD 跟着破位了吗?如果没跟,就是假突破。
极值:有没有出现红点/绿点?如果出现了,是不是应该等回调再进场?
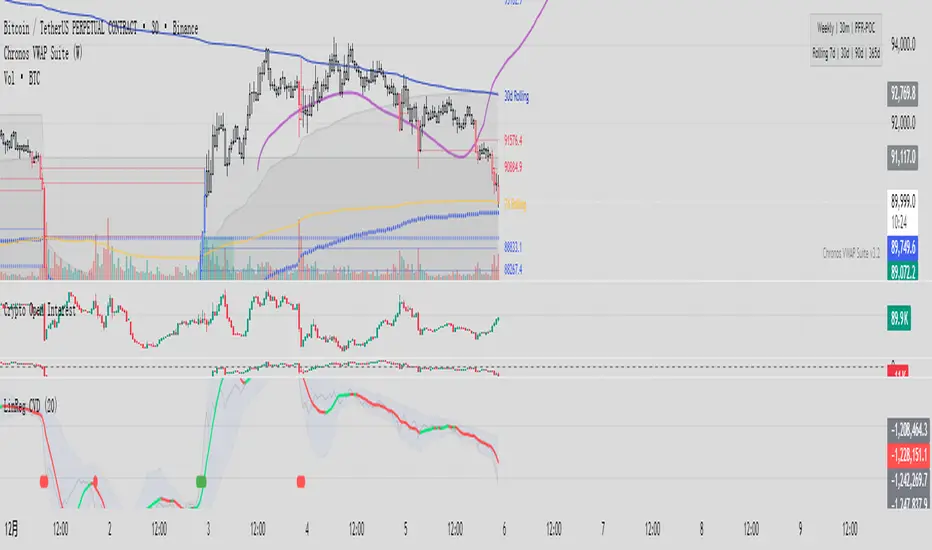
World Markets Table
🌍 World Markets Session Table - Track Global Exchanges in Real-Time
Monitor 10 major stock exchanges worldwide with live market status, countdown timers, and customizable themes. Perfect for multi-market traders, global portfolio managers, and anyone trading across time zones.
✨ Key Features
10 Global Exchanges Tracked:
🇺🇸 NYSE & NASDAQ (New York)
🇨🇳 Shanghai Stock Exchange
🇯🇵 Tokyo Stock Exchange
🇭🇰 Hong Kong Stock Exchange
🇬🇧 London Stock Exchange
🇪🇺 Euronext
🇩🇪 Frankfurt (Xetra)
🇨🇦 Toronto Stock Exchange
🇦🇺 Australian Securities Exchange
Real-Time Market Intelligence:
✅ Live OPEN/CLOSED status with colored indicators
⏱️ Countdown timers to market open/close
🗓️ Automatic weekday/weekend detection
🕒 Optional seconds display for precision timing
🎯 Visual status badges (green for open, red for closed)
Full Customization:
📍 6 table positions (top/bottom × left/center/right)
📏 4 size options (tiny, small, normal, large)
🎨 4 professional themes: Dark, Light, Neon, Ocean
🚩 Toggle country flags on/off
💼 Clean, professional table layout
🎨 Professional Themes
Dark Theme: Sleek charcoal design for night trading
Light Theme: Bright, clean interface for daylight charts
Neon Theme: Vibrant cyberpunk aesthetic with electric colors
Ocean Theme: Calming blue palette for focused analysis
💡 Perfect For
Multi-market traders monitoring global sessions simultaneously
Identifying optimal trading windows across time zones
Planning entries/exits around market opens and closes
Portfolio managers tracking international markets
Forex, indices, and commodities traders
Pre-market and after-hours trading planning
⚙️ How It Works
All market times are calculated in UTC and automatically adjust to your local timezone. The indicator overlays your chart without interfering with price action or technical analysis. Simply add it to any chart, customize the appearance, and stay informed about global market hours.
📊 Usage Tips
Place the table in a non-intrusive position to maintain chart clarity
Use countdown timers to prepare for volatility at market open/close
Match the theme to your chart colors for a cohesive workspace
Enable seconds display when precision timing matters most
Note: This is a display-only indicator showing market hours. It does not generate trading signals or plot price data.