EMA 5,15,35,89,200 BY NUTPlots exponential moving average on four timeframes at once for rapid indication of momentum shift as well as slower-moving confirmations.
Displays EMA 5, 15, 35, 89 and 200... default colors are hotter for faster timeframes, cooler for slower ones
ขอบคุณครับ
"股票开盘前15分钟交易规则" için komut dosyalarını ara

Super Scalper - 5 Min 15 MinThis strategy is based on RSI and ATR Bands which works better in 5 and 15 Mins time frame.
Perform enough back testing with 1:2R before using in real time.
Entry only on trade on screen symbols, use additional buy/sell alerts to book profit or to trail SL.
I have also added Golden Cross Over of 65 and 21 EMA to have confirmation on trend.

EMA 9/15/65/200exponential moving average (EMA) at 9, 15, 65 and 200 days
An exponential moving average (EMA) is a type of moving average (MA) that places a greater weight and significance on the most recent data points. The exponential moving average is also referred to as the exponentially weighted moving average. An exponentially weighted moving average reacts more significantly to recent price changes than a simple moving average (SMA), which applies an equal weight to all observations in the period.

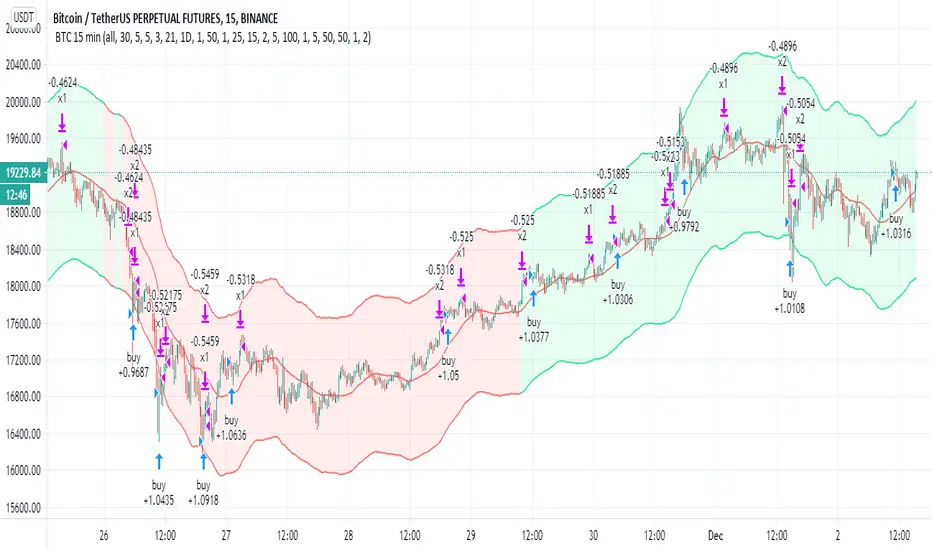
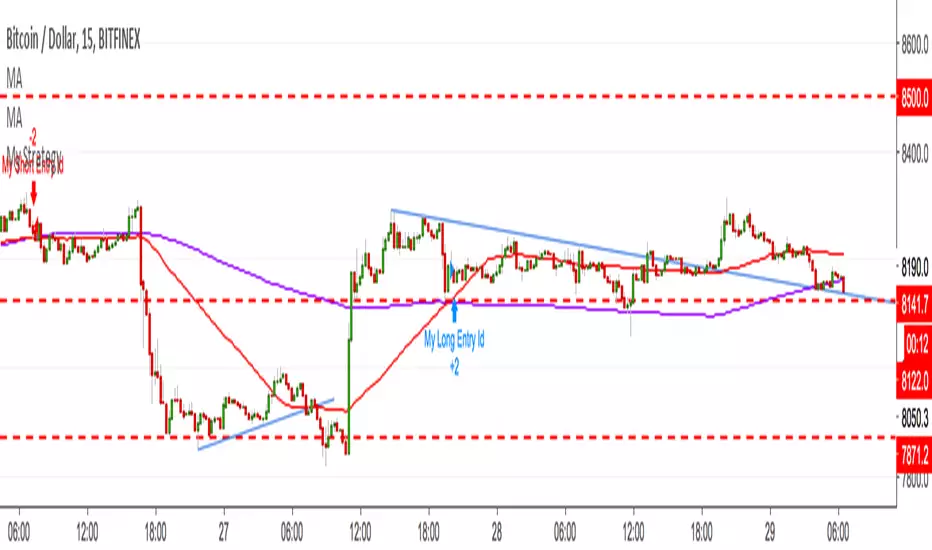
BTC 15 minThis strategy try to catch the uptrend mainly (seems to work on BTC 15 less on others)
the aim is to get 2% in uptrend which is more easy to do then to search only for lowest
since it buy in uptrend it can risky if market change direction
there are two take profit (1% and 2% ) , you take out 50% of equity after the first 1% gain
the stop loss and re buy set 5%
so you exit after 5 % loss and re buy it again at lower price
the aim here is to do leverage trades so you can calculate your risk or lot and the leverage power you want
now set on 100% lot leverage X1
you can try any combination you want but when you do leverage trading you need to do things that the back tester of TV cannot do so well
for example if you put 100X leverage you will be liquidated at 1%
50=2%
20=5%
10=10%
5=20%
you need that your stop loss will be above the liquidation level
stop loss are shit in margin trades as they can kick you out very fast and you will lose many good trades
so I prefer 5X max 10 X trade (this bot can work by himself but i prefer to do it manually for this kind of trades.
all u need to do is to choose what risk you want to have (3% of lot? 5%, 10% or higher )
so this tool try to give you upward buy strategy that aim to get longs at upward trends (short targets that are more easy to get )
and to use leverage as way to make more profit (now bot set to no leverage )
be wise with your money :)
the bot not suppose to repaint but if you find repaint issue then let me know
buy system is based on cross of linear over modified non repainted HMA that set to 1 min (so it buy the uptrend only+ filter based on ema that try not to start cycle of buy in down traade
sell is not so important is mainly cased on percentage channel seen
trend color on Chanel not related to the buy and sell system
CPR by Anand with PDL/PDH & Breakouts 15/30 minsThis is an enhanced version of CPR by Anand with Configurable previous day high and low and option to configure breakout lines of 15 and 30 mins.
Will be an useful tool for day traders who follows CPR tricks and breakouts.


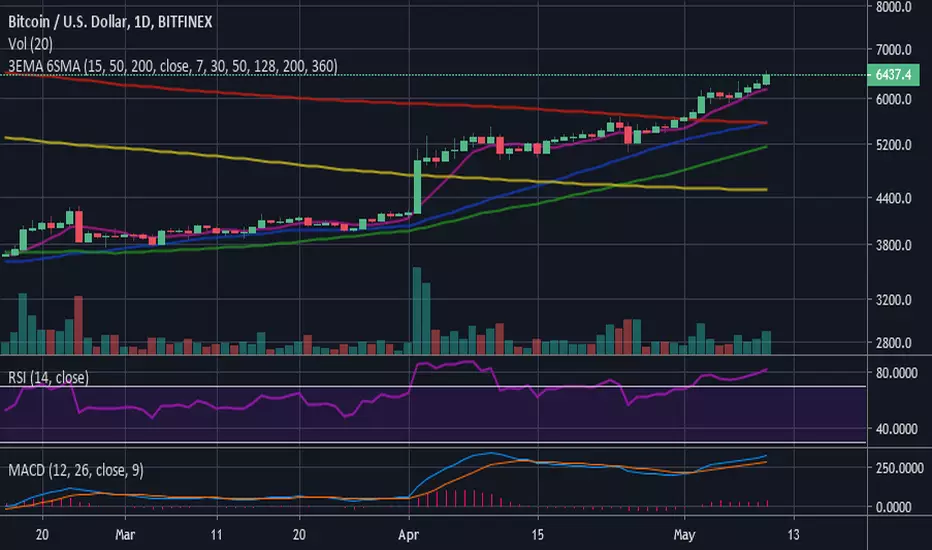
3 EMA (15-50-200) - 6 SMA (7-30-50-128-200-360)3 Moving Average Exponential - 6 Simple Moving Average . Crypto EMA - MA . 7 is a fast support or resistance, 15 confirmation support or resistance. 30 Important support and resistance . 50 institutional support or resistance. 200 institutional general trend, support and resistance , 360 general trend, support and resistance . The use of EMA or MA is according to your liking/trading plan
Spencer 15-Point Moving AverageSpencer 15-Point Moving Average script.
This indicator was originally developed by John Spencer in 1904 (J.I.A. 38, 334: On the graduation of the rates of sickness and mortality presented by the experience of the Manchester Unity of Oddfellows during the period 1893 - 1897).

5 Moving Average Exponential 7-15-30-50-2005 Moving Average Exponential. Crypto EMA. 7 is a fast support or resistance, 15 confirmation support or resistance. 30 Important support and resistance. 50 institutional support or resistance. 200 general trend, support and resistance.

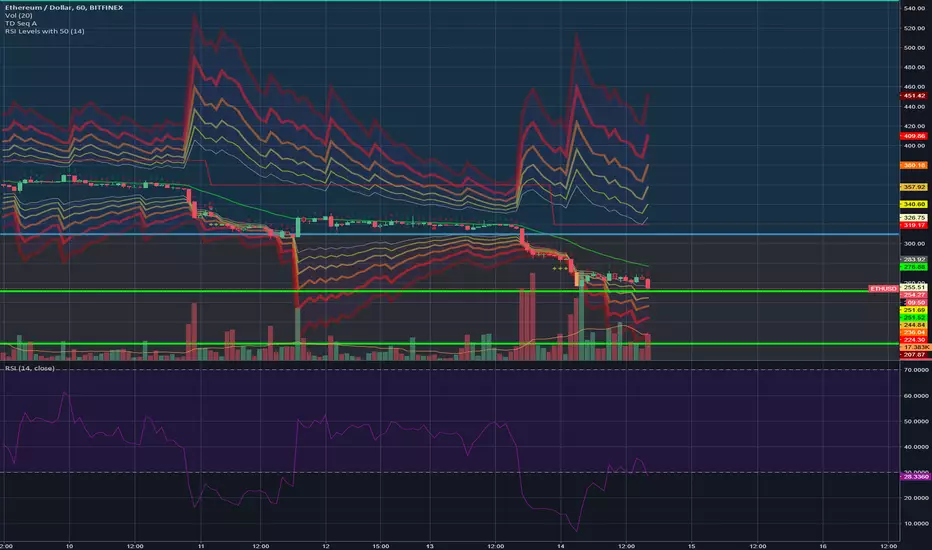
RSI Levels, 15-30 & 70-85 with 50New version of my RSI Levels, 20-30 & 70-80 considering extreme market conditions.
This version scales between 15-30 and 70-85 instead and also has RSI 50 as the middle line.
Bitcoin 15 min crossover SMA Strategy ScriptIs a very simple script that must be used on the 15 min chart of BTCUSD, and works.
Tested same EA in production since 2016.
Use the 200 and 50 SMA to buy and sell.
Works well!
Enjoi!

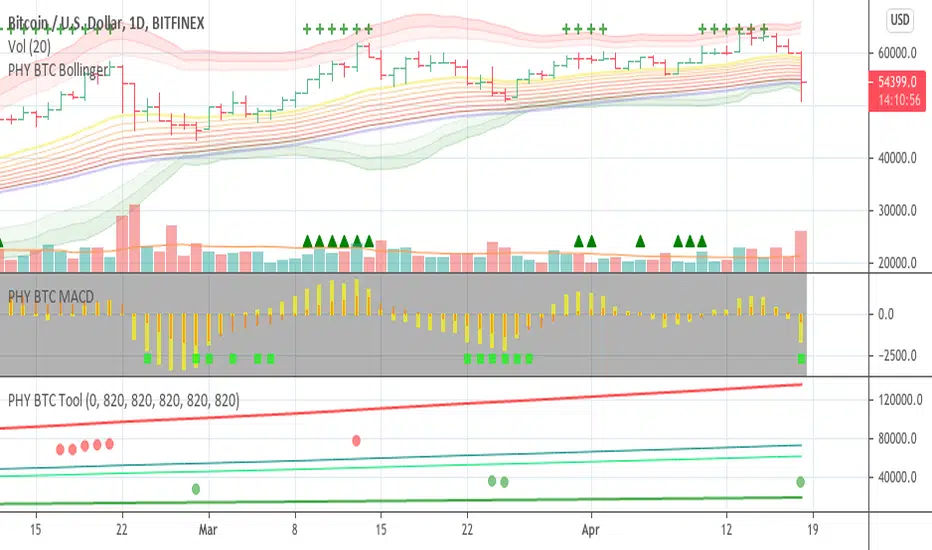
Bollinger Bands Physics with SMA 50 and EMA 15// opening bollinger bands green triangle at bottom
// sma 50 orange line
// ema 15 green line
// low above ema, and ema above sma, and diff of sma and ema increasing teal on top
// opposite red X at bottom
// use with MACD double Physics
// thank you to other users on tradingview for code for bollinger bands, sma, ema script

Guppy MMA 3, 5, 8, 10, 12, 15 and 30, 35, 40, 45, 50, 60Guppy Multiple Moving Average
Short Term EMA 3, 5, 8, 10, 12, 15
Long Term EMA 30, 35, 40, 45, 50, 60
Use for SFTS Class

Candlestick Patterns Identified (updated 3/11/15)I decided to republish this one without the trend filter and with all the major symbols active. This will allow for all the patterns to show up.
Due to 15 different candlestick formations in this one script, it will be difficult to turn off the last few due to screen size. You can turn off individual patterns on the settings screen.
I have everything spelled out except the hammer and inverted hammer. They are "H" and "IH" respectively on the charts. They show up so often that they cluttered the charts.
The default script has: Doji, Evening Star, Morning Star, Shooting Star, Hammer, Inverted Hammer, Bearish Harami, Bullish Harami, Bearish Engulfing, Bullish Engulfing, Piercing Line, Bullish Belt, Bullish Kicker, Bearish Kicker, Hanging man, and Dark Cloud Cover. You can turn off what you don't like. The Piercing Line, Bullish Belt, and the Kickers will usually show up better in the daily charts.
I recommend watching videos with Stephen Bigalow to get a feel for how to trade these. You will want to add an 8 EMA to your chart with his setups. Enjoy.
If you want the old version: Take a look at the related ideas below.

Crypto Market Breadth [QuantVue]15 top crypto tickers of your choosing. Just input your 15 favorite crypto markets in the settings.
Showing breadth of market as a percentage change to gauge buyers/sellers strength.
You can check this on the last day of the week and compare each daily bar to see if buyers are increasing/decreasing or sellers increasing/decreasing bars.
A reading above +2 is bullish , below -2 is bearish momentum, between +2 and -2 neutral.
Works best on daily charts .
Hope you enjoy!
*this will also work with stock tickers!


15/30M Alerts"X Candle Close":
Same as in 5m Enter alert: it's really helpful to wait for a 15m/30m candle to be confirmed, to see f. e. whether a candle really broke a support / resistance or not - and to prevent making bad decisions.
More infos: www.reddit.com
