Fiboborsa+BistTitle: "Fiboborsa+Bist Indicator for TradingView"
Description: The "Fiboborsa+Bist" indicator is a powerful tool designed for TradingView users. This indicator offers a comprehensive set of technical indicators to assist you in your technical analysis and trading decisions.
Features:
Simple Moving Averages (SMA): You can enable or disable SMA with different periods (20, 50, 100, 200) to observe different timeframes and trends.
SMA Strategy: Use SMA crossovers to determine trends. Watch for the 20-period SMA crossing above the 50-period SMA for a bullish signal. For a bearish signal, observe the 50-period SMA crossing below the 100-period SMA.
Exponential Moving Averages (EMA): Similar to SMA, you can enable or disable EMA with different periods (5, 8, 14, 21, 34, 55, 89, 144, 233) for more precise trend analysis.
EMA Strategy: Use EMA crossovers and crossunders for short-term trend changes. A buy signal may occur when the 5-period EMA crosses above the 14-period EMA, while a crossunder suggests a selling opportunity.
Weighted Moving Averages (WMA): Customize WMA settings with various periods (5, 13, 21, 34, 89, 144, 233, 377, 610, 987) to suit your trading style.
WMA Strategy: Use WMA crossovers to verify trends. When the 13-period WMA crosses above the 34-period WMA, it may indicate an uptrend.
Buy and Sell Signals: The indicator provides buy and sell signals based on EMA crossovers and crossunders. Strong signals are also highlighted.
EMA Buy and Sell Strategy: Make informed trading decisions using buy and sell signals generated by EMA crossovers and crossunders.
Ichimoku Cloud: You can enable the Ichimoku Cloud for a clear visual representation of support and resistance levels.
Ichimoku Strategy: Use the Ichimoku Cloud to determine trend direction. Entering long positions is common when the price is above the cloud and considering short positions when it's below the cloud. Verify the trend with the Chikou Span.
Bollinger Bands: Easily visualize price volatility by enabling the Bollinger Bands feature.
Bollinger Bands Strategy: Bollinger Bands help you visualize price volatility. Look for potential reversal points when the price touches or crosses the upper or lower bands.
Use the "Fiboborsa+Bist" indicator to enhance your trading strategies and make informed decisions in the dynamic world of financial markets.
Additional Information:
Bollinger Bands: Bollinger Bands are a technical analysis tool used to monitor price volatility and determine overbought or oversold conditions. This indicator consists of three components:
Middle Moving Average (SMA): Typically, a 20-day SMA is used.
Upper Band: Calculated by adding two times the standard deviation to the SMA.
Lower Band: Calculated by subtracting two times the standard deviation from the SMA.
As the price moves between these two bands, it becomes possible to identify potential buying or selling points by comparing its height or low with these bands.
Ichimoku Cloud: The Ichimoku Cloud is a comprehensive indicator used for trend identification, defining support and resistance levels, and measuring trend strength. The Ichimoku Cloud comprises five key components:
Tenkan Sen (Conversion Line): Used to identify short-term trends.
Kijun Sen (Base Line): Used to identify medium-term trends.
Senkou Span A (Leading Span A): Calculated as (Tenkan Sen + Kijun Sen) / 2 and shows future support and resistance levels.
Senkou Span B (Leading Span B): Calculated as (highest high + lowest low) / 2 and indicates future support and resistance levels.
Chikou Span (Lagging Line): Enables tracking the price backward.
The Ichimoku Cloud interprets a price above the cloud as an uptrend and below the cloud as a downtrend. The Chikou Span assists in verifying the current trend.
ADDITIONAL STRATEGY WITH RSI AND MACD INDICATORS
**Strategy: Two-Stage Trading Strategy Using RSI, MACD, and Fiboborsa+Bist Indicators**
**Stage 1: Determining the Trend and Selecting the Trading Direction**
1. **Trend Identification with Fiboborsa+Bist Indicator:**
- Analyze the simple moving averages (SMA), exponential moving averages (EMA), and weighted moving averages (WMA) used with the Fiboborsa+Bist indicator. These indicators will provide information about the direction of the market trend.
2. **Identifying Overbought and Oversold Conditions with RSI:**
- Use the RSI indicator to identify overbought (70 and above) and oversold (30 and below) conditions. This helps in measuring the strength of the trend. If RSI enters the overbought zone, a downward correction is likely. If RSI enters the oversold zone, an upward correction is probable.
3. **Evaluating Momentum with MACD:**
- Examine price momentum using the MACD indicator. When the MACD line crosses above the signal line, it may indicate an increasing upward momentum. Conversely, a downward cross can suggest an increasing downward momentum.
**Stage 2: Generating Buy and Sell Signals**
4. **Combining RSI, MACD, and Fiboborsa+Bist Indicators:**
- To generate a buy signal, wait for RSI to move out of the oversold region into an uptrend and for the MACD line to cross above the signal line.
- To generate a sell signal, wait for RSI to move out of the overbought region into a downtrend and for the MACD line to cross below the signal line.
5. **Confirmation with Fiboborsa+Bist Indicator:**
- When you receive a buy or sell signal, use the Fiboborsa+Bist indicator to confirm the market trend. Confirming the trend can strengthen your trade signals.
6. **Setting Stop-Loss and Take-Profit Levels:**
- Remember to manage risk when opening buy or sell positions. Set stop-loss and take-profit levels to limit your risk.
7. **Monitor and Adjust Your Trades:**
- Continuously monitor your trade positions and adjust your strategy as per market conditions.
This two-stage trading strategy offers the ability to determine trends and generate trade signals using different indicators. However, every trading strategy involves risks, so risk management and practical application are essential. Also, it's recommended to test this strategy in a demo account before using it in a real trading account.
"股价长期底部,市值50亿左右" için komut dosyalarını ara

Market Performance TableThe Market Performance Table displays the performance of multiple tickers (up to 5) in a table format. The tickers can be customized by selecting them through the indicator settings.
The indicator calculates various metrics for each ticker, including the 1-day change percentage, whether the price is above the 50, 20, and 10-day simple moving averages (SMA), as well as the relative strength compared to the 10/20 SMA and 20/50 SMA crossovers. It also calculates the price deviation from the 50-day SMA.
The table is displayed on the chart and can be positioned in different locations.
Credits for the idea to @Alex_PrimeTrading ;)

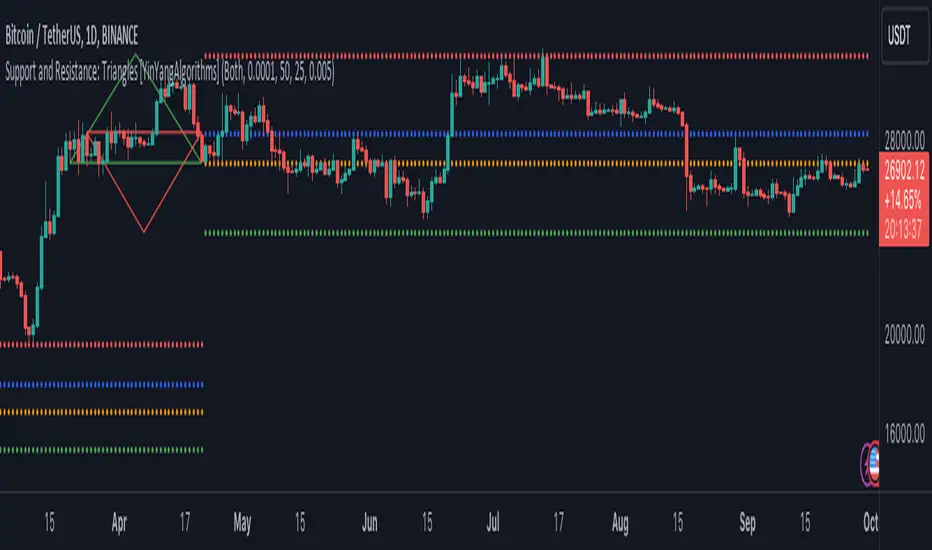
Support and Resistance: Triangles [YinYangAlgorithms]Overview:
Triangles have always been known to be the strongest shape. Well, why wouldn’t that likewise apply to trading? This Indicator will create Upwards and Downwards Triangles which in turn create Support and Resistance locations. For example, we find 2 highs that meet the criteria (within deviation %, Minimum Distance and Lookback Distance). We calculate the distance between these two and create an Equilateral Triangle Downwards (You can adjust the % if you want more of an Isosceles Triangle). The midpoint (tip) of this triangle is the Support and the bottom (base) of it is the Resistance. The exact opposite applies for an Upwards Triangle.
The reason why Triangles may make for good Support and Resistance locations is the % 's used, much like the fibonacci, use ratios relevant in nature and everywhere in the world around us, so why not for trading too?
Tutorial:
If you look at the locations we’ve circled above, all of them exhibit strong rejections are predictive Support and Resistance locations plotted by the triangles created. There can only ever be 1 Upward and 1 Downward Triangle at a time, so when a new one is created, the Support and Resistance locations are moved.
If you scroll back far enough you’ll notice the Triangles disappear but their Support and Resistance locations are still plotted. This has to do with the fact you are allowed only so many Lines plotted and when a new Triangle is created, an old one will be removed. The Support and Resistance locations however will stay.
If we look at the example above, you can see the Support and Resistance locations the Triangles made here may have helped predict where the price would struggle to surpass.
By default the Look Back Distance is set to 50 and the Min Distance is 10 (settings used in all previous examples). However, you can modify these to make Triangles more ‘Rare’ and therefore the Support and Resistance locations change less. In the example above for Instance we left Look Back Distance to 50 but changed Min Distance from 10 to 25. This results in Support and Resistance locations that may hold better in the long term.
If we scroll back a bit, we can see the settings ‘Look Back Distance’ 50 and ‘Minimum Distance’ 25 had done a decent job at predicting the ATH resistance and many Support and Resistance locations around it. Keep in mind, previous results don’t mean future results, but Triangles may create ratios which apply well to trading.
We will conclude our Tutorial here. Hopefully you can see the benefit to the ratio Triangles make when predicting Support and Resistance locations.
Settings:
Show Triangles: If all you want to know is the Support and Resistance locations, there’s no need to draw the Triangles.
Triangle Zones: What types of triangles should we create our zones for? Options are Upward, Downward, Both, None.
Max Deviation Allowed: Maximum Deviation up or down from the last bars High/Low for potential to create a Triangle.
Lookback Distance: How far back we look to see for potential of a High/Low within Deviation range.
Min Distance: This is so triangles are spaced properly and not from 2 bars beside each other. Min distance allocated between 2 points to create a Triangle.
Bar Percent Increase: How much % multiplier do we apply for each bar spacing of the triangle. 0.005 creates a close to Equilateral Triangle, but other values like 0.004 and 0.006 seem to work well too.
If you have any questions, comments, ideas or concerns please don't hesitate to contact us.
HAPPY TRADING!
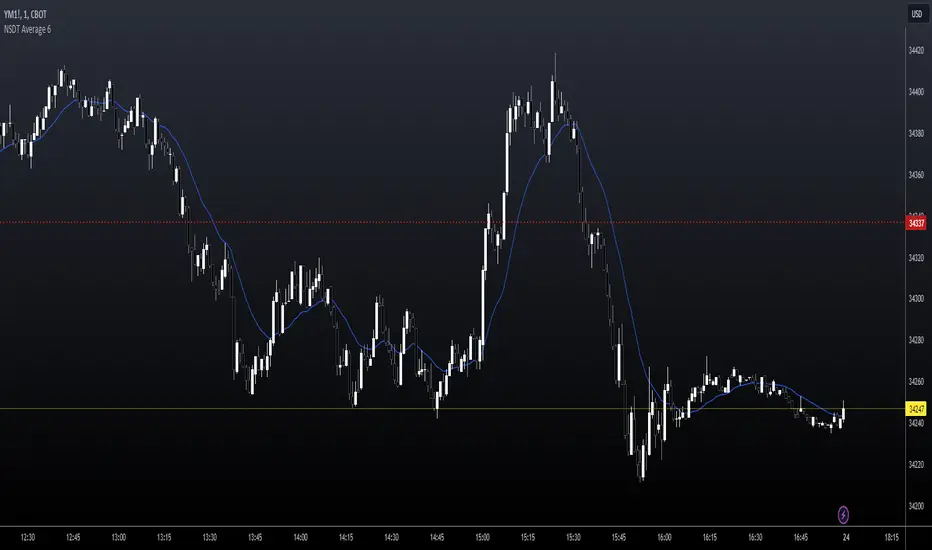
NSDT Average 6This is a pretty simple concept that we were asked to put together. It uses 6 Moving Averages, and takes the average of each one, then averages them all together.
If you don't want to use 6, and only 3 for example, then just enter the same length in two of the input fields as pairs.
Example:
For 6, you could use 10, 20, 30, 40, 50, 60
For 3, you could use 10, 10, 50, 50, 100, 100
It doesn't ploy 6 MA's, it only plots one - the result of the average of an average of an average, etc..
Publishing open source so other can modify as needed.
Statistical Package for the Trading Sciences [SS]
This is SPTS.
It stands for Statistical Package for the Trading Sciences.
Its a play on SPSS (Statistical Package for the Social Sciences) by IBM (software that, prior to Pinescript, I would use on a daily basis for trading).
Let's preface this indicator first:
This isn't so much an indicator as it is a project. A passion project really.
This has been in the works for months and I still feel like its incomplete. But the plan here is to continue to add functionality to it and actually have the Pinecoding and Tradingview community contribute to it.
As a math based trader, I relied on Excel, SPSS and R constantly to plan my trades. Since learning a functional amount of Pinescript and coding a lot of what I do and what I relied on SPSS, Excel and R for, I use it perhaps maybe a few times a week.
This indicator, or package, has some of the key things I used Excel and SPSS for on a daily and weekly basis. This also adds a lot of, I would say, fairly complex math functionality to Pinescript. Because this is adding functionality not necessarily native to Pinescript, I have placed most, if not all, of the functionality into actual exportable functions. I have also set it up as a kind of library, with explanations and tips on how other coders can take these functions and implement them into other scripts.
The hope here is that other coders will take it, build upon it, improve it and hopefully share additional functionality that can be added into this package. Hence why I call it a project. Okay, let's get into an overview:
Current Functions of SPTS:
SPTS currently has the following functionality (further explanations will be offered below):
Ability to Perform a One-Tailed, Two-Tailed and Paired Sample T-Test, with corresponding P value.
Standard Pearson Correlation (with functionality to be able to calculate the Pearson Correlation between 2 arrays).
Quadratic (or Curvlinear) correlation assessments.
R squared Assessments.
Standard Linear Regression.
Multiple Regression of 2 independent variables.
Tests of Normality (with Kurtosis and Skewness) and recognition of up to 7 Different Distributions.
ARIMA Modeller (Sort of, more details below)
Okay, so let's go over each of them!
T-Tests
So traditionally, most correlation assessments on Pinescript are done with a generic Pearson Correlation using the "ta.correlation" argument. However, this is not always the best test to be used for correlations and determine effects. One approach to correlation assessments used frequently in economics is the T-Test assessment.
The t-test is a statistical hypothesis test used to determine if there is a significant difference between the means of two groups. It assesses whether the sample means are likely to have come from populations with the same mean. The test produces a t-statistic, which is then compared to a critical value from the t-distribution to determine statistical significance. Lower p-values indicate stronger evidence against the null hypothesis of equal means.
A significant t-test result, indicating the rejection of the null hypothesis, suggests that there is statistical evidence to support that there is a significant difference between the means of the two groups being compared. In practical terms, it means that the observed difference in sample means is unlikely to have occurred by random chance alone. Researchers typically interpret this as evidence that there is a real, meaningful difference between the groups being studied.
Some uses of the T-Test in finance include:
Risk Assessment: The t-test can be used to compare the risk profiles of different financial assets or portfolios. It helps investors assess whether the differences in returns or volatility are statistically significant.
Pairs Trading: Traders often apply the t-test when engaging in pairs trading, a strategy that involves trading two correlated securities. It helps determine when the price spread between the two assets is statistically significant and may revert to the mean.
Volatility Analysis: Traders and risk managers use t-tests to compare the volatility of different assets or portfolios, assessing whether one is significantly more or less volatile than another.
Market Efficiency Tests: Financial researchers use t-tests to test the Efficient Market Hypothesis by assessing whether stock price movements follow a random walk or if there are statistically significant deviations from it.
Value at Risk (VaR) Calculation: Risk managers use t-tests to calculate VaR, a measure of potential losses in a portfolio. It helps assess whether a portfolio's value is likely to fall below a certain threshold.
There are many other applications, but these are a few of the highlights. SPTS permits 3 different types of T-Test analyses, these being the One Tailed T-Test (if you want to test a single direction), two tailed T-Test (if you are unsure of which direction is significant) and a paired sample t-test.
Which T is the Right T?
Generally, a one-tailed t-test is used to determine if a sample mean is significantly greater than or less than a specified population mean, whereas a two-tailed t-test assesses if the sample mean is significantly different (either greater or less) from the population mean. In contrast, a paired sample t-test compares two sets of paired observations (e.g., before and after treatment) to assess if there's a significant difference in their means, typically used when the data points in each pair are related or dependent.
So which do you use? Well, it depends on what you want to know. As a general rule a one tailed t-test is sufficient and will help you pinpoint directionality of the relationship (that one ticker or economic indicator has a significant affect on another in a linear way).
A two tailed is more broad and looks for significance in either direction.
A paired sample t-test usually looks at identical groups to see if one group has a statistically different outcome. This is usually used in clinical trials to compare treatment interventions in identical groups. It's use in finance is somewhat limited, but it is invaluable when you want to compare equities that track the same thing (for example SPX vs SPY vs ES1!) or you want to test a hypothesis about an index and a leveraged share (for example, the relationship between FNGU and, say, MSFT or NVDA).
Statistical Significance
In general, with a t-test you would need to reference a T-Table to determine the statistical significance of the degree of Freedom and the T-Statistic.
However, because I wanted Pinescript to full fledge replace SPSS and Excel, I went ahead and threw the T-Table into an array, so that Pinescript can make the determination itself of the actual P value for a t-test, no cross referencing required :-).
Left tail (Significant):
Both tails (Significant):
Distributed throughout (insignificant):
As you can see in the images above, the t-test will also display a bell-curve analysis of where the significance falls (left tail, both tails or insignificant, distributed throughout).
That said, I have not included this function for the paired sample t-test because that is a bit more nuanced. But for the one and two tailed assessments, the indicator will provide you the P value.
Pearson Correlation Assessment
I don't think I need to go into too much detail on this one.
I have put in functionality to quickly calculate the Pearson Correlation of two array's, which is not currently possible with the "ta.correlation" function.
Quadratic (Curvlinear) Correlation
Not everything in life is linear, sometimes things are curved!
The Pearson Correlation is great for linear assessments, but tends to under-estimate the degree of the relationship in curved relationships. There currently is no native function to t-test for quadratic/curvlinear relationships, so I went ahead and created one.
You can see an example of how Quadratic and Pearson Correlations vary when you look at CME_MINI:ES1! against AMEX:DIA for the past 10 ish months:
Pearson Correlation:
Quadratic Correlation:
One or the other is not always the best, so it is important to check both!
R-Squared Assessments:
The R-squared value, or the square of the Pearson correlation coefficient (r), is used to measure the proportion of variance in one variable that can be explained by the linear relationship with another variable. It represents the goodness-of-fit of a linear regression model with a single predictor variable.
R-Squared is offered in 3 separate forms within this indicator. First, there is the generic R squared which is taking the square root of a Pearson Correlation assessment to assess the variance.
The next is the R-Squared which is calculated from an actual linear regression model done within the indicator.
The first is the R-Squared which is calculated from a multiple regression model done within the indicator.
Regardless of which R-Squared value you are using, the meaning is the same. R-Square assesses the variance between the variables under assessment and can offer an insight into the goodness of fit and the ability of the model to account for the degree of variance.
Here is the R Squared assessment of the SPX against the US Money Supply:
Standard Linear Regression
The indicator contains the ability to do a standard linear regression model. You can convert one ticker or economic indicator into a stock, ticker or other economic indicator. The indicator will provide you with all of the expected information from a linear regression model, including the coefficients, intercept, error assessments, correlation and R2 value.
Here is AAPL and MSFT as an example:
Multiple Regression
Oh man, this was something I really wanted in Pinescript, and now we have it!
I have created a function for multiple regression, which, if you export the function, will permit you to perform multiple regression on any variables available in Pinescript!
Using this functionality in the indicator, you will need to select 2, dependent variables and a single independent variable.
Here is an example of multiple regression for NASDAQ:AAPL using NASDAQ:MSFT and NASDAQ:NVDA :
And an example of SPX using the US Money Supply (M2) and AMEX:GLD :
Tests of Normality:
Many indicators perform a lot of functions on the assumption of normality, yet there are no indicators that actually test that assumption!
So, I have inputted a function to assess for normality. It uses the Kurtosis and Skewness to determine up to 7 different distribution types and it will explain the implication of the distribution. Here is an example of SP:SPX on the Monthly Perspective since 2010:
And NYSE:BA since the 60s:
And NVDA since 2015:
ARIMA Modeller
Okay, so let me disclose, this isn't a full fledge ARIMA modeller. I took some shortcuts.
True ARIMA modelling would involve decomposing the seasonality from the trend. I omitted this step for simplicity sake. Instead, you can select between using an EMA or SMA based approach, and it will perform an autogressive type analysis on the EMA or SMA.
I have tested it on lookback with results provided by SPSS and this actually works better than SPSS' ARIMA function. So I am actually kind of impressed.
You will need to input your parameters for the ARIMA model, I usually would do a 14, 21 and 50 day EMA of the close price, and it will forecast out that range over the length of the EMA.
So for example, if you select the EMA 50 on the daily, it will plot out the forecast for the next 50 days based on an autoregressive model created on the EMA 50. Here is how it looks on AMEX:SPY :
You can also elect to plot the upper and lower confidence bands:
Closing Remarks
So that is the indicator/package.
I do hope to continue expanding its functionality, but as of now, it does already have quite a lot of functionality.
I really hope you enjoy it and find it helpful. This. Has. Taken. AGES! No joke. Between referencing my old statistics textbooks, trying to remember how to calculate some of these things, and wanting to throw my computer against the wall because of errors in the code, this was a task, that's for sure. So I really hope you find some usefulness in it all and enjoy the ability to be able to do functions that previously could really only be done in external software.
As always, leave your comments, suggestions and feedback below!
Take care!

Ultimate RSI [LuxAlgo]The Ultimate RSI indicator is a new oscillator based on the calculation of the Relative Strength Index that aims to put more emphasis on the trend, thus having a less noisy output. Opposite to the regular RSI, this oscillator is designed for a trend trading approach instead of a contrarian one.
🔶 USAGE
While returning the same information as a regular RSI, the Ultimate RSI puts more emphasis on trends, and as such can reach overbought/oversold levels faster as well as staying longer within these areas. This can avoid the common issue of an RSI regularly crossing an overbought or oversold level while the trend makes new higher highs/lower lows.
The Ultimate RSI crossing above the overbought level can be indicative of a strong uptrend (highlighted as a green area), while an Ultimate RSI crossing under the oversold level can be indicative of a strong downtrend (highlighted as a red area).
The Ultimate RSI crossing the 50 midline can also indicate trends, with the oscillator being above indicating an uptrend, else a downtrend. Unlike a regular RSI, the Ultimate RSI will cross the midline level less often, thus generating fewer whipsaw signals.
For even more timely indications users can observe the Ultimate RSI relative to its signal line. An Ultimate RSI above its signal line can indicate it is increasing, while the opposite would indicate it is decreasing.
🔹 Smoothing Methods
Users can return more reactive or smoother results depending on the selected smoothing method used for the calculation of the Ultimate RSI. Options include:
Exponential Moving Average (EMA)
Simple Moving Average (SMA)
Wilder's Moving Average (RMA)
Triangular Moving Average (TMA)
These are ranked by the degree of reactivity of each method, with higher ones being more reactive (but less smooth).
Users can also select the smoothing method used by the signal line.
🔶 DETAILS
The RSI returns a normalized exponential average of price changes in the range (0, 100), which can be simply calculated as follows:
ema(d) / ema(|d|) × 50 + 50
where d represent the price changes. In order to put more emphasis on trends we can put higher weight on d . We can perform this on the occurrence of new higher highs/lower lows, and by replacing d with the rolling range instead (the rolling period used to detect the higher highs/lower lows is equal to the length setting).
🔶 SETTINGS
Length: Calculation period of the indicator
Method: Smoothing method used for the calculation of the indicator.
Source: Input source of the indicator
🔹 Signal Line
Smooth: Degree of smoothness of the signal line
Method: Smoothing method used to calculation the signal line.

Anit Momentum IndicatorAnit Momentum Indicator: A Powerful Trend Continuation Tool for Long-Only Strategies
The "Anit Momentum Indicator" (AMI) is a powerful technical analysis tool designed to assist traders in identifying potential trend continuation opportunities in the financial markets. Unlike traditional trend reversal indicators, AMI is specifically crafted for long-only strategies, making it an ideal tool for traders seeking to capture sustained uptrends.
Concepts and Functionality:
1. Momentum Calculation:
The Anit Momentum Indicator begins by calculating the momentum of the closing price over a specified period. Momentum represents the rate of price change, offering clues about the strength and direction of price movements during the chosen duration.
2. RSI for Trend Continuation:
The script then applies the RSI to the previously computed momentum values. The RSI is a well-known oscillator used to measure the speed and magnitude of price changes. By utilizing the RSI on momentum data, the Anit Momentum Indicator gains a distinct advantage in gauging the strength of price momentum, leading to more accurate trend evaluations.
3. Rescaling for Better Visualization:
To enhance visual clarity and maintain consistent representation, the RSI on Momentum is rescaled to range from 0 to 100. This normalization ensures that the indicator's values remain within a fixed range, making it easier for traders to identify crucial overbought and oversold regions.
How to Use the Indicator:
Long-Only Strategy:
The AMI is most effective in long-only strategies. Traders can deploy the indicator to identify promising opportunities to go long on a stock or asset. A long position is established when the AMI crosses above 50, signaling a robust upward momentum.
Trend Continuation Confirmation:
The AMI's ability to capture trend continuation opportunities allows traders to stay invested in an uptrend for an extended period. As long as the AMI remains above 50, the uptrend is considered intact, and traders may continue to hold the position.
Higher Timeframe Advantage:
The AMI's effectiveness is further enhanced on higher timeframes. Longer timeframes provide a more reliable and sustained view of the underlying trend, giving traders greater confidence in their long-only strategies.
Conclusion:
The Anit Momentum Indicator is a valuable tool for traders pursuing trend continuation strategies, specifically long-only approaches. By leveraging the concept of momentum and RSI, the AMI helps traders identify and participate in sustained uptrends. With its focus on trend continuation rather than reversals, the AMI can be a key component in building successful long-only trading strategies, especially on higher timeframes. Traders can use this indicator to stay invested in robust uptrends, maximizing their profit potential while minimizing exposure to counter-trend moves by staying long till AMI value is greater than 50,it is better to stay away or exit from the asst class when AMI value is less than 50.

Stochastic Zone Strength Trend [wbburgin](This script was originally invite-only, but I'd vastly prefer contributing to the TradingView community more than anything else, so I am making it public :) I'd much rather share my ideas with you all.)
The Stochastic Zone Strength Trend indicator is a very powerful momentum and trend indicator that 1) identifies trend direction and strength, 2) determines pullbacks and reversals (including oversold and overbought conditions), 3) identifies divergences, and 4) can filter out ranges. I have some examples below on how to use it to its full effectiveness. It is composed of two components: Stochastic Zone Strength and Stochastic Trend Strength.
Stochastic Zone Strength
At its most basic level, the stochastic Zone Strength plots the momentum of the price action of the instrument, and identifies bearish and bullish changes with a high degree of accuracy. Think of the stochastic Zone Strength as a much more robust equivalent of the RSI. Momentum-change thresholds are demonstrated by the "20" and "80" levels on the indicator (see below image).
Stochastic Trend Strength
The stochastic Trend Strength component of the script uses resistance in each candlestick to calculate the trend strength of the instrument. I'll go more into detail about the settings after my description of how to use the indicator, but there are two forms of the stochastic Trend Strength:
Anchored at 50 (directional stochastic Trend Strength):
The directional stochastic Trend Strength can be used similarly to the MACD difference or other histogram-like indicators : a rising plot indicates an upward trend, while a falling plot indicates a downward trend.
Anchored at 0 (nondirectional stochastic Trend Strength):
The nondirectional stochastic Trend Strength can be used similarly to the ADX or other non-directional indicators : a rising plot indicates increasing trend strength, and look at the stochastic Zone Strength component and your instrument to determine if this indicates increasing bullish strength or increasing bearish strength (see photo below):
(In the above photo, a bearish divergence indicated that the high Trend Strength predicted a strong downwards move, which was confirmed shortly after. Later, a bullish move upward by the Zone Strength while the Trend Strength was elevated predicated a strong upwards move, which was also confirmed. Note the period where the Trend Strength never reached above 80, which indicated a ranging period (and thus unprofitable to enter or exit)).
How to Use the Indicator
The above image is a good example on how to use the indicator to determine divergences and possible pivot points (lines and circles, respectively). I recommend using both the stochastic Zone Strength and the stochastic Trend Strength at the same time, as it can give you a robust picture of where momentum is in relation to the price action and its trajectory. Every color is changeable in the settings.
Settings
The Amplitude of the indicator is essentially the high-low lookback for both components.
The Wavelength of the indicator is how stretched-out you want the indicator to be: how many amplitudes do you want the indicator to process in one given bar.
A useful analogy that I use (and that I derived the names from) is from traditional physics. In wave motion, the Amplitude is the up-down sensitivity of the wave, and the Wavelength is the side-side stretch of the wave.
The Smoothing Factor of the settings is simply how smoothed you want the stochastic to be. It's not that important in most circumstances.
Trend Anchor was covered above (see my description of Trend Strength). The "Trend Transform MA Length" is the EMA length of the Trend Strength that you use to transform it into the directional oscillator. Think of the EMA being transformed onto the 50 line and then the Trend Strength being dragged relative to that.
Trend Transform MA Length is the EMA length you want to use for transforming the nondirectional Trend Strength (anchored at 0) into the directional Trend Strength (anchored at 50). I suggest this be the same as the wavelength.
Trend Plot Type can transform the Nondirectional Trend Strength into a line plot so that it doesn't murk up the background.
Finally, the colors are changeable on the bottom.
Explanation of Zone Strength
If you're knowledgeable in Pine Script, I encourage you to look at the code to try to understand the concept, as it's a little complicated. The theory behind my Zone Strength concept is that the wicks in every bar can be used create an index of bullish and bearish resistance, as a wick signifies that the price crossed above a threshold before returning to its origin. This distance metric is unique because most indicators/formulas for calculating relative strength use a displacement metric (such as close - open) instead of measuring how far the price actually moved (up and down) within a candlestick. This is what the Zone Strength concept represents - the hesitation within the bar that is not typically represented in typical momentum indicators.
In the script's code I have step by step explanations of how the formula is calculated and why it is calculated as such. I encourage you to play around with the amplitude and wavelength inputs as they can make the zone strength look very different and perform differently depending on your interests.
Enjoy!
Walker

[FC] Multi EMA Cross Alerts Fltered with RSI and StochThis script prints Green Dots and Red Dots on candle close using Faster EMA ( 5 ) and Slower EMA (10 ) filtering with RSI (50)+ Stochastic %K ( 20 to 80 ) Smoothning(3).
The idea behind is to you use dots for scalping on smaller timeframe(5) ,(10) etc but you can modify all values to better fit your needs.
Explaination for Green Dots and Red Dots:
---> Green dot : 5 Ema crosses above 10 Ema ( i.e faster EMA crosses above slower EMA which signals price is trying to move up
RSI value > 50 (filtering for quick move)
stoch %k value between 20 and 80 ( filtering to know there is leg left in the move and all movement is already not done)
---> Red dot : 5 Ema crosses below 10 Ema ( i.e faster EMA crosses above slower EMA which signals price is trying to move down
RSI value < 50 (filtering for quick move)
stoch %k value between 20 and 80 ( filtering to know there is leg left in the move and all movement is already not done)

Engulfing Pattern BUY and SELL SystemThis indicator is based on multiple parameters such as the Open, High, Low, and Close of candles. We add confluences such as SMMA crossovers, engulfing candles, and the number of pips that it has moved from it.
The main parameter is the DFS (Distance from SMMA). This will adjust the number of signals you'll get. This parameter is calculated based on the Open price of the signal bar and the 50 SMMA price. If the difference between these two values is greater than the input value, it will not be considered a signal.
The buy/sell signal consists of the following conditions:
1. Engulfing Candle based on conditions
2. SMMA crossover (21 and 50 periods)
3. For BUYS, the RSI value is greater than 49. For SELLS, the RSI value is less than 51.
4. Open price of the signal bar is less/greater than the 50 SMMA for SELLS/BUYS respectively.
5. DFS value is less than or equal to the input value
We recommend backtesting this on FX Pairs, and metals such as Gold. It is not well suited for Crypto or Indices.
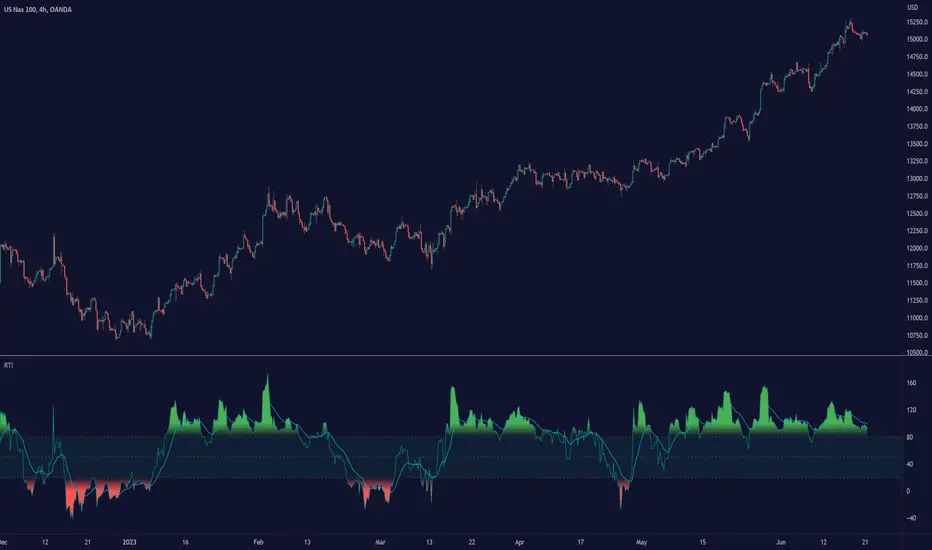
Relative Trend Index (RTI) by Zeiierman█ Overview
The Relative Trend Index (RTI) developed by Zeiierman is an innovative technical analysis tool designed to measure the strength and direction of the market trend. Unlike some traditional indicators, the RTI boasts a distinctive ability to adapt and respond to market volatility, while still minimizing the effects of minor, short-term market fluctuations.
The Relative Trend Index blends trend-following and mean-reverting characteristics, paired with a customizable and intuitive approach to trend strength, and its sensitivity to price action makes this indicator stand out.
█ Benefits of using this RTI instead of RSI
The Relative Strength Index (RSI) and the Relative Trend Index (RTI) are both powerful technical indicators, each with its own unique strengths.
However, there are key differences that make the RTI arguably more sophisticated and precise, especially when it comes to identifying trends and overbought/oversold (OB/OS) areas.
The RSI is a momentum oscillator that measures the speed and change of price movements and is typically used to identify overbought and oversold conditions in a market. However, its primary limitation lies in its tendency to produce false signals during extended trending periods.
On the other hand, the RTI is designed specifically to identify and adapt to market trends. Instead of solely focusing on price changes, the RTI measures the relative positioning of the current closing price within its recent range, providing a more comprehensive view of market conditions.
The RTI's adaptable nature is particularly valuable. The user-adjustable sensitivity percentage allows traders to fine-tune the indicator's responsiveness, making it more resilient to sudden market fluctuations and noise that could otherwise produce false signals. This feature is advantageous in various market conditions, from trending to choppy and sideways-moving markets.
Furthermore, the RTI's unique method of defining OB/OS zones takes into account the prevailing trend, which can provide a more precise reflection of the market's condition.
While the RSI is an invaluable tool in many traders' toolkits, the RTI's unique approach to trend identification, adaptability, and enhanced definition of OB/OS zones can provide traders with a more nuanced understanding of market conditions and potential trading opportunities. This makes the RTI an especially powerful tool for those seeking to ride long-term trends and avoid false signals.
█ Calculations
In summary, while simple enough, the math behind the RTI indicator is quite powerful. It combines the quantification of price volatility with the flexibility to adjust the trend sensitivity. It provides a normalized output that can be interpreted consistently across various trading scenarios.
The math behind the Relative Trend Index (RTI) indicator is rooted in some fundamental statistical concepts: Standard Deviation and Percentiles.
Standard Deviation: The Standard Deviation is a measure of dispersion or variability in a dataset. It quantifies the degree to which each data point deviates from the mean (or average) of the data set. In this script, the standard deviation is computed on the 'close' prices over a specified number of periods. This provides a measure of the volatility in the price over that period. The higher the standard deviation, the more volatile the price has been.
Percentiles: The percentile is a measure used in statistics indicating the value below which a given percentage of observations in a group falls. After calculating the upper and lower trends for the last 'length' periods and sorting these values, the script uses the 'Sensitivity ' parameter to extract percentiles from these sorted arrays. This is a powerful concept because it allows us to adjust the sensitivity of our signals. By choosing different percentiles (controlled through the 'Sensitivity' parameter), we can decide whether we want to react only to extreme events (high percentiles) or be more reactive and consider smaller deviations from the norm as significant (lower percentiles).
Finally, the script calculates the Relative Trend Index value, which is essentially a normalized measure indicating where the current price falls between the upper and lower trend values. This simple ratio is incredibly powerful as it provides a standardized measure that can be used across different securities and market conditions to identify potential trading signals.
Core Components
Trend Data Count: This parameter denotes the number of data points used in the RTI's calculation, determining the trend length. A higher count captures a more extended market view (long-term trend), providing smoother results that are more resistant to sudden market changes. In contrast, a lower count focuses on more recent data (short-term trend), yielding faster responses to market changes, albeit at the cost of increased susceptibility to market noise.
Trend Sensitivity Percentage: This parameter is employed to select the indices within the trend arrays used for upper and lower trend definitions. By adjusting this value, users can affect the sensitivity of the trend, with higher percentages leading to a less sensitive trend.
█ How to use
The RTI plots a line that revolves around a mid-point of 50. When the RTI is above 50, it implies that the market trend is bullish (upward), and when it's below 50, it indicates a bearish (downward) trend. Furthermore, the farther the RTI deviates from the 50 line, the stronger the trend is perceived to be.
Bullish
Bearish
The RTI includes user-defined Overbought and Oversold levels. These thresholds suggest potential trading opportunities when they are crossed, serving as a cue for traders to possibly buy or sell. This gives the RTI an additional use case as a mean-reversion tool, in addition to being a trend-following indicator.
In short
Trend Confirmation and Reversals: If the percentage trend value is consistently closer to the upper level, it can indicate a strong uptrend. Similarly, if it's closer to the lower level, a downtrend may be in play. If the percentage trend line begins to move away from one trend line towards the other, it could suggest a potential trend reversal.
Identifying Overbought and Oversold Conditions: When the percentage trend value reaches the upper trend line (signified by a value of 1), it suggests an overbought condition - i.e., the price has been pushed up, perhaps too far, and could be due for a pullback, or indicating a strong positive trend. Conversely, when the percentage trend value hits the lower trend line (a value of 0), it indicates an oversold condition - the price may have been driven down and could be set to rebound, or indicate a strong negative trend. Traders often use these overbought and oversold signals as contrarian indicators, considering them potential signs to sell (in overbought conditions) or buy (in oversold conditions). If the RTI line remains overbought or oversold for an extended period, it indicates a strong trend in that direction.
█ Settings
One key feature of the RTI is its configurability. It allows users to set the trend data length and trend sensitivity.
The trend data length represents the number of data points used in the trend calculation. A longer trend data length will reflect a more long-term trend, whereas a shorter trend data length will capture short-term movements.
Trend sensitivity refers to the threshold for determining what constitutes a significant trend. High sensitivity levels will deem fewer price movements as significant, hence making the trend less sensitive. Conversely, low sensitivity levels will deem more price movements as significant, hence making the trend more sensitive.
-----------------
Disclaimer
The information contained in my Scripts/Indicators/Ideas/Algos/Systems does not constitute financial advice or a solicitation to buy or sell any securities of any type. I will not accept liability for any loss or damage, including without limitation any loss of profit, which may arise directly or indirectly from the use of or reliance on such information.
All investments involve risk, and the past performance of a security, industry, sector, market, financial product, trading strategy, backtest, or individual's trading does not guarantee future results or returns. Investors are fully responsible for any investment decisions they make. Such decisions should be based solely on an evaluation of their financial circumstances, investment objectives, risk tolerance, and liquidity needs.
My Scripts/Indicators/Ideas/Algos/Systems are only for educational purposes!
Selective Moving Average: DemoThis indicator produces a conditional moving average based off of your chosen inputs. For example, you can create an EMA that only takes into account closing prices when the 14 period RSI is greater than 50, or a VWMA that tracks hl2 values when the hl2 value is within one standard deviation from the mean. The possibilities are highly configurable to your liking. Please comment below additional conditions you might like me to add to the moving average and I will try my best to get to your feedback.
The following parameters are configurable:
--> Source: This is the source of the moving average that you want to create. You can use external sources if you have another indicator on your chart.
--> Condition: This is the condition that you want to take into account when the moving average is calculating itself. For instance, I have the following conditions pre-built (more to come): Source within 1 standard deviation of the mean (of the source), Source within 2 standard deviations of the mean (of the source), Positive volume, Negative volume, RSI greater than 50, RSI less than 50, Candlestick length greater than body.
--> Length: The length of the selective moving average. For conditions that occur infrequently, a larger length may be necessary to improve accuracy.
--> Average type: The type of moving average (SMA, EMA, RMA, etc.) that you wish to create
--> Condition length: An optional parameter if you are using a condition that depends on a length itself, i.e. the RSI - here you can change the RSI length. The RSI source will be the moving average source, but future updates may separate the two.

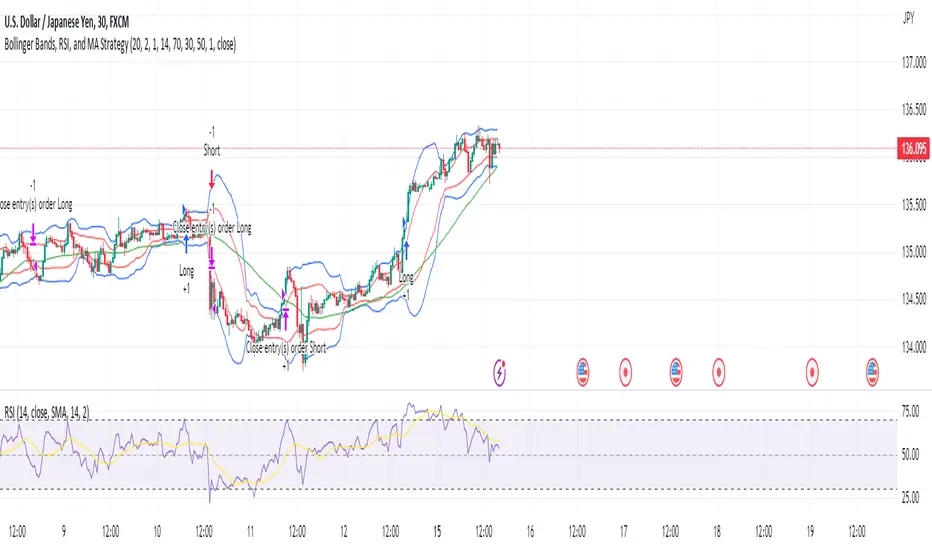
Bollinger Bands, RSI, and MA StrategyThe "Bollinger Bands, RSI and MA Strategy" is a trend-following strategy that combines the Bollinger Bands indicator, the Relative Strength Index (RSI), and a moving average (MA). It aims to identify potential entry and exit points in the market based on price volatility, momentum, and trend.
The strategy uses two Bollinger Bands with different standard deviations to create price channels. The default settings for the Bollinger Bands are a length of 20 periods and a standard deviation of 2.0. The upper and lower bands of the Bollinger Bands serve as dynamic resistance and support levels, respectively.
The RSI indicator is employed to gauge the strength of price momentum.
The strategy also incorporates a 50-period moving average (MA) to help identify the overall trend direction. When the price is above the MA, it suggests an uptrend, and when the price is below the MA, it suggests a downtrend.
The entry conditions for long trades are when the RSI is above the overbought level and there is no contraction in the Bollinger Bands. For short trades, the entry conditions are when the RSI is below the oversold level and there is no contraction in the Bollinger Bands.
The exit conditions for long trades are when the RSI drops below the overbought level or when the price closes below the 50-period MA.
For short trades, the exit conditions are when the RSI goes above the oversold level or when the price closes above the 50-period MA.
The strategy generates alerts for potential long and short entry signals, as well as for exit signals when the specified conditions are met. These alerts can be used to receive notifications or take further actions, such as placing trades manually or using automated trading systems.
It is important to note that this strategy serves as a starting point and should be thoroughly backtested and validated with historical data before applying it to live trading. Additionally, it is recommended to consider risk management techniques, including setting appropriate stop-loss and take-profit levels, to effectively manage trades.
FibonRSI / ErkOziHello,
This software is a technical analysis script written in the TradingView Pine language. The script creates a trading indicator based on Fibonacci retracement levels and the RSI indicator, providing information about price movements and asset volatility by using Bollinger Bands.
There are many different scripts in the market that draw RSI and Fibonacci retracement levels. However, this script was originally designed by me and shared publicly on TradingView.
***The indicator uses RSI (Relative Strength Index) and Bollinger Bands (BB) as the basis for the FibonRSI strategy. RSI measures the strength of a price movement, and BB measures the volatility of an asset. The FibonRSI strategy is based on the idea that the Fibonacci ratios and RSI can be used to predict a asset's price retracement levels.
***The script allows for various parameters to be adjusted. Users can specify the price source type and adjust the periods for RSI and Bollinger Bands. The standard deviation number for Bollinger Bands can also be customized.
***The script calculates the current RSI indicator position and the basic, upper, and lower levels of Bollinger Bands. It then calculates and draws the Fibonacci retracement levels. The color of the RSI line is determined by the upper and lower distribution levels of Bollinger Bands. Additionally, the color of the Fibonacci retracement levels can also be customized by the user.
***This script can be used to determine potential buy and sell signals using Fibonacci retracement levels and RSI. For example, when the RSI is oversold and the price is close to a Fibonacci retracement level, it can be interpreted as a buying opportunity. Similarly, when the RSI is overbought and the price is close to a Fibonacci retracement level, it can be interpreted as a selling opportunity.
***The script takes input parameters such as the price source used for calculation, the period for the RSI indicator, the period for the Moving Average in Bollinger Bands, and the number of standard deviations used in Bollinger Bands.
***The script's conditions include elements such as calculating the current position of the RSI indicator, calculating the upper and lower Bollinger Bands, calculating the dispersion factor, and calculating Fibonacci levels.
***The parameters in the code can be adjusted for calculation, including the price type used, the RSI period, the Moving Average period for BB, and the standard deviation count for BB. After this, the current position of the RSI, Moving Average, and standard deviation for BB are calculated. After calculating the upper and lower BB, the levels above and below the average are calculated using a specific dispersion constant.
CONDITIONS FOR THE SCRIPT
current_rsi = ta.rsi(src, for_rsi) // Current position of the RSI indicator
basis = ta.ema(current_rsi, for_ma)
dev = for_mult * ta.stdev(current_rsi, for_ma)
upper = basis + dev
lower = basis - dev
dispersion = 1
disp_up = basis + (upper - lower) * dispersion
disp_down = basis - (upper - lower) * dispersion
// Fibonacci Levels
f100 = basis + (upper - lower) * 1.0
f78 = basis + (upper - lower) * 0.78
f65 = basis + (upper - lower) * 0.65
f50 = basis
f35 = basis - (upper - lower) * 0.65
f23 = basis - (upper - lower) * 0.78
f0 = basis - (upper - lower) * 1.0
***When calculating Fibonacci levels, the distance between the average of BB and the upper and lower BB is used. These levels are 0%, 23.6%, 35%, 50%, 65%, 78.6%, and 100%. Finally, the RSI line that changes color according to a specific RSI position, Fibonacci levels, and BB are visualized. Additionally, the levels of 70, 30, and 50 are also shown.
The script then sets the color of the RSI position according to the EMA and draws Bollinger Bands, RSI, Fibonacci levels, and the 70, 30, and 50 levels.
In conclusion, this script enables traders to analyze market trends and make informed decisions. It can also be customized to suit individual trading strategies.
This script analyzes the RSI indicator using Bollinger Bands and Fibonacci levels. The default settings are 14 periods for RSI, 233 periods and 2 standard deviations for BB. The MA period inside BB is selected as the BB period and is used when calculating Fibonacci levels.
***The reason for selecting these settings is to provide enough time for BB period to confirm a possible trend. Additionally, the MA period inside BB is matched with the BB period and used when calculating Fibonacci levels.
***Fibonacci levels are calculated from the distance between the upper and lower bands of BB and show how RSI movement is related to these levels. Better results can be achieved when RSI periods are set to Fibonacci numbers such as 21, 55, and 89. Therefore, the use of Fibonacci numbers is recommended when adjusting RSI periods. Fibonacci numbers are among the technical analysis tools that can capture the reflection of naturally occurring movements in the market. Therefore, the use of Fibonacci numbers often helps to better track fluctuations in the market.
Finally, the indicator also displays the 70 and 30 levels and the middle level (50) with Fibonacci levels drawn in circles. Changing these settings can help optimize the Fibonacci levels and further improve the indicator.
Thank you in advance for your suggestions and opinions......

EMA bridge and dashboard with color coding.
Summary:
This is a custom moving average indicator script that calculates and plots different Exponential Moving Averages (EMAs) based on user-defined input values. The script also displays MACD and RSI, and provides a table that displays the current trend of the market in a color-coded format.
Explanation:
- The script starts by defining the name of the indicator and the different inputs that the user can customize.
- The inputs include bridge values for three different EMAs (high, close, and low), and four other EMAs (5, 50, 100, and 200).
- The script assigns values to these inputs using the `ta.ema()` function.
- Additionally, the script calculates EMAs for higher timeframes (3m, 5m, 15m, and 30m).
- The script then plots the EMAs on the chart using different colors and line widths.
- The script defines conditions for going long or short based on the crossover of two EMAs.
- It plots triangles above or below bars to indicate the crossover events.
- The script also calculates and displays the RSI and MACD of the asset.
- Finally, the script creates a table that displays the current trend of the market in a color-coded format. The table can be positioned on the top, middle, or bottom of the chart and on the left, center, or right side of the chart.
Parameters:
- i_ema_h: Bridge value for high EMA (default=34)
- i_ema_c: Bridge value for close EMA (default=34)
- i_ema_l: Bridge value for low EMA (default=34)
- i_ema_5: Value for 5-period EMA (default=5)
- i_ema_50: Value for 50-period EMA (default=50)
- i_ema_100: Value for 100-period EMA (default=100)
- i_ema_200: Value for 200-period EMA (default=200)
- i_f_ema: Value for fast EMA used in MACD calculation (default=9)
- i_s_ema: Value for slow EMA used in MACD calculation (default=21)
- fastInput: Value for fast length used in MACD calculation (default=7)
- slowInput: Value for slow length used in MACD calculation (default=14)
- tableYposInput: Vertical position of the table (options: top, middle, bottom; default=middle)
- tableXposInput: Horizontal position of the table (options: left, center, right; default=right)
- bullColorInput: Color of the table cell for a bullish trend (default=green)
- bearColorInput: Color of the table cell for a bearish trend (default=red)
- neutColorInput: Color of the table cell for a neutral trend (default=white)
- neutColorLabelInput: Color of the label for neutral trend in the table (default=fuchsia)
Usage:
To use this script, simply copy and paste it into the Pine Editor on TradingView. You can then customize the input values to your liking or leave them at their default values. Once you have added the script to your chart, you can view the EMAs, MACD, RSI, and trend table on the chart. The trend table provides a quick way to assess the current trend of the market at a glance.

ICT Concepts [LuxAlgo]The ICT Concepts indicator regroups core concepts highlighted by trader and educator "The Inner Circle Trader" (ICT) into an all-in-one toolkit. Features include Market Structure (MSS & BOS), Order Blocks, Imbalances, Buyside/Sellside Liquidity, Displacements, ICT Killzones, and New Week/Day Opening Gaps.
🔶 SETTINGS
🔹 Mode
When Present is selected, only data of the latest 500 bars are used/visualized, except for NWOG/NDOG
🔹 Market Structure
Enable/disable Market Structure.
Length: will set the lookback period/sensitivity.
In Present Mode only the latest Market Structure trend will be shown, while in Historical Mode, previous trends will be shown as well:
You can toggle MSS/BOS separately and change the colors:
🔹 Displacement
Enable/disable Displacement.
🔹 Volume Imbalance
Enable/disable Volume Imbalance.
# Visible VI's: sets the amount of visible Volume Imbalances (max 100), color setting is placed at the side.
🔹 Order Blocks
Enable/disable Order Blocks.
Swing Lookback: Lookback period used for the detection of the swing points used to create order blocks.
Show Last Bullish OB: Number of the most recent bullish order/breaker blocks to display on the chart.
Show Last Bearish OB: Number of the most recent bearish order/breaker blocks to display on the chart.
Color settings.
Show Historical Polarity Changes: Allows users to see labels indicating where a swing high/low previously occurred within a breaker block.
Use Candle Body: Allows users to use candle bodies as order block areas instead of the full candle range.
Change in Order Blocks style:
🔹 Liquidity
Enable/disable Liquidity.
Margin: sets the sensitivity, 2 points are fairly equal when:
'point 1' < 'point 2' + (10 bar Average True Range / (10 / margin)) and
'point 1' > 'point 2' - (10 bar Average True Range / (10 / margin))
# Visible Liq. boxes: sets the amount of visible Liquidity boxes (max 50), this amount is for Sellside and Buyside boxes separately.
Colour settings.
Change in Liquidity style:
🔹 Fair Value Gaps
Enable/disable FVG's.
Balance Price Range: this is the overlap of latest bullish and bearish Fair Value Gaps.
By disabling Balance Price Range only FVGs will be shown.
Options: Choose whether you wish to see FVG or Implied Fair Value Gaps (this will impact Balance Price Range as well)
# Visible FVG's: sets the amount of visible FVG's (max 20, in the same direction).
Color settings.
Change in FVG style:
🔹 NWOG/NDOG
Enable/disable NWOG; color settings; amount of NWOG shown (max 50).
Enable/disable NDOG ; color settings; amount of NDOG shown (max 50).
🔹 Fibonacci
This tool connects the 2 most recent bullish/bearish (if applicable) features of your choice, provided they are enabled.
3 examples (FVG, BPR, OB):
Extend lines -> Enabled (example OB):
🔹 Killzones
Enable/disable all or the ones you need.
Time settings are coded in the corresponding time zones.
🔶 USAGE
By default, the indicator displays each feature relevant to the most recent price variations in order to avoid clutter on the chart & to provide a very similar experience to how a user would contruct ICT Concepts by hand.
Users can use the historical mode in the settings to see historical market structure/imbalances. The ICT Concepts indicator has various use cases, below we outline many examples of how a trader could find usage of the features together.
In the above image we can see price took out Sellside liquidity, filled two bearish FVGs, a market structure shift, which then led to a clean retest of a bullish FVG as a clean setup to target the order block above.
Price then fills the OB which creates a breaker level as seen in yellow.
Broken OBs can be useful for a trader using the ICT Concepts indicator as it marks a level where orders have now been filled, indicating a solidified level that has proved itself as an area of liquidity. In the image above we can see a trade setup using a broken bearish OB as a potential entry level.
We can see the New Week Opening Gap (NWOG) above was an optimal level to target considering price may tend to fill / react off of these levels according to ICT.
In the next image above, we have another example of various use cases where the ICT Concepts indicator hypothetically allow traders to find key levels & find optimal entry points using market structure.
In the image above we can see a bearish Market Structure Shift (MSS) is confirmed, indicating a potential trade setup for targeting the Balanced Price Range imbalance (BPR) below with a stop loss above the buyside liquidity.
Although what we are demonstrating here is a hindsight example, it shows the potential usage this toolkit gives you for creating trading plans based on ICT Concepts.
Same chart but playing out the history further we can see directly after price came down to the Sellside liquidity & swept below it...
Then by enabling IFVGs in the settings, we can see the IFVG retests alongside the Sellside & Buyside liquidity acting in confluence.
Which allows us to see a great bullish structure in the market with various key levels for potential entries.
Here we can see a potential bullish setup as price has taken out a previous Sellside liquidity zone and is now retesting a NWOG + Volume Imbalance.
Users also have the option to display Fibonacci retracements based on market structure, order blocks, and imbalance areas, which can help place limit/stop orders more effectively as well as finding optimal points of interest beyond what the primary ICT Concepts features can generate for a trader.
In the above image we can see the Fibonacci extension was selected to be based on the NWOG giving us some upside levels above the buyside liquidity.
🔶 DETAILS
Each feature within the ICT Concepts indicator is described in the sub sections below.
🔹 Market Structure
Market structure labels are constructed from price breaking a prior swing point. This allows a user to determine the current market trend based on the price action.
There are two types of Market Structure labels included:
Market Structure Shift (MSS)
Break Of Structure (BOS)
A MSS occurs when price breaks a swing low in an uptrend or a swing high in a downtrend, highlighting a potential reversal. This is often labeled as "CHoCH", but ICT specifies it as MSS.
On the other hand, BOS labels occur when price breaks a swing high in an uptrend or a swing low in a downtrend. The occurrence of these particular swing points is caused by retracements (inducements) that highlights liquidity hunting in lower timeframes.
🔹 Order Blocks
More significant market participants (institutions) with the ability of placing large orders in the market will generally place a sequence of individual trades spread out in time. This is referred as executing what is called a "meta-order".
Order blocks highlight the area where potential meta-orders are executed. Bullish order blocks are located near local bottoms in an uptrend while bearish order blocks are located near local tops in a downtrend.
When price mitigates (breaks out) an order block, a breaker block is confirmed. We can eventually expect price to trade back to this breaker block offering a new trade opportunity.
🔹 Buyside & Sellside Liquidity
Buyside / Sellside liquidity levels highlight price levels where market participants might place limit/stop orders.
Buyside liquidity levels will regroup the stoploss orders of short traders as well as limit orders of long traders, while Sellside liquidity levels will regroup the stoploss orders of long traders as well as limit orders of short traders.
These levels can play different roles. More informed market participants might view these levels as source of liquidity, and once liquidity over a specific level is reduced it will be found in another area.
🔹 Imbalances
Imbalances highlight disparities between the bid/ask, these can also be defined as inefficiencies, which would suggest that not all available information is reflected by the price and would as such provide potential trading opportunities.
It is common for price to "rebalance" and seek to come back to a previous imbalance area.
ICT highlights multiple imbalance formations:
Fair Value Gaps: A three candle formation where the candle shadows adjacent to the central candle do not overlap, this highlights a gap area.
Implied Fair Value Gaps: Unlike the fair value gap the implied fair value gap has candle shadows adjacent to the central candle overlapping. The gap area is constructed from the average between the respective shadow and the nearest extremity of their candle body.
Balanced Price Range: Balanced price ranges occur when a fair value gap overlaps a previous fair value gap, with the overlapping area resulting in the imbalance area.
Volume Imbalance: Volume imbalances highlight gaps between the opening price and closing price with existing trading activity (the low/high overlap the previous high/low).
Opening Gap: Unlike volume imbalances opening gaps highlight areas with no trading activity. The low/high does not reach previous high/low, highlighting a "void" area.
🔹 Displacement
Displacements are scenarios where price forms successive candles of the same sentiment (bullish/bearish) with large bodies and short shadows.
These can more technically be identified by positive auto correlation (a close to open change is more likely to be followed by a change of the same sign) as well as volatility clustering (large changes are followed by large changes).
Displacements can be the cause for the formation of imbalances as well as market structure, these can be caused by the full execution of a meta order.
🔹 Kill Zones
Killzones represent different time intervals that aims at offering optimal trade entries. Killzones include:
- New York Killzone (7:9 ET)
- London Open Killzone (2:5 ET)
- London Close Killzone (10:12 ET)
- Asian Killzone (20:00 ET)
🔶 Conclusion & Supplementary Material
This script aims to emulate how a trader would draw each of the covered features on their chart in the most precise representation to how it's actually taught by ICT directly.
There are many parallels between ICT Concepts and Smart Money Concepts that we released in 2022 which has a more general & simpler usage:
ICT Concepts, however, is more specifically aligned toward the community's interpretation of how to analyze price 'based on ICT', rather than displaying features to have a more classic interpretation for a technical analyst.

Futures/Spot Ratiowhat is Futures /Spot Ratio?
Although futures and spot markets are separate markets, they are correlated. arbitrage bots allow this gap to be closed. But arbitrage bots also have their limits. so there are always slight differences between futures and spot markets. By analyzing these differences, the movements of the players in the market can be interpreted and important information about the price can be obtained. Futures /Spot Ratio is a tool that facilitates this analysis.
what it does?
it compresses the ratio between two selected spot and futures trading pairs between 0 and 100. its purpose is to facilitate use and interpretation. it also passes a regression (Colorful Regression) through the middle of the data for the same purpose.
about Colorful Regression:
how it does it?
it uses this formula:
how to use it?
use it to understand whether the market is priced with spot trades or leveraged positions. A value of 50 is the breakeven point where the ratio of the spot and leveraged markets are equal. Values above 50 indicate excess of long positions in the market, values below 50 indicate excess of short positions. I have explained how to interpret these ratios with examples below.

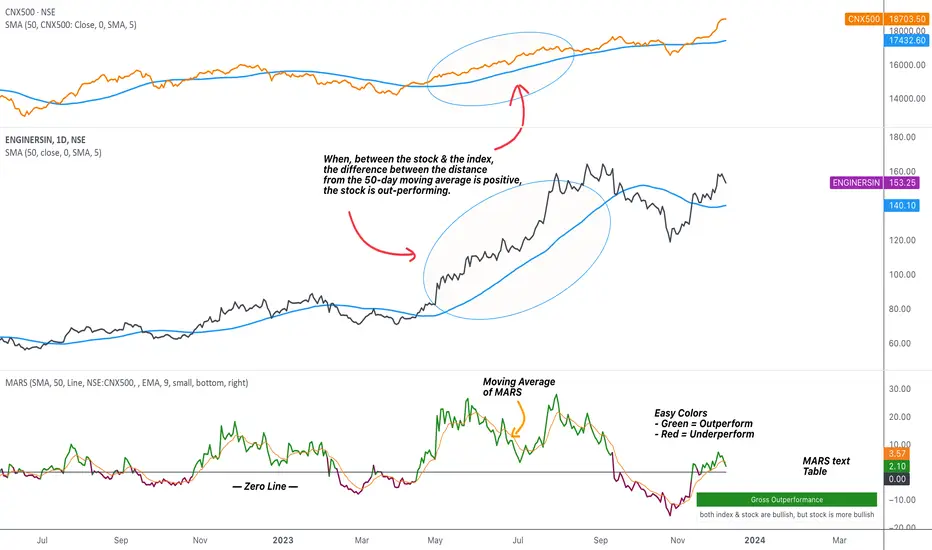
MARS - Moving Average Relative StrengthThe original idea from this script is from the script " Percentage Relative Strength " by dman103 . The original script compared a symbol to an index by their everyday percentage change. The symbol percentage was subtracted from percentage change of the index, & the results were then smoothed by moving averages.
Instead of daily percentage changes, this script directly calculates relative strength via a moving average. We call this simpler approach as MARS (Moving Average Relative Strength) .
MARS compares a symbol to the index by making use of the price's distance from a moving average. By default, we compare the distance from the 50-day simple moving average of the stock vs that of the index. Both the type & the length of the moving average is customisable.
Background color indicates the index being above or below its moving average.
Blue background: index is above its moving average
Pink background: index is below its moving average
The histogram indicates whether the stock is under-performing or out-performing the index.
Up-bars : stock is out-performing the index i.e. between the stock & the index, the difference between the distance to/from the 50-day moving average is a positive value.
Down-bars : stock is under-performing the index i.e. between the stock & the index, the difference between the distance to/from the 50-day moving average is a negative value.
The color of the histogram indicates the type of out-performance or under-performance. There can be a total of 6 such colors:
Relative out-performance : both index & stock are bearish, but stock is less bearish. The script prints light green up-bars on a pink background.
Gross out-performance : both index & stock are bullish, but stock is more bullish. The script prints green up-bars on a blue background.
Absolute out-performance : index is bearish, but stock is bullish! The script prints blue up-bars on a pink background.
Relative under-performance : both index & stock are bullish, but stock is less bullish. The script prints light red bars on a blue background.
Gross under-performance : both index & stock are bearish, but stock is more bearish. The script prints dark red bars on a pink background.
Absolute under-performance : index is bullish, but stock is bearish! The script prints black down-bars on a blue background.
Additional customisation options:
Paint bars option changes the bar colors to mirror the histogram colors.
Easy colors option just changes the histogram colors to either blue or pink, indicating out-performance or under-performance, respectively. This is when the trader does not wish to demarcate between the above-mentioned 6 conditions.
Baseline Cross Qualifier Volatility Strategy with HMA Trend BiasFor trading ES on 30min Chart
Trading Rules
Post Baseline Cross Qualifier (PBCQ): If price crosses the baseline but the trade is invalid due to additional qualifiers, then the strategy doesn't enter a trade on that candle. This setting allows you override this disqualification in the following manner: If price crosses XX bars ago and is now qualified by other qualifiers, then the strategy enters a trade.
Volatility: If price crosses the baseline, we check to see how far it has moved in terms of multiples of volatility denoted in price (ATR x multiple). If price has moved by at least "Qualifier multiplier" and less than "Range Multiplier", then the strategy enters a trade. This range is shown on the chart with yellow area that tracks price above/blow the baseline. Also, see the dots at the top of the chart. If the dots are green, then price passes the volatility test for a long. If the dots are red, then price passes the volatility test for a short.
Take Profit/Stoploss Quantity Removed
1 Take Profit: 100% of the trade is closed when the profit target or stoploss is reached.
2 Take Profits: Quantity is split 50/50 between Take Profit 1 and Take Profit 2
3 Take Profits: Quantify is split 50/25/25.
Stratgey Inputs
Baseline Length
37
Post Baseline Cross Qualifier Enabled
On
Post Baseline Cross Qualifier Bars Ago
9
ATR Length
9
Volatility Multiplier
0
Volatility Range Multiplier
10
Volatility Qualifier Multiplier
2
Take Profit Type
1 Take Profit
HMA Length
11

Dynamo
╭━━━╮
╰╮╭╮┃
╱┃┃┃┣╮╱╭┳━╮╭━━┳╮╭┳━━╮
╱┃┃┃┃┃╱┃┃╭╮┫╭╮┃╰╯┃╭╮┃
╭╯╰╯┃╰━╯┃┃┃┃╭╮┃┃┃┃╰╯┃
╰━━━┻━╮╭┻╯╰┻╯╰┻┻┻┻━━╯
╱╱╱╱╭━╯┃
╱╱╱╱╰━━╯
Overview
Dynamo is built to be the Swiss-knife for price-movement & strength detection, it aims to provide a holistic view of the current price across multiple dimensions. This is achieved by combining 3 very specific indicators(RSI, Stochastic & ADX) into a single view. Each of which serve a different purpose, and collectively provide a simple, yet powerful tool to gauge the true nature of price-action.
Background
Dynamo uses 3 technical analysis tools in conjunction to provide better insights into price movement, they are briefly explained below:
Relative Strength Index(RSI)
RSI is a popular indicator that is often used to measure the velocity of price change & the intensity of directional moves. RSI computes the relative strength of the current price by comparing the security’s bullish strength versus bearish strength for a given period, i.e. by comparing average gain to average loss.
It is a range bound(0-100) variable that generates a bullish reading if average gain is higher, and a bullish reading if average loss is higher. Values over 50 are generally considered bullish & values less than 50 indicate a bearish market. Values over 70 indicate an overbought condition, and values below 30 indicate oversold condition.
Stochastic
Stochastic is an indicator that aims to measure the momentum in the market, by comparing most recent closing price of the security to its price range for a given period. It is based on the assumption that price tends to close near the recent high in an up trend, and it closes near the recent low during a down trend.
It is also range bound(0-100), values over 80 indicate overbought condition and values below 20 indicate oversold condition.
Average Directional Index(ADX)
ADX is an indicator that can quantify trend strength, it is derived from two underlying indices, known as Directional Movement Index(DMI). +DMI represents strength of the up trend, and -DMI represents strength of the down trend, and ADX is the average of the two.
ADX is non-directional or trend-neutral, which means, it does not follow the direction of the price, instead ADX will rise only when there is a strong trend, it does not matter if it’s an up trend or a down trend. Typical ranges of ADX are 25-50 for a strong trend, anything below 25 is considered as no trend or weak trend. ADX can frequently shoot upto higher values, but it generally finds exhaustion levels around the 60-75 range.
About the script
All these indicators are very powerful tools, but just like any other indicator they have their limitations. Stochastic & ADX can generate false signals in volatile markets, meaning price wouldn’t always follow through with what’s being indicated. ADX may even fail to generate a signal in less volatile markets, simply because it is based on moving averages, it tends to react slower to price changes. RSI can also lose it’s effectiveness when markets are trending strong, as it can stay in the overbought or oversold ranges for an extended period of time.
Dynamo aims to provide the trader with a much broader perspective by bringing together these contrasting indicators into a single simplified view. When Stochastic becomes less reliable in highly volatile conditions, one can cross validate their deduction by looking at RSI patterns. When RSI gets stuck in overbought or oversold range, one can refer to ADX to get better picture about the current trend. Similarly, various combinations of rules & setups can be formulated to get a more deterministic view, when working with either of these indicators.
There many possible use cases for a tool like this, and it totally depends on how you want to use it. An obvious option is to use it to trigger signals only after it has been confirmed by two or more indicators, for example, RSI & Stochastic make a great combination for cross-over or cross-under strategies. Some of the other options include trend detection, strength detection, reversals or price rejection points, possible duration of a trend, and all of these can very easily be translated into effective entry and exit points for trades.
How to use it
Dynamo is an easy-to-use tool, just add it to your chart and you’re good to start with your market analysis. Output consists of three overlapping plots, each of which tackle price movement from a slightly different angle.
Stochastic: A momentum indicator that plots the current closing price in relation to the price-range over a given period of time.
Can be used to detect the direction of the price movement, potential reversals, or duration of an up/down move.
Plotted as grey coloured histograms in the background.
Relative Strength Index(RSI): RSI is also a momentum indicator that measures the velocity with which the price changes.
Can be used to detect the speed of the price movement, RSI divergences can be a nice way to detect directional changes.
Plotted as an aqua coloured line.
Average Directional Index(ADX): ADX is an indicator that is used to measure the strength of the current trend.
Can be used to measure how strong the price movement is, both up and down, or to establish long terms trends.
Plotted as an orange coloured line.
Features
Provides a well-rounded view of the market movement by amalgamating some of the best strength indicators, helping traders make better informed decisions with minimal effort.
Simplistic plots that aim to convey clean signals, as a result, reducing clutter on the chart, and hopefully in the trader's head too.
Combines different types of indicators into a single view, which leads to an optimised use of the precious screen real-estate.
Final Note
Dynamo is designed to be minimalistic in functionality and in appearance, as it is being built to be a general purpose tool that is not only beginner friendly, but can also be highly-configurable to meet the needs of pro traders.
Thresholds & default values for the indicators are only suggestions based on industry standards, they may not be an exact match for all markets & conditions. Hence, it is advisable for the user to test & adjust these values according their securities and trading styles.
The chart highlights one of many possible setups using this tool, and it can used to create various types of setups & strategies, but it is also worth noting that the usability & the effectiveness of this tool also depends on the user’s understanding & interpretation of the underlying indicators.
Lastly, this tool is only an indicator and should only be perceived that way. It does not guarantee anything, and the user should do their own research before committing to trades based on any indicator.

Momentum Traffic LightScript was first published 30 May 2021 on twitter by @lehlutz
This script visualizes long, short and neutral phases of any asset class as follows:
The differences A, B, C are formed from 3 moving averages
(3-EMA exponential moving average, 20-SMA simple moving average and 50-SMA simple moving average)
namely
A: (3-EMA minus 20-SMA)
B: (3-EMA minus 50-SMA)
C: (20-SMA minus 50-SMA).
Then the following rules apply to the traffic light (where ∂ means slope).
green traffic light (bullish): (A>0,B>0,C>0), (A>0,B>0,∂C>0), (A>0,∂B>0,C>0) or (A>0,∂B>0,∂C>0, whereas ∂A>0)
red traffic light (bearish): (A<0,B<0,C<0, whereas at least ∂A or ∂B or ∂C is <0) or (A<0,B<0,∂C<0 whereas ∂A and ∂B<0);
yellow traffic light (neutral): all other
Indicator should not be considered as financial advice

Tick based chart [DotH]Version 1.0 - 2nd January 2023
Hi All,
This is my first published indicator, although I have written several hundreds for private use.
Description
Tick based chart
I got intrigued while reading about tick based charts on this page (please note this link/website owner is not affiliated with me) , so I decided to see if it would be possible to recreate this type of chart in TradingView, and here's the results.
This is an implementation for displaying a tick based chart in Trading View. There are benefits to using ticks based candles, as each candle represents the same number of "price moves" rather than an unknown number of moves.
Tick based charts are charts with candles that are rendered in the same way as traditional candles. However, instead of rendering a new candle at a specific time period,tick based candles are rendered after a set number of ticks have occured. For example, in a 50 tick chart, each candle that you see represents exactly 50 ticks, i.e. 50 price changes/moves. Having a view of what happens on the tick level, may help some traders evaluate what is happening within very large candles, or even detect a change in trend, volatility or some other metric which otherwise may not be visible using a standard chart.
Please note that this indicator DOES NOT match/synchronize timewise with the main chart in TradingView. You must view it independently. If you need to see what times are represented in the tick chart, you can look at the custom time labels and X-Axis grid lines in it to get an idea what parts of the tick based chart correspond to the main chart.
Limitations/known issues:
Currently the indicator has been restricted to 100 candles. This is for limiting the line and box usage to a max of 300 objects.
On timeframes above 1 minute, the seconds values will always be 0. In order to be able to see seconds values in the chart scale you need to be on a second level chart, which requires a premium TradingView subscription.
Changing the parameters in the settings will cause the chart to empty and start redrawing from its first candle again. This is because the tick chart is being drawn from realtime data, unlike the standard TradingView charts.
TODOs & Bugs:
Add some moving average indicators (SMA, EMA as a minimum)
Add a corresponding tick based volume chart
Create RSI, MACD, BB variations of this indicator
If you have any ideas/suggestions or bug reports, please feel free to let me know, however keep in mind that I do not have too much spare time to add things, so updates are going to be sporadic.
ABOUT CODE REUSE:
The code is free to use/change. However, if you plan to use this code to make a derivative indicator or strategy, it would be nice to know, so let me know if you feel like it!

VFIBs AgreementVFIBs Agreement is a custom oscillator, using Volume Weighted Fibonacci Bands (VFIBs).
The two values in yellow and teal relate to the price action and where they fall in the Fibonacci Bands for the 50 and 200 VWMAs, respectively. These values are scaled logarithmically, making it so that the 7 period moving averages of the values tend to 'stick' to the top (just above 20) or bottom (just below -20). When the background color is deep red, this indicates that there is bullish momentum and likely a bull market. The inverse, in green, represents bearish momentum or a bear market. These colors correspond to the 200 period VFIB.
The bands of the VFIBs are broken down by fibonacci values as different channels, moving alongside the mid-line above and below. The price action will go between these values, showing where it is in the extremes. This is what VFIBs agreement represents.
In order for an uptrend to begin, the two VFIBs must 'agree'. With the 50 period VFIB trending up, it doesn't matter if it keeps getting rejected by the 200 period, as we can see with Bitcoin. When the 50 period VFIB starts to pull the 200 period up or down, it could indicate an imminent reversal.
This indicator works well with any market that you would use the VFIBs in. Mid and large cap stocks, top cryptocurrencies, and indices are my top choices.
