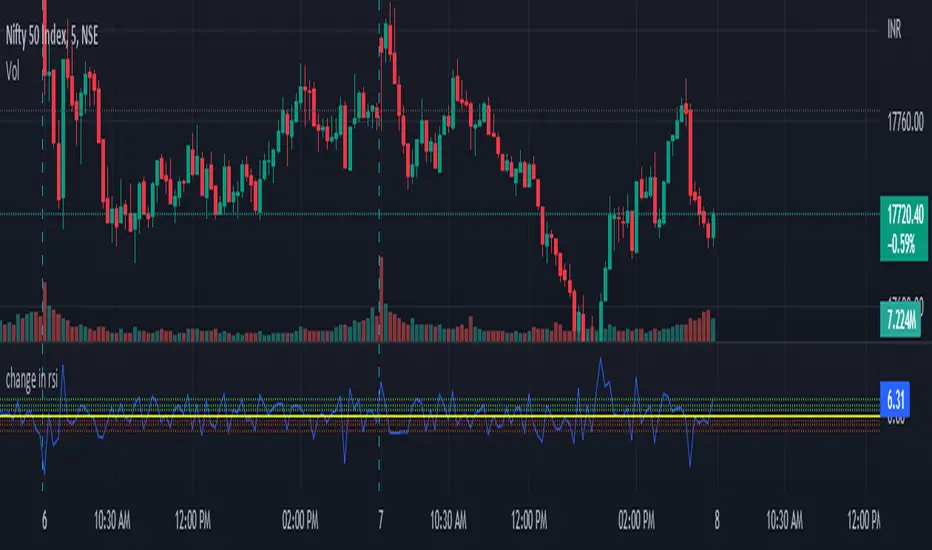
change in rsiThis indicator will show how fast the rsi of a symbol is changing. you can see this as a differentiation function on rsi .
this will show the change in rsi in percentage.
Ex: suppose the rsi of a symbol at present is 60 and the previous value of rsi was 52,
as you can see the rsi has increased, which is a sign of the symbol being bullish .
this indicator will tell by what percentage the rsi of the symbol has increased or decreased.
for the above example, the change in rsi is 15.38% increase.
this is set to default chart time-frame.
"股价站上60月线" için komut dosyalarını ara
Stock Relative Strength Power IndexAs always, this is not financial advice and use at your own risk. Trading is risky and can cost you significant sums of money if you are not careful. Make sure you always have a proper entry and exit plan that includes defining your risk before you enter a trade.
This idea recently came out of some discussions I stumbled across in a trading group I am a part of regarding Relative Strength and Relative Weakness (shortened to RS and RW from here on out). The whole mechanism behind this trading system is to filter out underperforming securities relative to the current market direction to be in only the strongest or weakest stocks when the market is currently experiencing a bullish or bearish cycle. The idea behind this is there is no point in parking your money into a stock that is treading water or even going down if the market is making strong moves upwards. At that point, you are at worst losing money, and at best trading equal to the index/ETF, in which case the argument is why are you not just trading the index/ETF instead? RS or RW will filter out these sector laggards and allow you to position yourself into strong (or the strongest) stocks at any given time to help improve portfolio performance. Further, not only does it protect your position should the market shift against you briefly, it also often sees exceptional performance in the same cycle. For example, if $SPY makes a 5% move over the course of a month, a stock with RS/RW may make a 10% move, or more, allowing you to see increased profit potential.
RS/RW is based on the idea of performance, that is the raw percent change of a security over a given time period relative to a benchmark. This benchmark is often the S&P500 (ES/SPX/SPY and their derivatives). I have to stress that this is not beta, which measures the volatility of a stock over a given period (i.e. if $SPY moves $1, $NVDA will often move $1.74). This is a measurement of the market (i.e. $SPY) has moved 1% over the course of a day, $NVDA has moved 8% over the course of the day. This is very often used as a signal of institutional interest as apart from some very unique moments, retail traders cannot and will not provide enough market pressure to move a market outside of a stock's normal trading range, nor will they outperform the sector or market as a whole consistently over time without some big money to make them move. The problem with running strict performance analysis (i.e. % change from period T ago to period T + n at present) is that while it gives us a baseline of how much the stock has moved, it doesn't overall mean much. For instance, if a $100 stock has moved 5% today, but has been experiencing a period of increased volatility and it's Average True Range (ATR) (the amount a stock will move over X number of periods, on average) is $7, performance seems impressive but is actually generally fairly weak to what the stock has been doing recently. Conversely, if we take a second stock, this time worth $20, and it too has moved 5% in one day but has an ATR of only $0.25, that stock has made an exceptional move and we want to be part of that.
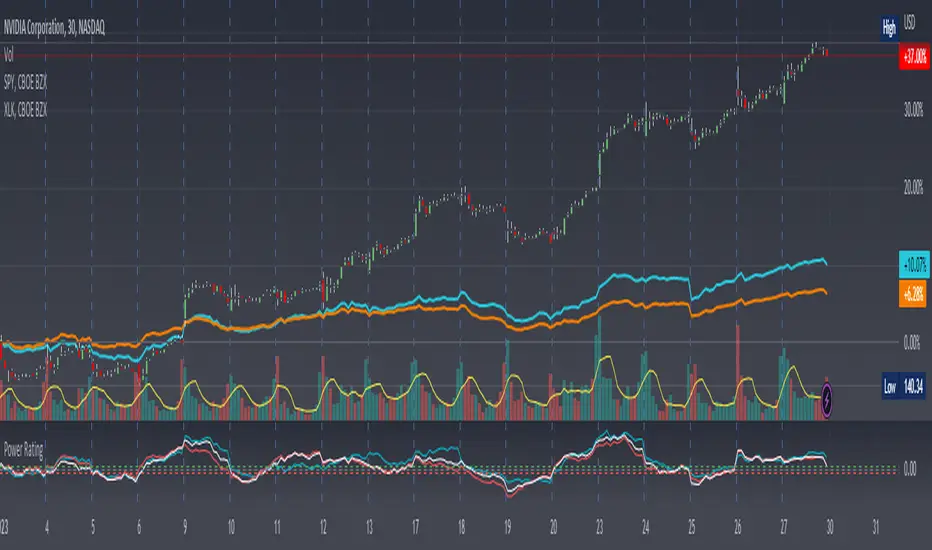
Here, I have created an indicator called the Stock Relative Strength Power Index. This takes the stock's rate of change (ROC) (the % move it has made over X number of periods), the stock's normalized ATR (the ATR represented as a percentage instead of a raw value), and compares these to one another to get the "Power Rating": a representation of the true strength of a stock over X number of periods. The indicator does two things. First, the raw ROC is divided by the stock's normalized ATR to assess whether the stock is moving outside of its normal range of variation or not. Second, since we are interested in trading only stocks with exceptional RS/RW to the market, I have also applied this same calculation to the S&P500 ($SPY) and the various SPDR sector indexes. These comparisons allow for a rapid and accurate assessment of the true strength of a stock at any given time on any given time frame. To cycle back above to our examples, the $100 stock has a Power Rating of only 0.71 (i.e. it is trading less than its current average), while our $20 stock has a Power Rating of 5. If we then compare these to both the market as a whole and the sector that the stock is a part of, we get a much clearer indication of the true buying or selling pressure imposed on the stock at any given time.
Use:
The indicator has 3 lines. The blue line is the security of interest, the red line is the market baseline (i.e. the sector ETF $SPY), and the white line is the sector index. I have given an example above on the semiconductor/tech stock $NVDA on a 30min timeframe. You can see that since the start of 2023, $NVDA has generally been strong to the market and its own sector since the blue line is greater than both the red and white lines over many days. This would have provided some nice day trading opportunities, or even some nice short term swing trades. The values themselves are generally meaningless outside of either the 1 or -1 value lines. All that matters is that the current ticker is surpassing both the market and the sector while being > 1.0 for a long trade or less than -1.0 for a short trade. However, I must stress this indicator gives no trade signals on its own, it is purely a confirmation indicator. An example of a trade would be if you had a trade signal given by either an indicator or by price action suggesting to buy some $NVDA for a trade to the upside, the Power Rating indicator would confirm this by showing if $NVDA was actually showing true strength by being both greater than 1 (the cutoff for it surpassing its ATR) and being above both the red and white lines. Further, you can see $NVDA has been stronger than the market when using the comparison function as well, but the has fluxed in and out of strength intraday when using the actual indicator vs. the static performance ratio chart (plotted as line graphs on the chart).
I have made it possible to change the colour of the plots and the line levels. The adjustment of the line levels gives the trader the flexibility to change their target breakout level (i.e. only trading stocks that have a Power Rating > 2, for example, meaning they are trading at least 2X their normal trading range). The third security comparison is flexible and can be used to compare to the sector ETF (initial intention) or it can be used to compare to other tickers within the same sector, for example. The trader should select the appropriate ETF for the given security of interest to avoid false confirmation if they want to use an ETF as their third input. The proper sector should be readily available on most online websites and accessible in a matter of seconds meaning that the delay is minimal, at worst. If a trader wishes to add additional functionality, such as a crypto trader using BTCUSD as the benchmark instead of $SPY, I encourage them to copy and paste this script and modify as needed since I have made this open source.
This indicator works on all timeframes. The lookback period can be changed, so a day trader who may use a 5min chart (and use a period of 12 to get the hourly Power Rating) will find this equally useful as someone who may be a core trader who wants to look at the performance over the course of years and may use a 60 period on a monthly chart.
Happy trading and I hope this helps!
Multi TF High/Low/Open/Close LineNOTE: I'm not sure why the screengrab isn't showing the lines. They are there, and when I share the chart from this link they are there.... idk
This is a requested spin-off version of my previous HLOC for the Daily/Weekly/Monthly that allows users to choose 3 different timeframe units (Mins, Hours, Days, etc...) from the dropdown menu and then select the lookback period in which to draw the HLOC.
I've had quite a few requests to allow users to see multiple lookbacks for the same timeframe unit, mostly weekly, and I did not wish to change that particular script for that purpose. However, I was able to take the existing script and alter it for user input.
This indicator draws a line on the TF 1, TF 2, and TF 3 bar at the High, Low, Open and Close of user input Timeframe unit and selected lookback period.
The lookback period will go back the number of candles entered. So for example if you choose a 5 Min chart with a lookback of 3, the lines will be drawn on the HLOC 3 closed 5 min candles back. Selecting 0 will show data on the current Real-Time candle.
An example of a request I have gotten was for last week, the previous week and the previous month. The settings for that would be: TF 1 - 1 week Lookback 1, TF 2 - 1 week Lookback 2, TF 3 - 1 month Lookback 1.
Each set of lines has an optional identifying label with its own color set that can be shown with or without price value, and has drop down menus for size and style of each set of labels. The TF unit value is displayed on the label, but not the lookback.
So if you are using the hourly on all 3 TF's with different lookback periods, they will all say "60" on the label.
I recommend using the line and label options to distinguish between the different lookback values.
Each set of lines has inputs for line/text color, line width and style and each line argument can be selected independently.
In the chart example I have displayed only the High and Low on three 1 hour TF's with the lookback of 4, 5 and 6 candles with the labels descending in size. With this data I can see that over the last 6 hours the price of ES is in an descending pattern and I should be on alert for a break.
Since I trade ES in RTH on a much lower timeframe, this data can alert me to a bigger picture potential trend change or continuation. I would personally use this with pivot data for timing and look for entries in areas of high volume that moved price to a new
high or low that have not been retested.
I will be looking to add a user input offset for labels in the future. I have had bad luck with it in the past working for a couple weeks and then throwing an error, but I will look into it again soon.
I also recommend going into Chart Settings/Status Line and turning off indicator arguments OR moving the script to the top of the indicator list to avoid obstructed chart view with this indicators arguments. When script allows, I will update it to hide them.

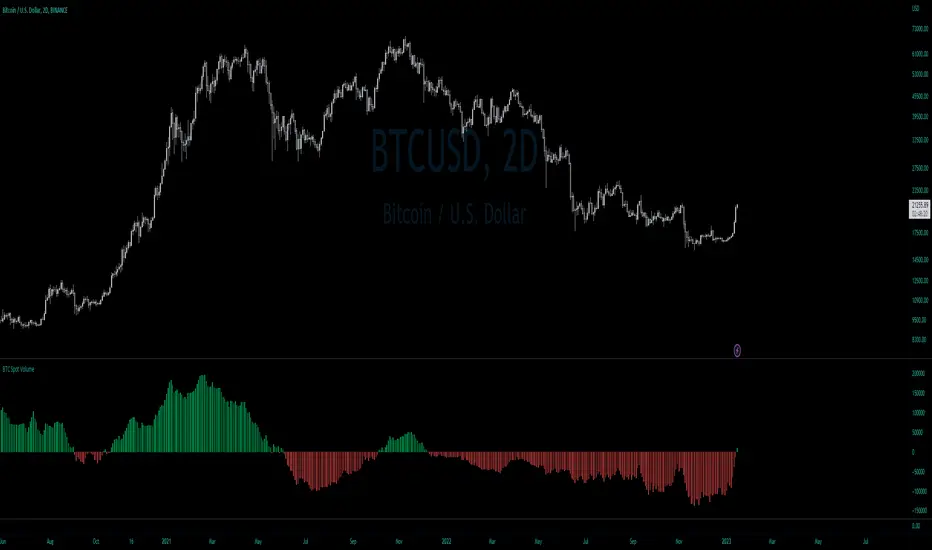
BTC Net Volume (Spot) (by JaggedSoft, fixed by SLN)• WHAT:
This indicator plots the aggregated net volume delta of BTC spot pairs from 8 exchanges over the last 60 periods (default settings).
Tracks the following pairs:
"BINANCE:BTCUSDT"
"BITFINEX:BTCUSD"
"POLONIEX:BTCUSDT"
"BITTREX:BTCUSDT"
"COINBASE:BTCUSD"
"BITSTAMP:BTCUSD"
"KRAKEN:XBTUSD"
"BITGET:BTCUSDT"
"GEMINI:BTCUSD"
• HOW TO USE:
Used for confirmation when watching futures that can experience quick movements in the form of liquidation-events. If the oscillator is green or trending upward, it's confirming a positive bias. The inverse is true for a negative bias. This is especially true on higher timeframes.
Can also be used to find correlations between different tech-assets.
• NOTES:
I forked JaggedSofts indicator to fix the data-source error it was having. Let me know if you want to customize exchanges or add more pairs, maybe I can add that in the future!
This indicator replaces the outdated alternative linked here : Please only use this one
• LIMITATIONS:
Only tested with normal japanese candlesticks .
• THANKS:
to the creator of this script, JaggedSoft. It's a great indicator!
• DISCLAIMER:
Not financial Advice, use at your own risk.
US Fed Rate Hike Historical DatesThe script applies Blue (color can be changed) highlights to the days that the US Federal Reserve Hiked interest rates. Data goes back to the 60's. This can be applied to any chart/timeframe to view how the asset behaved before/during/after Federal Rate Hikes.
****This was updated as of Dec 2022... Any decisions after Dec 2022 will not show up in this indicator.
Versions may be updated periodically to include new data.
Hope this helps. Happy Trades
-SnarkyPuppy

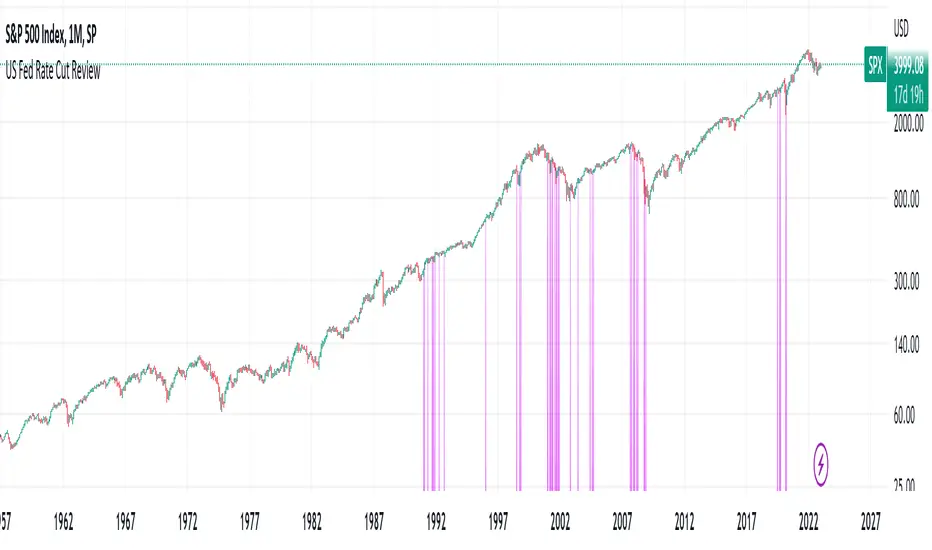
US Fed Rate Cut Historical DatesThe script applies Purple (color can be changed) highlights to the days that the US Federal Reserve Cut interest rates. Data goes back to the 60's. This can be applied to any chart/timeframe to view how the asset behaved before/during/after Federal Rate cuts.
****This was updated as of Dec 2022... Any decisions after Dec 2022 will not show up in this indicator.
Versions may be updated periodically to include new data.
Hope this helps. Happy Trades
-SnarkyPuppy
Multi-Timeframe MA Based Zigzag[liwei666]🎲 Overview
🎯 This Zigzag indicator build based on different MA such as EMA/HMA/RMA/SMA, support multi-timeframe setting .
you can get customer zigzag indicator by change short/long ma length and high-timeframe config(5m/15m/30m/1h/2h) in any symbol.
🎲 Indicator design logic
🎯 entired logic is simple and code looks complex, I‘ll explain core logic here, code already equipped with detailed comments.
1. use close-in EMA's highest/lowest value mark as SWING High/Low when EMA crossover/under, not use func ta.pivothigh()/ta.pivotlow()
2. when EMA crossover/under plot a char as signal like ●/❄/▲, crossover get blue char crossunder get red char
3. latest zigzag line is not drawn until EMA is turned (crossover/under), but signal is realtime
4. you can see diff zigzag structure when you open high-timeframe config, then find regular pattern benefit your trading.
🎲 Settings
🎯 there are 3 group properties in script, just focus on 5 properties in 'GRP1' ,
'GRP2' and 'GRP3' are display config.
'GRP1':
MA_Type: MA type you can choose(EMA/RMA/SMA/HMA/WMA), default is EMA
short_ma_len: short MA length of your current timeframe on chart
long_ma_len: long MA length of your current timeframe on chart
htf_ma_len: MA length of high timeframe, MA type same as 'MA_Type' config
htf_ma_tf: high timeframe ma length, 15/30/60/120 minute
'GRP2':
• show_short_zz • show_long_zz • show_htf_zz:
'GRP3':
• show_short_ma_line • show_short_ma_signal
• show_long_ma_line • show_long_ma_signal
• show_htf_ma_line • show_htf_ma_signal
🎲 Usage
🎯 As we know, MA based signal usually worked fine in trend market , low volatility is unprofitable.
🎯 One of pattern as the chart show below.
1. success example : after a blue ▲ signal, entry long when blue ● signal appear, marked with green box.
2. failed example: after a blue ▲ signal, a red ▼ signal appear, marked with white box.
🎯 BoS(Break of Structure) based on ma zigzag is a good idea I'm implementing, it will be published in next script.
Additionally, I plan to publish 20 profitable strategies in 2023; this indicatior not one of them,
let‘s witness it together!
Hope this indicator will be useful for you :)
enjoy! 🚀🚀🚀

CVD - Cumulative Volume Delta (Chart)█ OVERVIEW
This indicator displays cumulative volume delta (CVD) as an on-chart oscillator. It uses intrabar analysis to obtain more precise volume delta information compared to methods that only use the chart's timeframe.
The core concepts in this script come from our first CVD indicator , which displays CVD values as plot candles in a separate indicator pane. In this script, CVD values are scaled according to price ranges and represented on the main chart pane.
█ CONCEPTS
Bar polarity
Bar polarity refers to the position of the close price relative to the open price. In other words, bar polarity is the direction of price change.
Intrabars
Intrabars are chart bars at a lower timeframe than the chart's. Each 1H chart bar of a 24x7 market will, for example, usually contain 60 bars at the lower timeframe of 1min, provided there was market activity during each minute of the hour. Mining information from intrabars can be useful in that it offers traders visibility on the activity inside a chart bar.
Lower timeframes (LTFs)
A lower timeframe is a timeframe that is smaller than the chart's timeframe. This script utilizes a LTF to analyze intrabars, or price changes within a chart bar. The lower the LTF, the more intrabars are analyzed, but the less chart bars can display information due to the limited number of intrabars that can be analyzed.
Volume delta
Volume delta is a measure that separates volume into "up" and "down" parts, then takes the difference to estimate the net demand for the asset. This approach gives traders a more detailed insight when analyzing volume and market sentiment. There are several methods for determining whether an asset's volume belongs in the "up" or "down" category. Some indicators, such as On Balance Volume and the Klinger Oscillator , use the change in price between bars to assign volume values to the appropriate category. Others, such as Chaikin Money Flow , make assumptions based on open, high, low, and close prices. The most accurate method involves using tick data to determine whether each transaction occurred at the bid or ask price and assigning the volume value to the appropriate category accordingly. However, this method requires a large amount of data on historical bars, which can limit the historical depth of charts and the number of symbols for which tick data is available.
In the context where historical tick data is not yet available on TradingView, intrabar analysis is the most precise technique to calculate volume delta on historical bars on our charts. This indicator uses intrabar analysis to achieve a compromise between simplicity and accuracy in calculating volume delta on historical bars. Our Volume Profile indicators use it as well. Other volume delta indicators in our Community Scripts , such as the Realtime 5D Profile , use real-time chart updates to achieve more precise volume delta calculations. However, these indicators aren't suitable for analyzing historical bars since they only work for real-time analysis.
This is the logic we use to assign intrabar volume to the "up" or "down" category:
• If the intrabar's open and close values are different, their relative position is used.
• If the intrabar's open and close values are the same, the difference between the intrabar's close and the previous intrabar's close is used.
• As a last resort, when there is no movement during an intrabar and it closes at the same price as the previous intrabar, the last known polarity is used.
Once all intrabars comprising a chart bar are analyzed, we calculate the net difference between "up" and "down" intrabar volume to produce the volume delta for the chart bar.
█ FEATURES
CVD resets
The "cumulative" part of the indicator's name stems from the fact that calculations accumulate during a period of time. By periodically resetting the volume delta accumulation, we can analyze the progression of volume delta across manageable chunks, which is often more useful than looking at volume delta accumulated from the beginning of a chart's history.
You can configure the reset period using the "CVD Resets" input, which offers the following selections:
• None : Calculations do not reset.
• On a fixed higher timeframe : Calculations reset on the higher timeframe you select in the "Fixed higher timeframe" field.
• At a fixed time that you specify.
• At the beginning of the regular session .
• On trend changes : Calculations reset on the direction change of either the Aroon indicator, Parabolic SAR , or Supertrend .
• On a stepped higher timeframe : Calculations reset on a higher timeframe automatically stepped using the chart's timeframe and following these rules:
Chart TF HTF
< 1min 1H
< 3H 1D
<= 12H 1W
< 1W 1M
>= 1W 1Y
Specifying intrabar precision
Ten options are included in the script to control the number of intrabars used per chart bar for calculations. The greater the number of intrabars per chart bar, the fewer chart bars can be analyzed.
The first five options allow users to specify the approximate amount of chart bars to be covered:
• Least Precise (Most chart bars) : Covers all chart bars by dividing the current timeframe by four.
This ensures the highest level of intrabar precision while achieving complete coverage for the dataset.
• Less Precise (Some chart bars) & More Precise (Less chart bars) : These options calculate a stepped LTF in relation to the current chart's timeframe.
• Very precise (2min intrabars) : Uses the second highest quantity of intrabars possible with the 2min LTF.
• Most precise (1min intrabars) : Uses the maximum quantity of intrabars possible with the 1min LTF.
The stepped lower timeframe for "Less Precise" and "More Precise" options is calculated from the current chart's timeframe as follows:
Chart Timeframe Lower Timeframe
Less Precise More Precise
< 1hr 1min 1min
< 1D 15min 1min
< 1W 2hr 30min
> 1W 1D 60min
The last five options allow users to specify an approximate fixed number of intrabars to analyze per chart bar. The available choices are 12, 24, 50, 100, and 250. The script will calculate the LTF which most closely approximates the specified number of intrabars per chart bar. Keep in mind that due to factors such as the length of a ticker's sessions and rounding of the LTF, it is not always possible to produce the exact number specified. However, the script will do its best to get as close to the value as possible.
As there is a limit to the number of intrabars that can be analyzed by a script, a tradeoff occurs between the number of intrabars analyzed per chart bar and the chart bars for which calculations are possible.
Display
This script displays raw or cumulative volume delta values on the chart as either line or histogram oscillator zones scaled according to the price chart, allowing traders to visualize volume activity on each bar or cumulatively over time. The indicator's background shows where CVD resets occur, demarcating the beginning of new zones. The vertical axis of each oscillator zone is scaled relative to the one with the highest price range, and the oscillator values are scaled relative to the highest volume delta. A vertical offset is applied to each oscillator zone so that the highest oscillator value aligns with the lowest price. This method ensures an accurate, intuitive visual comparison of volume activity within zones, as the scale is consistent across the chart, and oscillator values sit below prices. The vertical scale of oscillator zones can be adjusted using the "Zone Height" input in the script settings.
This script displays labels at the highest and lowest oscillator values in each zone, which can be enabled using the "Hi/Lo Labels" input in the "Visuals" section of the script settings. Additionally, the oscillator's value on a chart bar is displayed as a tooltip when a user hovers over the bar, which can be enabled using the "Value Tooltips" input.
Divergences occur when the polarity of volume delta does not match that of the chart bar. The script displays divergences as bar colors and background colors that can be enabled using the "Color bars on divergences" and "Color background on divergences" inputs.
An information box in the lower-left corner of the indicator displays the HTF used for resets, the LTF used for intrabars, the average quantity of intrabars per chart bar, and the number of chart bars for which there is LTF data. This is enabled using the "Show information box" input in the "Visuals" section of the script settings.
FOR Pine Script™ CODERS
• This script utilizes `ltf()` and `ltfStats()` from the lower_tf library.
The `ltf()` function determines the appropriate lower timeframe from the selected calculation mode and chart timeframe, and returns it in a format that can be used with request.security_lower_tf() .
The `ltfStats()` function, on the other hand, is used to compute and display statistical information about the lower timeframe in an information box.
• The script utilizes display.data_window and display.status_line to restrict the display of certain plots.
These new built-ins allow coders to fine-tune where a script’s plot values are displayed.
• The newly added session.isfirstbar_regular built-in allows for resetting the CVD segments at the start of the regular session.
• The VisibleChart library developed by our resident PineCoders team leverages the chart.left_visible_bar_time and chart.right_visible_bar_time variables to optimize the performance of this script.
These variables identify the opening time of the leftmost and rightmost visible bars on the chart, allowing the script to recalculate and draw objects only within the range of visible bars as the user scrolls.
This functionality also enables the scaling of the oscillator zones.
These variables are just a couple of the many new built-ins available in the chart.* namespace.
For more information, check out this blog post or look them up by typing "chart." in the Pine Script™ Reference Manual .
• Our ta library has undergone significant updates recently, including the incorporation of the `aroon()` indicator used as a method for resetting CVD segments within this script.
Revisit the library to see more of the newly added content!
Look first. Then leap.

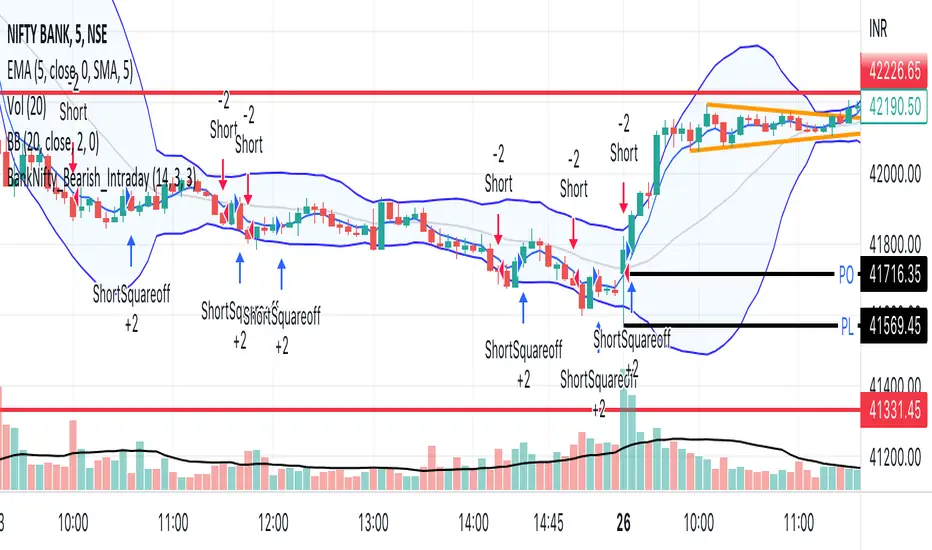
BankNifty_Bearish_Intraday
The script uses following mechanism to give a signal of SELL if multiple parameters evaluated are all passed.
ENTRY-
1. 5 min MACD should be less than its previous tick
2. 15 min MACD should be less than its previous tick
3. 60 min MACD should be less than its previous tick
4. ADX should be more than 12
5. RSI should be less than 40
6. Stochastic %k should have negative cross over with %d
7. Bollinger band lower band value should be less than previous tick
EXIT
If the 5 min bar price closes above 5 min EMA , it gives an exit signal.
Delox EMA CrossThis indicator works with the change of trend of emas
When the fast 14 crosses above the 21 this is an uptrend.
and when the slow ema of 21 crosses below the slow ema of 14 then we have a downtrend.
It is accompanied by the Stochastic indicator that when there is a cross of Emas will give a bullish or bearish signal.
Bearish signal
When the D-stochastic or the Orange line of the stochastic is greater than 60 and there is a trend reversal crossover it will give a bearish signal painted on the background of the chart.
Bullish signal
When the stochastic D which is the orange line of the stochastic is less than 30 and has a line crossing on the lines it will give a bullish signal.
White bar
White bar appears when there is a change in trend between ema 14 and ema 21.
Remember this is not an investment recommendation this script is for educational purposes only.
If you like the script please follow me this helps a lot and you can also follow me this would help me a lot to keep uploading videos and new scripts for the community.

Weird Renko StratThis strategy uses Renko, it generates a signal when there is a reversal in Renko. When using historical data, it provides a good entry and an okay exit. However, in a real-time environment, this strategy is subject to repaint and may produce a false signal.
As a result, the backtesting result should not be used as a metric to predict future results. It is highly recommended to forward-test the strategy before using it in real trading. I forward test it from 12/18/2022 to 12/21/2022 in paper trading, using the alert feature in Tradingview. I made 60 trades trading the BTCUSDT BINANCE 3 min with 26 as the param and under the condition that I use 20x margin, compounding my yield, and having 0 trading fee, a steady loss is generated: from $10 to $3.02.
This is quite interesting. As if I flip the signal from "Long" to "Short" and another way too, it will be a steady profit from $10 to $21.85. Hence, if I'm trying to anti-trade the real-time alert signal, the current "4 Days Result" will be good. Nevertheless, I still have to forward-test it for longer to see if it will fail eventually.
Dive into the setting of the strategy
- Margin is the leverage you use. 1 means 1x, 10 means 10x. It affects the backtest yield when you backtest
- Compound Yield button is for compound calculation, disable it to go back to normal backtesting
- Anti Strategy button is to do the opposite direction trade, when the original strat told you to "Long", you "Short" instead. Enable it to use the feature
- Param is the block size for the Renko chart
- Drawdown is just a visual tool for you in case you want to place a stop loss (represent by the semitransparent red area in the chart)
- From date Thru Date is to specify the backtest range of the strategy, This feature is turned off by default. It is controlled by the Max Backtest Timeframe which will be explain below
- Max Backtest Timeframe control the From date Thru Date function, disable it to enable the From Date Thru Date function
Param is the most important input in this strategy as it directly affects performance. It is highly recommended to backtest nearly all the possible parameters before deploying it in real trading. Some factors should be considered:
- Price of the asset (like an asset of 1 USD vs an asset of 10000 USD required different param)
- Timeframe (1-minute param is different than 1-month param)
I believe this is caused by the volatility of the selected timeframe since different timeframe has different volatility. Param should be fine-tuned before usage.
Here is the param I'm using:
BTCUSDT BINANCE 3min: 26
BTCUSDT BINANCE 5min: 28
BTCUSDT BINANCE 1day: 15
Background of the strategy:
- The strategy starts with $10 at the start of backtesting (customizable in setting)
- The trading fee is set to 0.00% which is not common for most of the popular exchanges (customizable in setting)
- The contract size is not a fixed amount, but it uses your balance to buy it at the open price. If you are using the compound mode, your balance will be your current total balance. If you are using the non-compound mode, it will just use the $10 you start with unless you change the amount you start with. If you are using a margin higher than 1, it will calculate the corresponding contract size properly based on your margin. (Only these options are allowed, you are not able to change them without changing the code)

Percentile Nearest Rank Rainbow Overlay (PNRV)The Percentile Nearest Rank Rainbow Overlay (PNRV) is an indicator for the TradingView platform that aims to visualize the ranking of a given source data within its own percentile range.
The PNRV indicator takes a single input, "src", which is the source data that the indicator will operate on. This input can be any series of data, such as stock prices, volume, or any other numerical data.
The indicator then maps the values of the src data onto a gradient of 60 colors, ranging from blue to green to yellow, with each color representing a percentile range. For example, values in the 0th percentile will be represented by a deep blue color, while values in the 50th percentile will be represented by a yellow color.
The PNRV indicator is designed to be overlaid on top of a chart, with the color of each data point representing its percentile ranking within the src data. This allows traders to easily identify trends and patterns within the data, as well as to compare the relative strength or weakness of different securities.
One potential use case for the PNRV indicator is in identifying potential overbought or oversold conditions in a stock or other security. For example, if the PNRV indicator shows that a stock's price is consistently ranking in the upper percentiles, this could be a sign that the stock is overbought and may be due for a correction. Conversely, if the PNRV indicator shows that a stock's price is consistently ranking in the lower percentiles, this could be a sign that the stock is undervalued and may be a good buying opportunity.
Overall, the PNRV indicator is a useful tool for traders looking to quickly and easily visualize the ranking of a given data series within its own percentile range.

ICT Killzone by JeawThis is an indicator script for TradingView called "ICT Killzone". It is a useful tool for identifying the London and New York open and close sessions, as well as the Asian range on the chart. The appearance of the "killzones" can be customized by selecting colors and transparencies for each session. Boxes can also be displayed around each session and labels with additional information can be added. This script is compatible with intraday charts and time multipliers up to 60 minutes. It was created by Jeaw and is based on the ideas of the ICT (Institutional Cash Trades) methodology. This script can help traders avoid entering the market during high impact news events and periods of low liquidity. By identifying these potentially volatile times, traders can better manage their risk and improve their overall trading strategy.

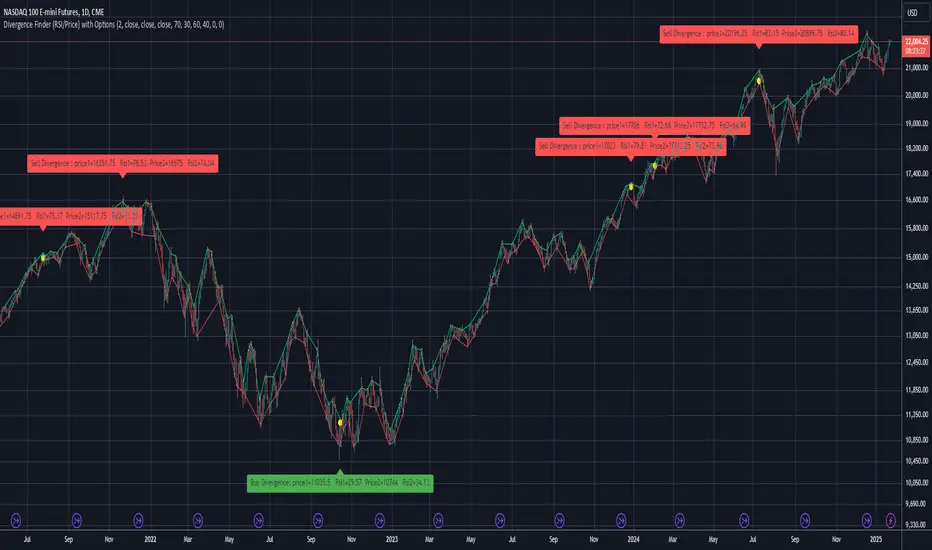
Divergence Finder (RSI/Price) with OptionsDivergence finder used to find BUY or SELL Signal based on a divergence between Price and RSI (Price goes UP when RSI goes down / opposite )
You can configure the script with several Options :
Source for Price Buy Div : you can use the close price of the candle (by default) or use the high price of the candle for exemple.
Source for Price Sell Div : you can use the close price of the candle (by default) or use the low price of the candle for exemple.
Source for RSI Div : you can use the close price of the candle (by default) to calculate the RSI .
Theses settings allow you to set a minimum RSI level to reach to activate the Divergence finder (p1 is the first point in time, and p2 is the second one):
Min RSI for Sell divergence(p1) : this is the minimum RSI level to reach for the first of the 2 points of divergence (Default 70) for the SELL Signal
Min RSI for Sell divergence (p2) : this is the minimum RSI level to reach for the second of the 2 points of divergence (Default 60) for the SELL Signal
Max RSI for Buy divergence (p1) : this is the minimum RSI level to reach for the first of the 2 points of divergence (Default 30) for the BUY Signal
Max RSI for Buy divergence (p2) : this is the minimum RSI level to reach for the second of the 2 points of divergence (Default 40 ) for the BUY Signal
Theses settings allow you to set a minimum margin difference between our two points (p1 and p2) to validate the Divergence
Min margin between price for displaying divergence (%) : Set a minimum margin (in % of the price) before the indicator validate this divergence
Min margin between RSI for displaying divergence (%) : Set a minimum margin (in % of the RSI ) before the indicator validate this divergence
Display Divergence label : Choose to display the price of the candle, and the RSI when a divergence is found
Display tops/bottoms : Display where the tops and bottoms are calculated directly on the chart
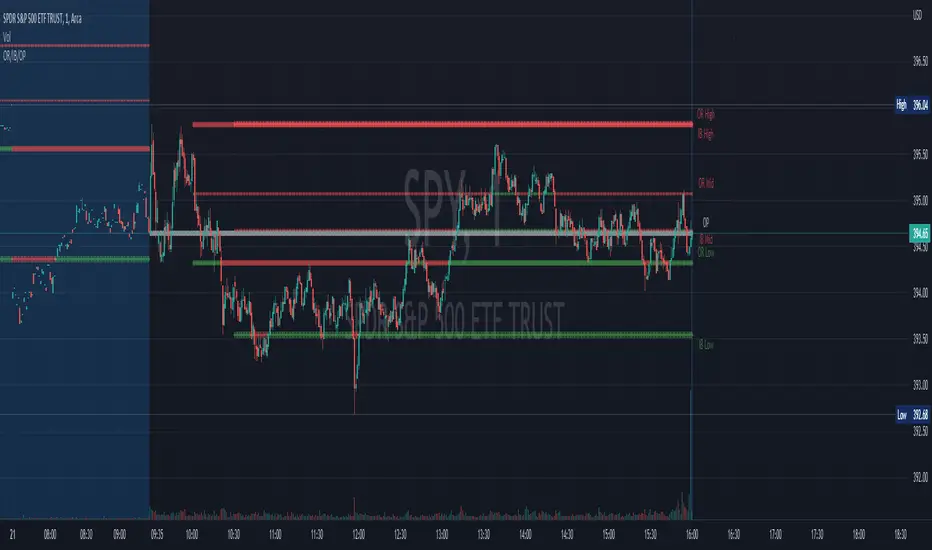
Opening Range, Initial Balance, Opening PriceThis script draws Opening Range, Initial Balance and Opening Price with options to show mid levels.
By default, lines changes color depending on whether closing price is above or below the lines. Red if price is below, green if price is above.
Colors and line styles are all configurable.
Options to change label positions.
Some definitions:
Opening Range - The opening range is high and low for a given period after the market opens. This period is generally the first 30 or 60 minutes of trading
Initial Balance - WRT to TPO profile chart, the Initial Balance is the price range resulting from the market’s trade during the first two 30 minute periods of the regular trading hours session.
Why is this useful?
The first hour of the trading day is the most active and dynamic period. The price range defined by this period of trading creates some key support / resistance levels for the rest of the day. Example below:
[blackcat] L1 N-Shape AttackLevel 1
Background
At the beginning of the stock price rise, the stock form is a buying point in the "N" shape.
Function
This form is the same as the "N" shape. What is pursued is the strength of the skyrocketing rise after the sharp rise and fall. The adjustment time in the middle of the N shape must not exceed 3-4 days! If it is an aggressive Changyang, the total adjustment cycle must not exceed 5 days. A simple summary is: skyrocketing + quick callback + skyrocketing again! There has been a solid sun candle in the early stage, and a real sun candle appeared again after a few days of adjustment.
Key points of the N-shaped attack pattern:
1. The shorter the adjustment time, the better, indicating that individual stocks are already quite strong, and the rush to raise funds is quite obvious. It is best to only adjust for 1 day. The most extreme is a big rise and then a big fall and then a big rise. This is the most ideal. Adjust on 2 days and then follow. It is best to adjust the number of days below 5 days. The longer the adjustment time, the less obvious the effect.
2. The smaller the adjustment range, the better, and it is better if the lowest point during the adjustment period does not fall below the lowest point of the previous big rising candle.
3. It is more ideal if the closing price of the latter surge is higher than the highest price of the previous surge, and it is even more ideal if it exceeds the height of the adjustment period.
4. When selecting stocks, try to select stocks whose 20-day and 60-day moving averages have started to rise, preferably in a long-term arrangement.
Market logic of N-shaped attack:
The main force took advantage of the opportunity to pull out the first big positive candle in the early stage, and then took advantage of the profit taking or the index pullback, and there was a rapid 1-3 day downward kill, just returning to the initial position of the previous big positive candle, and then increased the volume again Rising to new highs.
Remarks
The long signal frequency is low.
Feedbacks are appreciated.

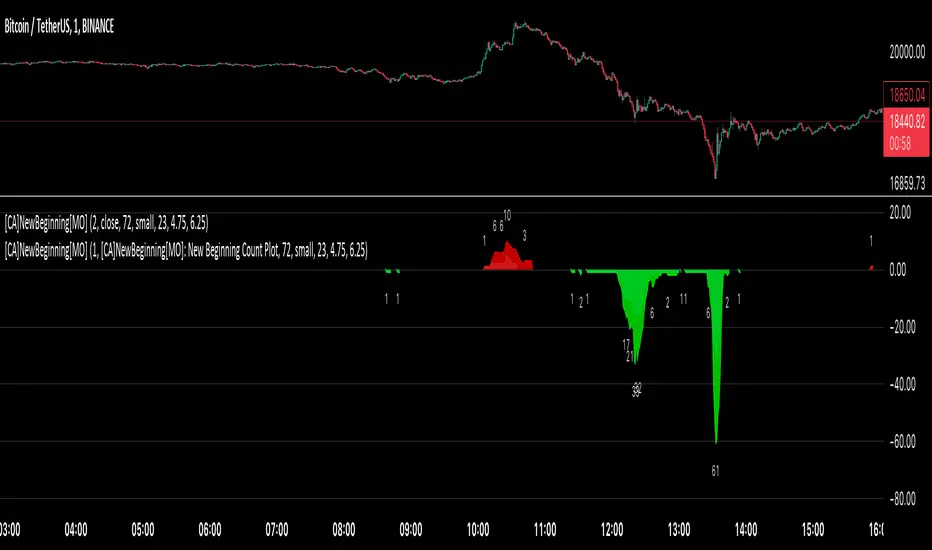
[ChasinAlts] A New Beginning[MO]Hello Tradeurs, firstly let me say this… Please do not think that this dump is over (so I want to gift you one of the best gifts I CAN gift you at the PERFECT TIME...which is now) but I believe it to be the final one before a New Beginning is upon us. I hope that anybody that sees this within the next day or so listens to me when I tell you this… Follow the instructions below, IF ANYTHING, just to set the alert to be notify you so you can see why I’m about to tell you everything that I’m about to tell you. That being that this indicator is pure magic…..BUT you must stay in your lane when using it (ie. ultimately, understand its use case) and most importantly, how many people you expose it to. The good thing about it is it produces very few alerts. In fact, it was built SOLELY to find the very tips of MAJOR dumps/pumps (with its current default settings). I honestly cannot remember where I acquired the code so if anyone recognizes it please direct me to the source so I can give a shoutout. In the past it has been so astonishingly accurate that I didn’t want to publish it but I've just been...in the mood I suppose recently.
Now…it is SPECIFICALLY meant for the 1min TF. I’ll say it again… It is meant for ONE MINUTE CHARTS…it was built for 1min charts, it will only work as well as I’m describing to you on the…you guessed it…ONE MINUTE CHART (again, with the default settings how they are, that is). If any of you use it for this present dump (November 8, 2022) and want to thank me for it or speak very highly about it or give it a bunch of likes… DO NOT!!! I will reword this so you fully comprehend my urgency on this matter. I do not want this indicator getting out for every Joe Schmoe (or stupid YouTuber) to use and spread because the manipulators will see to it that it will no longer work. Things that will happen that will cause it to gain the popularity that I do not want it to have are the following:
1) You "like" the indicator in TradingView to show appreciation/that your using it so that it will show up in your indicators list (to get past this you need to select all of the text of the script on the indicator's page and copy and paste it into the “Pine Editor”. Then select "save" and name it as you wish. Now, it is in your indicator list under the name that you saved it as.
2) You *favorite* the indicator in TradingView
3) You leave comments in the comments section on the indicators page in TradingView (I really do love hearing comments about anything regarding my indicators(positive or negative..though I haven't gotten any negative yet SO BRING IT ON), even though I don’t get too many of them, so if you are grateful (or hateful) PLEASE message me privately (and really I truly truly do appreciate getting comments/messages so if it has benefited you make sure to message me as I might have more for those that do express their gratitude) and tell me anything that you want to tell me or ask me anything that you wanna ask me there).
One major thing that will help to suppress its popularity will be that if anybody goes back on historical charts to see its accuracy they most likely will not be able to go far back enough on the 1min TF to be able to Witness its efficacy so I'm banking on that helping to keep a lid on things.
The settings used (as well as the TF used) really should not be changed if using it for its intended purpose. On little dumps that last for a few hours os so will produce points somewhere in the 40 to 60 range at the dumps/pumps peak. Each coin is worth one point and there are 40 coins per set and 2 sets (that you will have to link together) and when the under the hood indicator is triggered for that coin it will add a point to the score. With the settings how they are and on the 1min TF(if I hadn't mentioned it yet. lol) a good point alert threshold to use to catch the apex of heavy pumps/dumps would be between 70 to 80 points(80 is max). Ultimately is the users choice to input the alert threshold of points in the indicators settings(default is 72). If you’re trying to nail the very bottom of a hard pump/dump, DO NOT fall for times where it peaks at 50 to 60. You’re looking for 70 or above.
*** This is the most important thing to do as you will not receive an alert if you do not do this correctly. You have to add the indicator two times to the chart. One of the indicators needs to be under “Coin Set 1“ and the other under “Coin Set 2“. Now, in “Set 1“ you need to go to the setting entitled “Select New Beginning Count Plot from drop-down“ and you need to open the drop-down and select the plot entitled “A New Beginning Count Plot”. This will link both the indicators and since there are 40 coins per iteration of the script, when you link them it could give you a max of 80 points total at the very peak of a very strong dump...which will obviously be rare. You CAN use only one copy of the script (but need to change the alert setting to a MAX of 40) but in my experience it's best to use both of them and to link them. It gives you a more well-rounded outcome. Good luck my people and always remember...Much love...Much Love. May the force be with your trades. -ChasinAlts out.
Intrabar Efficiency Ratio█ OVERVIEW
This indicator displays a directional variant of Perry Kaufman's Efficiency Ratio, designed to gauge the "efficiency" of intrabar price movement by comparing the sum of movements of the lower timeframe bars composing a chart bar with the respective bar's movement on an average basis.
█ CONCEPTS
Efficiency Ratio (ER)
Efficiency Ratio was first introduced by Perry Kaufman in his 1995 book, titled "Smarter Trading". It is the ratio of absolute price change to the sum of absolute changes on each bar over a period. This tells us how strong the period's trend is relative to the underlying noise. Simply put, it's a measure of price movement efficiency. This ratio is the modulator utilized in Kaufman's Adaptive Moving Average (KAMA), which is essentially an Exponential Moving Average (EMA) that adapts its responsiveness to movement efficiency.
ER's output is bounded between 0 and 1. A value of 0 indicates that the starting price equals the ending price for the period, which suggests that price movement was maximally inefficient. A value of 1 indicates that price had travelled no more than the distance between the starting price and the ending price for the period, which suggests that price movement was maximally efficient. A value between 0 and 1 indicates that price had travelled a distance greater than the distance between the starting price and the ending price for the period. In other words, some degree of noise was present which resulted in reduced efficiency over the period.
As an example, let's say that the price of an asset had moved from $15 to $14 by the end of a period, but the sum of absolute changes for each bar of data was $4. ER would be calculated like so:
ER = abs(14 - 15)/4 = 0.25
This suggests that the trend was only 25% efficient over the period, as the total distanced travelled by price was four times what was required to achieve the change over the period.
Intrabars
Intrabars are chart bars at a lower timeframe than the chart's. Each 1H chart bar of a 24x7 market will, for example, usually contain 60 intrabars at the LTF of 1min, provided there was market activity during each minute of the hour. Mining information from intrabars can be useful in that it offers traders visibility on the activity inside a chart bar.
Lower timeframes (LTFs)
A lower timeframe is a timeframe that is smaller than the chart's timeframe. This script determines which LTF to use by examining the chart's timeframe. The LTF determines how many intrabars are examined for each chart bar; the lower the timeframe, the more intrabars are analyzed, but fewer chart bars can display indicator information because there is a limit to the total number of intrabars that can be analyzed.
Intrabar precision
The precision of calculations increases with the number of intrabars analyzed for each chart bar. As there is a 100K limit to the number of intrabars that can be analyzed by a script, a trade-off occurs between the number of intrabars analyzed per chart bar and the chart bars for which calculations are possible.
Intrabar Efficiency Ratio (IER)
Intrabar Efficiency Ratio applies the concept of ER on an intrabar level. Rather than comparing the overall change to the sum of bar changes for the current chart's timeframe over a period, IER compares single bar changes for the current chart's timeframe to the sum of absolute intrabar changes, then applies smoothing to the result. This gives an indication of how efficient changes are on the current chart's timeframe for each bar of data relative to LTF bar changes on an average basis. Unlike the standard ER calculation, we've opted to preserve directional information by not taking the absolute value of overall change, thus allowing it to be utilized as a momentum oscillator. However, by taking the absolute value of this oscillator, it could potentially serve as a replacement for ER in the design of adaptive moving averages.
Since this indicator preserves directional information, IER can be regarded as similar to the Chande Momentum Oscillator (CMO) , which was presented in 1994 by Tushar Chande in "The New Technical Trader". Both CMO and ER essentially measure the same relationship between trend and noise. CMO simply differs in scale, and considers the direction of overall changes.
█ FEATURES
Display
Three different display types are included within the script:
• Line : Displays the middle length MA of the IER as a line .
Color for this display can be customized via the "Line" portion of the "Visuals" section in the script settings.
• Candles : Displays the non-smooth IER and two moving averages of different lengths as candles .
The `open` and `close` of the candle are the longest and shortest length MAs of the IER respectively.
The `high` and `low` of the candle are the max and min of the IER, longest length MA of the IER, and shortest length MA of the IER respectively.
Colors for this display can be customized via the "Candles" portion of the "Visuals" section in the script settings.
• Circles : Displays three MAs of the IER as circles .
The color of each plot depends on the percent rank of the respective MA over the previous 100 bars.
Different colors are triggered when ranks are below 10%, between 10% and 50%, between 50% and 90%, and above 90%.
Colors for this display can be customized via the "Circles" portion of the "Visuals" section in the script settings.
With either display type, an optional information box can be displayed. This box shows the LTF that the script is using, the average number of lower timeframe bars per chart bar, and the number of chart bars that contain LTF data.
Specifying intrabar precision
Ten options are included in the script to control the number of intrabars used per chart bar for calculations. The greater the number of intrabars per chart bar, the fewer chart bars can be analyzed.
The first five options allow users to specify the approximate amount of chart bars to be covered:
• Least Precise (Most chart bars) : Covers all chart bars by dividing the current timeframe by four.
This ensures the highest level of intrabar precision while achieving complete coverage for the dataset.
• Less Precise (Some chart bars) & More Precise (Less chart bars) : These options calculate a stepped LTF in relation to the current chart's timeframe.
• Very precise (2min intrabars) : Uses the second highest quantity of intrabars possible with the 2min LTF.
• Most precise (1min intrabars) : Uses the maximum quantity of intrabars possible with the 1min LTF.
The stepped lower timeframe for "Less Precise" and "More Precise" options is calculated from the current chart's timeframe as follows:
Chart Timeframe Lower Timeframe
Less Precise More Precise
< 1hr 1min 1min
< 1D 15min 1min
< 1W 2hr 30min
> 1W 1D 60min
The last five options allow users to specify an approximate fixed number of intrabars to analyze per chart bar. The available choices are 12, 24, 50, 100, and 250. The script will calculate the LTF which most closely approximates the specified number of intrabars per chart bar. Keep in mind that due to factors such as the length of a ticker's sessions and rounding of the LTF, it is not always possible to produce the exact number specified. However, the script will do its best to get as close to the value as possible.
Specifying MA type
Seven MA types are included in the script for different averaging effects:
• Simple
• Exponential
• Wilder (RMA)
• Weighted
• Volume-Weighted
• Arnaud Legoux with `offset` and `sigma` set to 0.85 and 6 respectively.
• Hull
Weighting
This script includes the option to weight IER values based on the percent rank of absolute price changes on the current chart's timeframe over a specified period, which can be enabled by checking the "Weigh using relative close changes" option in the script settings. This places reduced emphasis on IER values from smaller changes, which may help to reduce noise in the output.
█ FOR Pine Script™ CODERS
• This script imports the recently published lower_ltf library for calculating intrabar statistics and the optimal lower timeframe in relation to the current chart's timeframe.
• This script uses the recently released request.security_lower_tf() Pine Script™ function discussed in this blog post .
It works differently from the usual request.security() in that it can only be used on LTFs, and it returns an array containing one value per intrabar.
This makes it much easier for programmers to access intrabar information.
• This script implements a new recommended best practice for tables which works faster and reduces memory consumption.
Using this new method, tables are declared only once with var , as usual. Then, on the first bar only, we use table.cell() to populate the table.
Finally, table.set_*() functions are used to update attributes of table cells on the last bar of the dataset.
This greatly reduces the resources required to render tables.
Look first. Then leap.

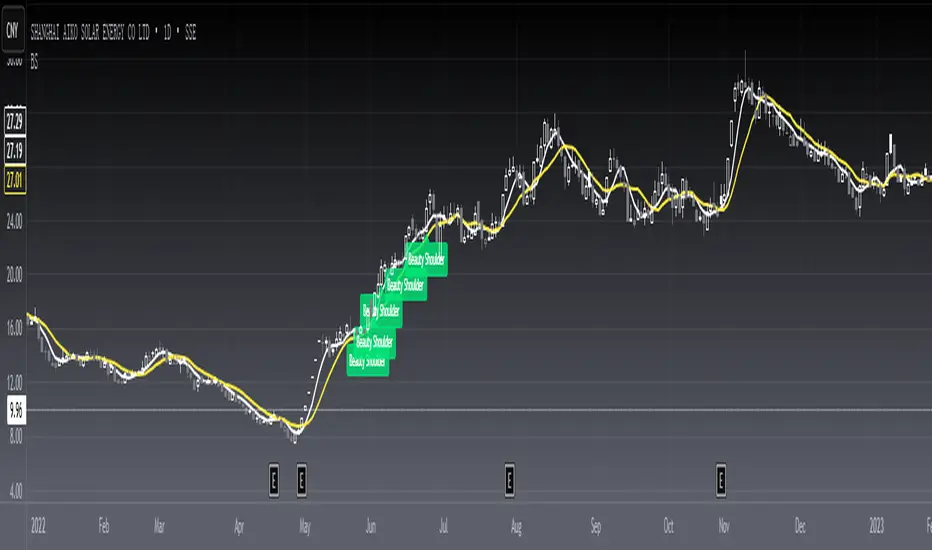
[blackcat] L1 Beauty ShoulderLevel 1
Background
A classic candle pattern : beauty shoulder.
Function
Beauty shoulder, as the name suggests, is that the trend of the candle chart is like a beauty shoulder. The most important feature of the beauty shoulder pattern is that after it reaches the shoulder, it does not wash the market through the downward trend of the stock price, but only by slowing down the rising speed to achieve washing out float chips.Therefore, the shape of the beauty shoulder is not rising from beginning to end, but the acceleration of the rise has changed.
Morphological characteristics:
1. Beauty shoulder is a candlestick pattern. It is usually the trace left by the main force opening up positions. This pattern is encountered by dozens every year, and you will always find it if you look for it carefully.
2. The technical characteristics of the beauty shoulder, the 5-day moving average and the 10-day moving average must continue to form a golden fork.
3. The trend in the first half of the candle chart must present an arch, and only in this way can it be called a beauty shoulder.
4. The candle chart must be above the 60-day moving average. It is best to hang it in the air, or a stronger shoulder of the beauty. The candle chart is above the 30-day moving average, so the magnitude of the pull up will become larger.
5. The bottom of the shoulder of the beauty is the part of the consolidation, and the volume must be increased, because the shoulder of the beauty is the result of the main force building a strong position in a short time, so the volume must be increased.
6. The rise of the shoulders of the beauty is very scary, and the increase is usually more than 30%.
Remarks
Feedbacks are appreciated.
Yield Curve (1-10yr)Yield curve of the 1-10 year US Treasury Bonds, with over 60 years of history.
The Yield Curve is the interest rate on the 10 year bond minus the 1 year bond.
When it inverts (crosses under 0) a recession usually follows 6-12 months later.
It's a great leading indicator to identify risk in the macroeconomic environment.
Yield curves can be constructed on varying durations. Using a 1-year as the short-term bond provides a slightly faster response than the 2-year bond; and the 1-year has more historical data on TradingView.

Multi Timeframe Moving AveragesThis script lets you have multiple Smoothed Moving Averages
for any timeframe of your choosing that are configurable to
your liking all in one indicator. Very useful if you want to always
show a specific MA like the 200d SMA on smaller timeframes,
for example.
Defaults to 30 d, 60 day, 90 day

Power Of Stocks - Bollinger Band & 5Ema Indicator - Keanu_RiTz
Power of Stocks - Bollinger band & 5ema Strategy
In this script you get to take Buy/Sell trades using the 3 options mentioned below.(Alerts with price levels for buy/sell at , SL & Target are included in this one)
1. Combined Strategy :- uses confirmation from both strategies to trade.
2. Bollinger band Strategy :- use the Bollinger band Strategy to trade.
3. 5ema Strategy :- use the 5ema Strategy to trade.
1. Combined Strategy :-
for Selling :- we will go short/sell only when conditions of both strategies are satisfied.
i.e. when a candle is completely above the upper Bollinger band & completely above the 5ema then it will be our Alert Candle.
We Short/Sell only when the low of the Alert candle is broken or when the candle closes below the close of the Alert Candle.
SL will be above high of the Alert Candle. Target will be minimum 1:3 or as per your emotions.
for Buying:- we will go Long/Buy only when conditions of both strategies are satisfied.
i.e. when a candle is completely below the lower Bollinger band & completely below the 5ema then it will be our Alert Candle.
We go Long/Buy only when the high of the Alert candle is broken or when the candle closes above the close of the Alert Candle.
SL will be below low of the Alert Candle. Target will be minimum 1:3 or as per your emotions.
2. Power of Stocks - Bollinger Band Strategy :-
Bollinger band with standard deviation = 1.5
when a candle is completely above the upper Bollinger band, that candle will be called a signal/alert candle.
Initiate a Sell trade when that alert candles low is broken. SL will be above high of that alert candle.
Risk to reward ratio will be 1:4 i.e. target will be 4 times the SL.
when a candle is completely below the lower Bollinger band, that candle will be called a signal/alert candle.
Initiate a Buy trade when that alert candles high is broken. SL will be below low of that alert candle.
Risk to reward ratio will be 1:4 i.e. target will be 4 times the SL.
other rules for Options buying:- minimum 15min timeframe
The day you initiate the position , you should be in profit above 10%-15% then only you should carry forward that position overnight, otherwise squareoff your trade on that day only.
Buy ATM or slightly OTM, SL max 100 points , target 1:4
for Long-term/Investing :- Minimum Weekly
If candle is outside the lower band then initiate a Buy trade when that candles High is broken. Sl will be below Low of that candle.
for Long-term Target will be according to your emotions.
3. Power of Stocks - 5ema Strategy (target minimum 1:3)
Timeframe -
5 min for Selling (Sell Futures/index/stocks or buy Put)
15 min for Buying (Buy Futures/index/stocks or sell Put)
for selling stocks :-
you should enter trade within 10am , don't look for entries after that time. take only 2 entries a day.
for selling Index(Banknifty) :-
you can take trade at anytime of the day whenever conditions get satisfied. you can take multiple entries in banknifty as it is very volatile.
for options choose atm strikes: selling trade
sl for premium between 200-300 :- 20-30 points SL
sl for premium between 400-500 :- 40-50 points SL
sl for premium between 500-600 :- 50-60 points SL
Subhashish Pani's (power of stocks) 5 EMA Strategy:-
It plots 5 EMA and Buy/Sell signals with Target & Stoploss levels.
What is Subhashish Pani's (power of stocks) 5 EMA Strategy :-
His strategy is very simple to understand. for intraday use 5 minutes timeframe for selling. You can sell futures, sell call or buy Puts in selling strategy.
What this strategy tries to do is , it tries to catch the tops, so when you sell at top & it turns out to be a reversal point then you can get good profit.
this will hit stop losses often, but stop losses are small and minimum target should be 1:3. but if you stay with the trend you can get big profits.
According to Subhashish Pani this strategy has 60% success rate.
Strategy for Selling (Short future/Call/stock or buy Put)
When ever a Candle closes completely above 5 ema (no part of candle should be touching the 5ema), then that candle should be considered as Alert Candle.
If the next candle is also completely above 5 ema and it has not broken the low of previous alert candle, Then the previous Alert Candle should be ignored and the new candle should be considered as new Alert Candle.
so if this goes on then continue shifting the Alert Candle, but whenever the next candle breaks the low of the Alert Candle we should take the Short trade (Short future/Call/stock or buy Put).
Stoploss will be above high of the Alert Candle and minimum target will be 1:3.
Strategy for Buying (Buy future/Call/stock or sell Put)
When ever a Candle closes completely below 5 ema (no part of candle should be touching the 5ema), then that candle should be considered as Alert Candle.
If the next candle is also completely below 5 ema and it has not broken the high of previous alert candle, Then the previous Alert Candle should be ignored and the new candle should be considered as new Alert Candle.
so if this goes on then continue shifting the Alert Candle, but whenever the next candle breaks the high of the Alert Candle we should take the Long trade (Buy future/Call/stock or sell Put).
Stoploss will be below low of the Alert Candle and minimum target will be 1:3.
Buy/Sell with extra conditions :
it just adds 1 more condition to buying/selling
1. checks if closing of current candle is lower than alert candles closing for Selling & checks if closing of current candle is higher than alert candles closing for Buyling.
This can sometimes save you from false moves but by using this, you can also miss out on big moves as you'll enter trade after candle closing instead of entering at break of high/low.
Note :- According to Subhashish Pani Timeframe for intraday buying should be 15 minutes Timeframe.
If you haven't understood the strategy by reading above description, then search for "Subhashish Pani's (power of stocks) 5 EMA Strategy" on YouTube to get a deeper understanding.
Note:- This is not only for Intraday trading , you can use this strategy for Positional/Swing trading as well. If you use this on Monthly Timeframe then it can be very good for Long Term Investing as well.
Rules will be same for all types of trades & Timeframes.

TASC 2022.11 Phasor Analysis█ OVERVIEW
TASC's November 2022 edition Traders' Tips includes an article by John Ehlers titled "Recurring Phase Of Cycle Analysis". This is the code that implements the phasor analysis indicator presented in this publication.
█ CONCEPTS
The article explores the use of phasor analysis to identify market trends.
An ordinary rotating phasor diagram is a two-dimensional vector, anchored to the origin, whose rotation rate corresponds to the cycle period in the price data stream. Similarly, Ehlers' phasor is a representation of angular phase rotation along the course of time. Its angle reflects the current phase of the cycle. Angles -180, -90, +90 and +180 degrees correspond to the beginning, valley, peak and end of the cycle, respectively.
If the observed cycle is very long, the market can be considered trending . In his article, John Ehlers defined trending behavior to occur when the derived instantaneous cycle period value is greater that 60 bars. The author also introduced guidelines for long and short entries in a trending state. Depending on the tuning of the indicator period input, a long entry position may occur when the phasor angle is around the approximate vicinity of −90 degrees, while a short entry position may occur when the phasor angle will be around the approximate vicinity of +90 degrees. Applying these definitive guidelines, the author proposed a state variable that is indicated by +1 for a trending long position, 0 for cycling, and −1 for a trending short position (or out).
The phasor angle, the cycle period, and the state variable are made available with three selectable display modes provided for this TradingView indicator.
█ CALCULATIONS
The calculations are carried out as follows.
First, the price data stream is correlated with cosine and sine of a fixed cycle period. This produces two new data streams that correspond to the projections of the frequency domain phasor diagram to the horizontal (so-called real ) and vertical (so-called imaginary ) axis respectively. The wavelength of the cycle period input should be set for the midrange vicinities of the phasor to coincide with the peaks and valleys of the charted price data.
Secondly, the phase angle of the phasor is easily computed as the arctangent of the ratio of the imaginary component to the real component. The difference between the current phasor values and its last is then employed to calculate a derived instantaneous period and market state. This computation is then repeated successively for each individual bar over the entire duration of the data set.
