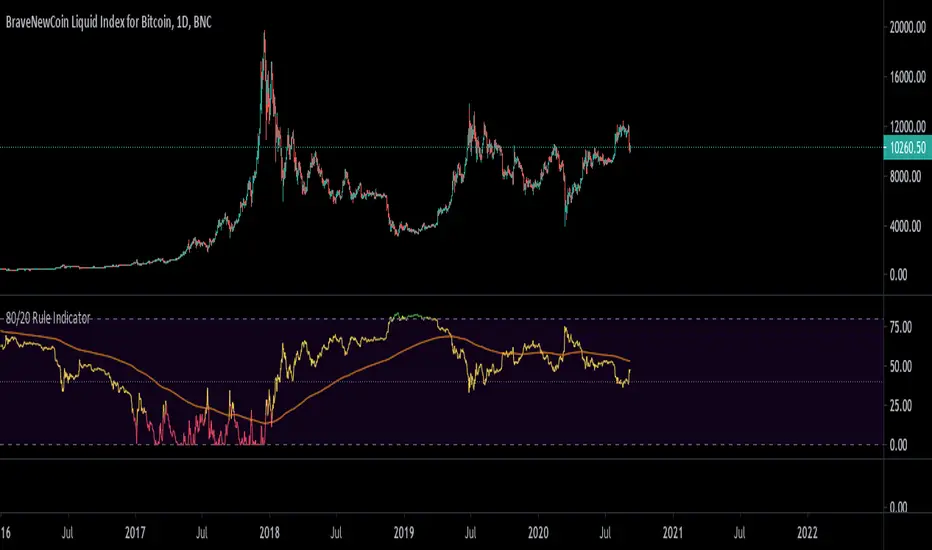
80/20 Rule IndicatorIf you have not heard of the 80/20 rule then you are probably living under a rock =).
I took this idea and applied it to total loss percentage from the last known high. As it turns out, after about 80 percent losses on an asset it almost 'always' recovers. Perhaps the theory on this being that 20 percent will just hold on for dear life and never sell =).
For assets that are more established they tend to hit the midline around 40% as good buy zones, like APPL for example, but even APPL (Apple Inc.) in it's infant years hit 80 percent at times and they were always good buy zones. You can see something similar with BTC (Bitcoin) as well.
With the possibility of an upcoming crash in the years ahead you can use this indicator for the asset you are exploring to know with confidence you are buying at a good price zone.
This indicator is obviously meant for long term trading (daily chart or higher). You can use this to look for patterns for how long all-time high's last as well as an idea of when to sell out as well. This gives you a really good overall picture of the asset and it's current position in the price action and where it might be headed.
"股价在8元左右净利润为正市值小于80亿的热门股票有哪些" için komut dosyalarını ara
80-20 Intraday Trading System System based on daily chart when have 80-20 candles @ supply or demand areas
During next session using intraday charts (60or15min) setup occurs

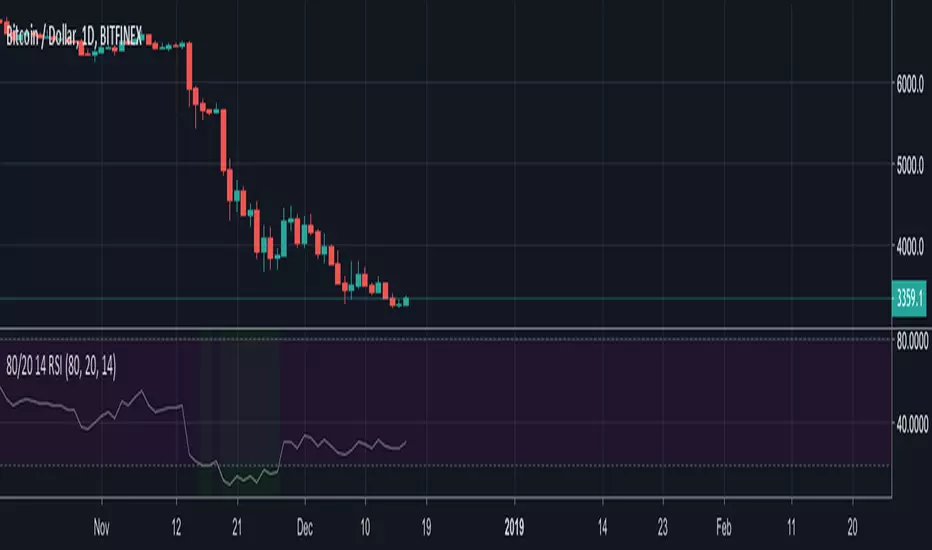
80/20 14 RSIThe default RSI (14) set up with Pareto (80/20 for overbought and oversold).
The background color is turning green and red as buy & sell signals
RSI 20/80 Arrows + AlertsRSI 20/80 Arrows + Alerts
This indicator is a modified Relative Strength Index (RSI) tool designed to help traders spot potential overbought and oversold conditions using customizable threshold levels (default 80 for overbought, 20 for oversold).
Features:
Custom RSI Levels – Default to 80/20 instead of the standard 70/30, but fully adjustable by the user.
Visual Signals –
Blue Arrow Up appears below the bar when RSI crosses up from below the oversold level (potential buy zone).
Red Arrow Down appears above the bar when RSI crosses down from above the overbought level (potential sell zone).
Alerts Built In – Receive notifications when either signal occurs, with the option to confirm signals only on bar close for reduced noise.
Guide Levels – Optionally display overbought/oversold reference lines on the chart for quick visual reference.
Overlay Mode – Signals are plotted directly on the price chart, so you don’t need to switch between chart windows.
Use Case:
Ideal for traders who want quick, visual confirmation of potential turning points based on RSI, especially in strategies where more extreme levels (like 20/80) help filter out weaker signals. Works well across all markets and timeframes.

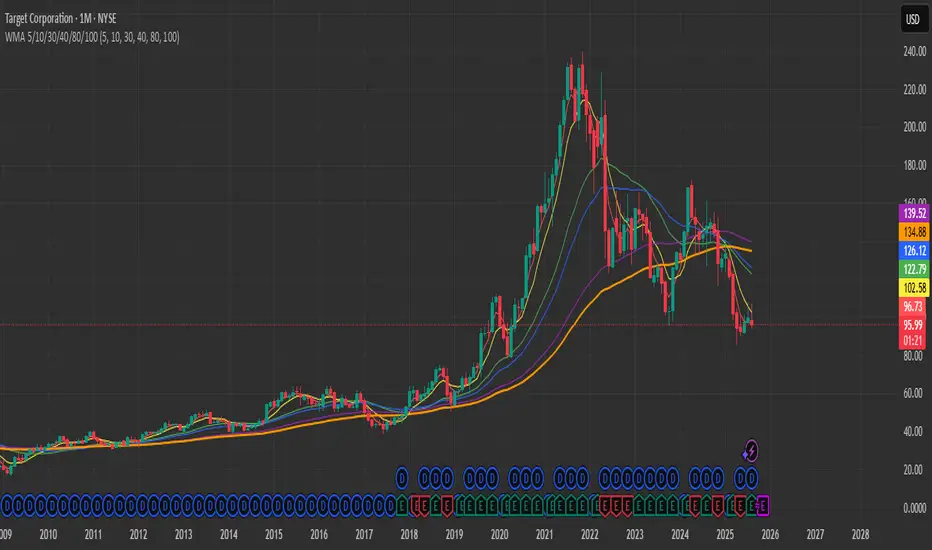
WMA 5/10/30/40/80/1006 WMAs on the chart: 5, 10, 30, 40, 80, and 100 — each in its own color.
This indicator plots multiple Weighted Moving Averages (WMA) on the price chart: 5, 10, 30, 40, 80, and 100.
Shorter WMAs (5 & 10) react quickly to price changes and are useful for short-term trend detection.
Longer WMAs (30, 40, 80, 100) help identify medium- to long-term trends and dynamic support/resistance zones.
Traders often watch for crossovers between short-term and long-term WMAs as potential trade signals.
指定周期 EMA (20, 40, 60, 80)This indicator allows you to display EMA (20, 40, 60, 80) from a higher timeframe directly on your current chart.
It helps you identify trend direction, confluence zones, and dynamic support/resistance based on multi-timeframe EMAs.
Features:
Choose any higher timeframe (e.g. 60 = 1H, 240 = 4H, D = 1D)
Plots 4 EMAs: 20, 40, 60, and 80
Works seamlessly across all timeframes
Ideal for trend confirmation and multi-timeframe analysis
💡 Tip:
Try viewing the 1H EMAs on a 15min chart or 4H EMAs on a 1H chart — this helps identify where price interacts with higher timeframe structure.

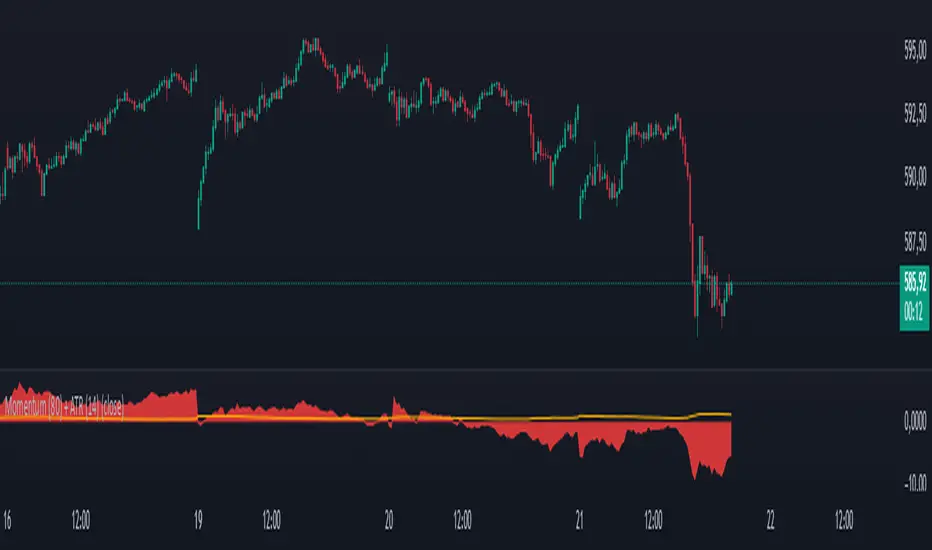
Momentum (80) + ATR (14)his indicator combines two essential technical analysis tools in a single panel for enhanced market insight:
🔹 Momentum (80 periods): Measures the difference between the current price and the price 80 bars ago. Displayed as a semi-transparent filled area, it helps to visually identify shifts in price momentum over a longer timeframe.
🔸 ATR (Average True Range, 14 periods): Shown as a fine orange line, the ATR represents average market volatility over 14 periods, highlighting phases of calm or increased price fluctuations.
By viewing both momentum and volatility simultaneously, traders can better assess trend strength and market conditions, improving decision-making across assets such as stocks, forex, and cryptocurrencies.
✅ Suitable for all asset types
✅ Complements other indicators like RSI, MACD, and Bollinger Bands
✅ Categorized under Momentum & Volatility indicators
41-80 F&O MA ScreenerThis Pine Script is a TradingView indicator named "41-80-F&O EMA Screener." It calculates and displays four moving averages (MA1, MA2, MA3, and MA4) and the Relative Strength Index (RSI) on a chart. The script generates buy and short signals based on certain conditions involving the moving averages and RSI. Additionally, it includes a screener section that displays a table of symbols with buy and short signals.
Here's a breakdown of the key components:
Moving Averages (MAs):
MA1: Simple Moving Average with length len1 (green line).
MA2: Simple Moving Average with length len2 (red line).
MA3: Simple Moving Average with length len3 (orange line).
MA4: Simple Moving Average with length len4 (black line).
Relative Strength Index (RSI):
The RSI is calculated with a length of rsiLengthInput and a source specified by rsiSourceInput.
Conditions for Buy and Short Signals:
Buy Signal: When MA1 is above MA2 and MA3, and RSI is above 50.
Short Signal: When MA1 is below MA2 and MA3, and RSI is below 50.
Signal Plots:
Buy signals are plotted as "B" below the corresponding bars.
Short signals are plotted as "S" above the corresponding bars.
Background Coloring:
Bars are colored based on their opening and closing prices.
Screener Section:
The script defines a watchlist (gticker) with 40 predefined symbols.
It then calls the getSignal function for each symbol to identify buy and short signals.
The results are displayed in a table with long signals in green and short signals in red.
Table Theming:
The script allows customization of the table's background, frame, and text colors, as well as the text size.
The table's location on the chart can also be customized.
Please note that the script uses the Mozilla Public License 2.0. Make sure to review and comply with the terms of this license if you plan to use or modify the script.
Rounded Forex Levels: Big-Figure, Mid-Figure, 80-20 levels, BFRNSimple indicator to show Rounded levels in typical Forex pairs: Big figure, Mid-figure, 80-20 Insitutional Levels, 10pip levels, 5pip levels
Wrote this indicator because other ones out there seem to clutter the chart. This is simple, low-clutter and can be set by user to have arbitrary start and end points for the lines.
I wanted the ability for lines to plot discreetly to the right hand side of price as in the chart above, since in my opinion, these are only of secondary consideration to a trader, an extra confirmation/confluence to an existing idea.
//Purpose & Usage:
-Big-figure levels (100pips) & Mid-figure levels (50pips) will have a senstitivity to price, that can be an additional tool when looking for confluence for a target or an entry.
-As well as BF levels and MF levels; Institutional levels (20pips below and 20 pips above a Big Figure level) and standard 10pip or 5pip levels, can be useful in the right context (i.e added confirmation that of a minor sweep target; added conviction in an idea if the level aligns with another seperately derived level).
//User inputs:
-Toggle on/off each of the types of level.
-Line spacing: choose pip spacing of lines .
-Number of lines above/below (i.e. setting of 5 will be 11 lines. One central, 5 above, 5 below).
-Formatting: for each class of lines, code by color, style and width (as per the example chart below).
-Line start offset and line end offset: bars forward/back for each of start point and end point. So lines could be spread right across chart; or neatly pushed to the far right or left of the chart.
//Notes:
-Designed for typical Forex pairs with units close to 1.0 (like Eur/Usd, Usd/Cad, Aud/Usd, Gbp/Usd, Eur/Gbp, Nzd/Usd).
-Lines are based from the rounded close of the previous bar, Updating (if applicable) on each new bar.
Demo Plotting levels in the past; Dialog box example display:


EMA Cross 9,21,50,80,200 + Inside barEste script faz o seguinte:
1. Plota 5 EMAs (9,21,50,80,200)
2. Faz crossover da 9x21 e 21x50
3. Colore inside bar em amarelo (é possível ainda colorir diferentemente bullish e bearish inside bar)

Multi Timeframe RSI 80 20 Different with 80 - 20 lines to help catch bottoms on multi time frames. The default was 70 - 30. Changed it to be more artistic the current RSI and 1 day are red the rest are white.


Noro's CryptoBottom Strategy- 80-100% of profitable trades
- low risk
- low profit
- for crypto/fiat
- for W1, D1, H4 timeframe

Combined ATR + VolumeOverview
The Combined ATR + Volume indicator (C-ATR+Vol) is designed to measure both price volatility and market participation by merging the Average True Range (ATR) and trading volume into a single normalized value. This provides traders with a more comprehensive tool than ATR alone, as it highlights not only how much price is moving, but also whether there is sufficient volume behind those moves.
Originality & Utility
Two Key Components
ATR (Average True Range): Measures price volatility by analyzing the range (high–low) over a specified period. A higher ATR often indicates larger price swings.
Volume: Reflects how actively traders are participating in the market. High volume typically indicates strong buying or selling interest.
Normalized Combination
Both ATR and volume are independently normalized to a 0–100 range.
The final output (C-ATR+Vol) is the average of these two normalized values. This makes it easy to see when both volatility and market participation are relatively high.
Practical Use
Above 80: Signifies elevated volatility and strong volume. Markets may experience significant moves.
Around 50–80: Indicates moderate activity. Price swings and volume are neither extreme nor minimal.
Below 50: Suggests relatively low volatility and lower participation. The market may be ranging or consolidating.
This combined approach can help filter out situations where volatility is high but volume is absent—or vice versa—providing a more reliable context for potential breakouts or trend continuations.
Indicator Logic
ATR Calculation
Uses Pine Script’s built-in ta.tr(true) function to measure true range, then smooths it with a user-selected method (RMA, SMA, EMA, or WMA).
Key Input: ATR Length (default 14).
Volume Calculation
Smooths the built-in volume variable using the same selectable smoothing methods.
Key Input: Volume Length (default 14).
Normalization
For each metric (ATR and Volume), the script finds the lowest and highest values over the lookback period and converts them into a 0–100 scale:
normalized value
=(current value−min)(max−min)×100
normalized value= (max−min)(current value−min) ×100
Combined Score
The final plot is the average of Normalized ATR and Normalized Volume. This single value simplifies the process of identifying high-volatility, high-volume conditions.
How to Use
Setup
Add the indicator to your chart.
Adjust ATR Length, Volume Length, and Smoothing to match your preferred time horizon or chart style.
Interpretation
High Values (above 80): The market is experiencing significant price movement with high participation. Potential for strong trends or breakouts.
Moderate Range (50–80): Conditions are active but not extreme. Trend setups may be forming.
Low Values (below 50): Indicates quieter markets with reduced liquidity. Expect ranging or less decisive moves.
Strategy Integration
Use C-ATR+Vol alongside other trend or momentum indicators (e.g., Moving Averages, RSI, MACD) to confirm potential entries/exits.
Combine it with support/resistance or price action analysis for a broader market view.
Important Notes
This script is open-source and intended as a community contribution.
No Future Guarantee: Past market behavior does not guarantee future results. Always use proper risk management and validate signals with additional tools.
The indicator’s performance may vary depending on timeframes, asset classes, and market conditions.
Adjust inputs as needed to suit different instruments or personal trading styles.
By adhering to TradingView’s publishing rules, this script is provided with sufficient detail on what it does, how it’s unique, and how traders can use it. Feel free to customize the settings and experiment with other technical indicators to develop a trading methodology that fits your objectives.
🔹 Combined ATR + Volume (C-ATR+Vol) 지표 설명
이 인디케이터는 ATR(Average True Range)와 거래량(Volume)을 결합하여 시장의 변동성과 유동성을 동시에 측정하는 지표입니다.
ATR은 가격 변동성의 크기를 나타내며, 거래량은 시장 참여자의 활동 수준을 반영합니다. 보통 높은 ATR은 가격 변동이 크다는 의미이고, 높은 거래량은 시장에서 적극적인 거래가 이루어지고 있음을 나타냅니다.
이 두 지표를 각각 0~100 범위로 정규화한 후, 평균을 구하여 "Combined ATR + Volume (C-ATR+Vol)" 값을 계산합니다.
이를 통해 단순한 가격 변동성뿐만 아니라 거래량까지 고려하여, 더욱 신뢰성 있는 변동성 판단을 할 수 있도록 도와줍니다.
📌 핵심 개념
1️⃣ ATR (Average True Range)란?
시장의 변동성을 측정하는 지표로, 일정 기간 동안의 고점-저점 변동폭을 기반으로 계산됩니다.
ATR이 높을수록 가격 변동이 크며, 낮을수록 횡보장이 지속될 가능성이 큽니다.
하지만 ATR은 방향성을 제공하지 않으며, 단순히 변동성의 크기만을 나타냅니다.
2️⃣ 거래량 (Volume)의 역할
거래량은 시장 참여자의 관심과 유동성을 반영하는 중요한 요소입니다.
높은 거래량은 강한 매수 또는 매도세가 존재함을 의미하며, 낮은 거래량은 시장 참여가 적거나 관심이 줄어들었음을 나타냅니다.
3️⃣ ATR + 거래량의 결합 (C-ATR+Vol)
단순한 ATR 값만으로는 변동성이 커도 거래량이 부족할 수 있으며, 반대로 거래량이 많아도 변동성이 낮을 수 있습니다.
이를 해결하기 위해 ATR과 거래량을 각각 0~100으로 정규화하여 균형 잡힌 변동성 지표를 만들었습니다.
두 지표의 평균값을 계산하여, 가격 변동과 거래량이 동시에 높은지를 측정할 수 있도록 설계되었습니다.
📊 사용법 및 해석
80 이상 → 강한 변동성 구간
가격 변동성이 크고 거래량도 높은 상태
강한 추세가 진행 중이거나 큰 변동이 일어날 가능성이 큼
상승/하락 방향성을 확인한 후 트렌드를 따라가는 전략이 유리
50~80 구간 → 보통 수준의 변동성
가격 움직임이 일정하며, 거래량도 적절한 수준
점진적인 추세 형성이 이루어질 가능성이 있음
시장이 점진적으로 상승 혹은 하락할 가능성이 크므로, 보조지표를 활용하여 매매 타이밍을 결정하는 것이 중요
50 이하 → 낮은 변동성 및 유동성 부족
가격 변동이 적고, 거래량도 낮은 상태
시장이 횡보하거나 조정 기간에 들어갈 가능성이 큼
박스권 매매(지지/저항 활용) 또는 돌파 전략을 고려할 수 있음
💡 활용 방법 및 전략
✅ 1. 트렌드 판단 보조지표로 활용
단독으로 사용하는 것보다는 RSI, MACD, 이동평균선(MA) 등의 지표와 함께 활용하는 것이 효과적입니다.
예를 들어, MACD가 상승 신호를 주고, C-ATR+Vol 값이 80을 초과하면 강한 상승 추세로 해석할 수 있습니다.
✅ 2. 변동성 돌파 전략에 활용
C-ATR+Vol이 80 이상인 구간에서 가격이 특정 저항선을 돌파한다면, 강한 추세의 시작을 의미할 수 있습니다.
반대로, C-ATR+Vol이 50 이하에서 가격이 저항선에 가까워지면 돌파 가능성이 낮아질 수 있습니다.
✅ 3. 시장 참여도와 변동성 확인
단순히 ATR만 높아서는 신뢰하기 어려운 경우가 많습니다. 예를 들어, 급등 후 거래량이 급감하면 상승 지속 가능성이 낮아질 수도 있습니다.
하지만 C-ATR+Vol을 사용하면 거래량이 함께 증가하는지를 확인하여 보다 신뢰할 수 있는 분석이 가능합니다.
🚀 결론
🔹 Combined ATR + Volume (C-ATR+Vol) 인디케이터는 단순한 ATR이 아니라 거래량까지 고려하여 변동성을 측정하는 강력한 도구입니다.
🔹 시장이 큰 움직임을 보일 가능성이 높은 구간을 찾는 데 유용하며, 80 이상일 경우 강한 변동성이 있음을 나타냅니다.
🔹 단독으로 사용하기보다는 보조지표와 함께 활용하여, 트렌드 분석 및 돌파 전략 등에 효과적으로 적용할 수 있습니다.
📌 주의사항
변동성이 크다고 해서 반드시 가격이 급등/급락한다는 보장은 없습니다.
특정한 매매 전략 없이 단순히 이 지표만 보고 매수/매도를 결정하는 것은 위험할 수 있습니다.
시장 상황에 따라 변동성의 의미가 다르게 작용할 수 있으므로, 반드시 다른 보조지표와 함께 활용하는 것이 중요합니다.
🔥 이 지표를 활용하여 시장의 변동성과 거래량을 보다 효과적으로 분석해보세요! 🚀

Stochastic Enhanced [DCAUT]█ Stochastic Enhanced
📊 ORIGINALITY & INNOVATION
The Stochastic Enhanced indicator builds upon George Lane's classic momentum oscillator (developed in the late 1950s) by providing comprehensive smoothing algorithm flexibility. While traditional implementations limit users to Simple Moving Average (SMA) smoothing, this enhanced version offers 21 advanced smoothing algorithms, allowing traders to optimize the indicator's characteristics for different market conditions and trading styles.
Key Improvements:
Extended from single SMA smoothing to 21 professional-grade algorithms including adaptive filters (KAMA, FRAMA), zero-lag methods (ZLEMA, T3), and advanced digital filters (Kalman, Laguerre)
Maintains backward compatibility with traditional Stochastic calculations through SMA default setting
Unified smoothing algorithm applies to both %K and %D lines for consistent signal processing characteristics
Enhanced visual feedback with clear color distinction and background fill highlighting for intuitive signal recognition
Comprehensive alert system covering crossovers and zone entries for systematic trade management
Differentiation from Traditional Stochastic:
Traditional Stochastic indicators use fixed SMA smoothing, which introduces consistent lag regardless of market volatility. This enhanced version addresses the limitation by offering adaptive algorithms that adjust to market conditions (KAMA, FRAMA), reduce lag without sacrificing smoothness (ZLEMA, T3, HMA), or provide superior noise filtering (Kalman Filter, Laguerre filters). The flexibility helps traders balance responsiveness and stability according to their specific needs.
📐 MATHEMATICAL FOUNDATION
Core Stochastic Calculation:
The Stochastic Oscillator measures the position of the current close relative to the high-low range over a specified period:
Step 1: Raw %K Calculation
%K_raw = 100 × (Close - Lowest Low) / (Highest High - Lowest Low)
Where:
Close = Current closing price
Lowest Low = Lowest low over the %K Length period
Highest High = Highest high over the %K Length period
Result ranges from 0 (close at period low) to 100 (close at period high)
Step 2: Smoothed %K Calculation
%K = MA(%K_raw, K Smoothing Period, MA Type)
Where:
MA = Selected moving average algorithm (SMA, EMA, etc.)
K Smoothing = 1 for Fast Stochastic, 3+ for Slow Stochastic
Traditional Fast Stochastic uses %K_raw directly without smoothing
Step 3: Signal Line %D Calculation
%D = MA(%K, D Smoothing Period, MA Type)
Where:
%D acts as a signal line and moving average of %K
D Smoothing typically set to 3 periods in traditional implementations
Both %K and %D use the same MA algorithm for consistent behavior
Available Smoothing Algorithms (21 Options):
Standard Moving Averages:
SMA (Simple): Equal-weighted average, traditional default, consistent lag characteristics
EMA (Exponential): Recent price emphasis, faster response to changes, exponential decay weighting
RMA (Rolling/Wilder's): Smoothed average used in RSI, less reactive than EMA
WMA (Weighted): Linear weighting favoring recent data, moderate responsiveness
VWMA (Volume-Weighted): Incorporates volume data, reflects market participation intensity
Advanced Moving Averages:
HMA (Hull): Reduced lag with smoothness, uses weighted moving averages and square root period
ALMA (Arnaud Legoux): Gaussian distribution weighting, minimal lag with good noise reduction
LSMA (Least Squares): Linear regression based, fits trend line to data points
DEMA (Double Exponential): Reduced lag compared to EMA, uses double smoothing technique
TEMA (Triple Exponential): Further lag reduction, triple smoothing with lag compensation
ZLEMA (Zero-Lag Exponential): Lag elimination attempt using error correction, very responsive
TMA (Triangular): Double-smoothed SMA, very smooth but slower response
Adaptive & Intelligent Filters:
T3 (Tilson T3): Six-pass exponential smoothing with volume factor adjustment, excellent smoothness
FRAMA (Fractal Adaptive): Adapts to market fractal dimension, faster in trends, slower in ranges
KAMA (Kaufman Adaptive): Efficiency ratio based adaptation, responds to volatility changes
McGinley Dynamic: Self-adjusting mechanism following price more accurately, reduced whipsaws
Kalman Filter: Optimal estimation algorithm from aerospace engineering, dynamic noise filtering
Advanced Digital Filters:
Ultimate Smoother: Advanced digital filter design, superior noise rejection with minimal lag
Laguerre Filter: Time-domain filter with N-order implementation, adjustable lag characteristics
Laguerre Binomial Filter: 6-pole Laguerre filter, extremely smooth output for long-term analysis
Super Smoother: Butterworth filter implementation, removes high-frequency noise effectively
📊 COMPREHENSIVE SIGNAL ANALYSIS
Absolute Level Interpretation (%K Line):
%K Above 80: Overbought condition, price near period high, potential reversal or pullback zone, caution for new long entries
%K in 70-80 Range: Strong upward momentum, bullish trend confirmation, uptrend likely continuing
%K in 50-70 Range: Moderate bullish momentum, neutral to positive outlook, consolidation or mild uptrend
%K in 30-50 Range: Moderate bearish momentum, neutral to negative outlook, consolidation or mild downtrend
%K in 20-30 Range: Strong downward momentum, bearish trend confirmation, downtrend likely continuing
%K Below 20: Oversold condition, price near period low, potential bounce or reversal zone, caution for new short entries
Crossover Signal Analysis:
%K Crosses Above %D (Bullish Cross): Momentum shifting bullish, faster line overtakes slower signal, consider long entry especially in oversold zone, strongest when occurring below 20 level
%K Crosses Below %D (Bearish Cross): Momentum shifting bearish, faster line falls below slower signal, consider short entry especially in overbought zone, strongest when occurring above 80 level
Crossover in Midrange (40-60): Less reliable signals, often in choppy sideways markets, require additional confirmation from trend or volume analysis
Multiple Failed Crosses: Indicates ranging market or choppy conditions, reduce position sizes or avoid trading until clear directional move
Advanced Divergence Patterns (%K Line vs Price):
Bullish Divergence: Price makes lower low while %K makes higher low, indicates weakening bearish momentum, potential trend reversal upward, more reliable when %K in oversold zone
Bearish Divergence: Price makes higher high while %K makes lower high, indicates weakening bullish momentum, potential trend reversal downward, more reliable when %K in overbought zone
Hidden Bullish Divergence: Price makes higher low while %K makes lower low, indicates trend continuation in uptrend, bullish trend strength confirmation
Hidden Bearish Divergence: Price makes lower high while %K makes higher high, indicates trend continuation in downtrend, bearish trend strength confirmation
Momentum Strength Analysis (%K Line Slope):
Steep %K Slope: Rapid momentum change, strong directional conviction, potential for extended moves but also increased reversal risk
Gradual %K Slope: Steady momentum development, sustainable trends more likely, lower probability of sharp reversals
Flat or Horizontal %K: Momentum stalling, potential reversal or consolidation ahead, wait for directional break before committing
%K Oscillation Within Range: Indicates ranging market, sideways price action, better suited for range-trading strategies than trend following
🎯 STRATEGIC APPLICATIONS
Mean Reversion Strategy (Range-Bound Markets):
Identify ranging market conditions using price action or Bollinger Bands
Wait for Stochastic to reach extreme zones (above 80 for overbought, below 20 for oversold)
Enter counter-trend position when %K crosses %D in extreme zone (sell on bearish cross above 80, buy on bullish cross below 20)
Set profit targets near opposite extreme or midline (50 level)
Use tight stop-loss above recent swing high/low to protect against breakout scenarios
Exit when Stochastic reaches opposite extreme or %K crosses %D in opposite direction
Trend Following with Momentum Confirmation:
Identify primary trend direction using higher timeframe analysis or moving averages
Wait for Stochastic pullback to oversold zone (<20) in uptrend or overbought zone (>80) in downtrend
Enter in trend direction when %K crosses %D confirming momentum shift (bullish cross in uptrend, bearish cross in downtrend)
Use wider stops to accommodate normal trend volatility
Add to position on subsequent pullbacks showing similar Stochastic pattern
Exit when Stochastic shows opposite extreme with failed cross or bearish/bullish divergence
Divergence-Based Reversal Strategy:
Scan for divergence between price and Stochastic at swing highs/lows
Confirm divergence with at least two price pivots showing divergent Stochastic readings
Wait for %K to cross %D in direction of anticipated reversal as entry trigger
Enter position in divergence direction with stop beyond recent swing extreme
Target profit at key support/resistance levels or Fibonacci retracements
Scale out as Stochastic reaches opposite extreme zone
Multi-Timeframe Momentum Alignment:
Analyze Stochastic on higher timeframe (4H or Daily) for primary trend bias
Switch to lower timeframe (1H or 15M) for precise entry timing
Only take trades where lower timeframe Stochastic signal aligns with higher timeframe momentum direction
Higher timeframe Stochastic in bullish zone (>50) = only take long entries on lower timeframe
Higher timeframe Stochastic in bearish zone (<50) = only take short entries on lower timeframe
Exit when lower timeframe shows counter-signal or higher timeframe momentum reverses
Zone Transition Strategy:
Monitor Stochastic for transitions between zones (oversold to neutral, neutral to overbought, etc.)
Enter long when Stochastic crosses above 20 (exiting oversold), signaling momentum shift from bearish to neutral/bullish
Enter short when Stochastic crosses below 80 (exiting overbought), signaling momentum shift from bullish to neutral/bearish
Use zone midpoint (50) as dynamic support/resistance for position management
Trail stops as Stochastic advances through favorable zones
Exit when Stochastic fails to maintain momentum and reverses back into prior zone
📋 DETAILED PARAMETER CONFIGURATION
%K Length (Default: 14):
Lower Values (5-9): Highly sensitive to price changes, generates more frequent signals, increased false signals in choppy markets, suitable for very short-term trading and scalping
Standard Values (10-14): Balanced sensitivity and reliability, traditional default (14) widely used,适合 swing trading and intraday strategies
Higher Values (15-21): Reduced sensitivity, smoother oscillations, fewer but potentially more reliable signals, better for position trading and lower timeframe noise reduction
Very High Values (21+): Slow response, long-term momentum measurement, fewer trading signals, suitable for weekly or monthly analysis
%K Smoothing (Default: 3):
Value 1: Fast Stochastic, uses raw %K calculation without additional smoothing, most responsive to price changes, generates earliest signals with higher noise
Value 3: Slow Stochastic (default), traditional smoothing level, reduces false signals while maintaining good responsiveness, widely accepted standard
Values 5-7: Very slow response, extremely smooth oscillations, significantly reduced whipsaws but delayed entry/exit timing
Recommendation: Default value 3 suits most trading scenarios, active short-term traders may use 1, conservative long-term positions use 5+
%D Smoothing (Default: 3):
Lower Values (1-2): Signal line closely follows %K, frequent crossover signals, useful for active trading but requires strict filtering
Standard Value (3): Traditional setting providing balanced signal line behavior, optimal for most trading applications
Higher Values (4-7): Smoother signal line, fewer crossover signals, reduced whipsaws but slower confirmation, better for trend trading
Very High Values (8+): Signal line becomes slow-moving reference, crossovers rare and highly significant, suitable for long-term position changes only
Smoothing Type Algorithm Selection:
For Trending Markets:
ZLEMA, DEMA, TEMA: Reduced lag for faster trend entry, quick response to momentum shifts, suitable for strong directional moves
HMA, ALMA: Good balance of smoothness and responsiveness, effective for clean trend following without excessive noise
EMA: Classic choice for trending markets, faster than SMA while maintaining reasonable stability
For Ranging/Choppy Markets:
Kalman Filter, Super Smoother: Superior noise filtering, reduces false signals in sideways action, helps identify genuine reversal points
Laguerre Filters: Smooth oscillations with adjustable lag, excellent for mean reversion strategies in ranges
T3, TMA: Very smooth output, filters out market noise effectively, clearer extreme zone identification
For Adaptive Market Conditions:
KAMA: Automatically adjusts to market efficiency, fast in trends and slow in congestion, reduces whipsaws during transitions
FRAMA: Adapts to fractal market structure, responsive during directional moves, conservative during uncertainty
McGinley Dynamic: Self-adjusting smoothing, follows price naturally, minimizes lag in trending markets while filtering noise in ranges
For Conservative Long-Term Analysis:
SMA: Traditional choice, predictable behavior, widely understood characteristics
RMA (Wilder's): Smooth oscillations, reduced sensitivity to outliers, consistent behavior across market conditions
Laguerre Binomial Filter: Extremely smooth output, ideal for weekly/monthly timeframe analysis, eliminates short-term noise completely
Source Selection:
Close (Default): Standard choice using closing prices, most common and widely tested
HLC3 or OHLC4: Incorporates more price information, reduces impact of sudden spikes or gaps, smoother oscillator behavior
HL2: Midpoint of high-low range, emphasizes intrabar volatility, useful for markets with wide intraday ranges
Custom Source: Can use other indicators as input (e.g., Heikin Ashi close, smoothed price), creates derivative momentum indicators
📈 PERFORMANCE ANALYSIS & COMPETITIVE ADVANTAGES
Responsiveness Characteristics:
Traditional SMA-Based Stochastic:
Fixed lag regardless of market conditions, consistent delay of approximately (K Smoothing + D Smoothing) / 2 periods
Equal treatment of trending and ranging markets, no adaptation to volatility changes
Predictable behavior but suboptimal in varying market regimes
Enhanced Version with Adaptive Algorithms:
KAMA and FRAMA reduce lag by up to 40-60% in strong trends compared to SMA while maintaining similar smoothness in ranges
ZLEMA and T3 provide near-zero lag characteristics for early entry signals with acceptable noise levels
Kalman Filter and Super Smoother offer superior noise rejection, reducing false signals in choppy conditions by estimations of 30-50% compared to SMA
Performance improvements vary by algorithm selection and market conditions
Signal Quality Improvements:
Adaptive algorithms help reduce whipsaw trades in ranging markets by adjusting sensitivity dynamically
Advanced filters (Kalman, Laguerre, Super Smoother) provide clearer extreme zone readings for mean reversion strategies
Zero-lag methods (ZLEMA, DEMA, TEMA) generate earlier crossover signals in trending markets for improved entry timing
Smoother algorithms (T3, Laguerre Binomial) reduce false extreme zone touches for more reliable overbought/oversold signals
Comparison with Standard Implementations:
Versus Basic Stochastic: Enhanced version offers 21 smoothing options versus single SMA, allowing optimization for specific market characteristics and trading styles
Versus RSI: Stochastic provides range-bound measurement (0-100) with clear extreme zones, RSI measures momentum speed, Stochastic offers clearer visual overbought/oversold identification
Versus MACD: Stochastic bounded oscillator suitable for mean reversion, MACD unbounded indicator better for trend strength, Stochastic excels in range-bound and oscillating markets
Versus CCI: Stochastic has fixed bounds (0-100) for consistent interpretation, CCI unbounded with variable extremes, Stochastic provides more standardized extreme readings across different instruments
Flexibility Advantages:
Single indicator adaptable to multiple strategies through algorithm selection rather than requiring different indicator variants
Ability to optimize smoothing characteristics for specific instruments (e.g., smoother for crypto volatility, faster for forex trends)
Multi-timeframe analysis with consistent algorithm across timeframes for coherent momentum picture
Backtesting capability with algorithm as optimization parameter for strategy development
Limitations and Considerations:
Increased complexity from multiple algorithm choices may lead to over-optimization if parameters are curve-fitted to historical data
Adaptive algorithms (KAMA, FRAMA) have adjustment periods during market regime changes where signals may be less reliable
Zero-lag algorithms sacrifice some smoothness for responsiveness, potentially increasing noise sensitivity in very choppy conditions
Performance characteristics vary significantly across algorithms, requiring understanding and testing before live implementation
Like all oscillators, Stochastic can remain in extreme zones for extended periods during strong trends, generating premature reversal signals
USAGE NOTES
This indicator is designed for technical analysis and educational purposes to provide traders with enhanced flexibility in momentum analysis. The Stochastic Oscillator has limitations and should not be used as the sole basis for trading decisions.
Important Considerations:
Algorithm performance varies with market conditions - no single smoothing method is optimal for all scenarios
Extreme zone signals (overbought/oversold) indicate potential reversal areas but not guaranteed turning points, especially in strong trends
Crossover signals may generate false entries during sideways choppy markets regardless of smoothing algorithm
Divergence patterns require confirmation from price action or additional indicators before trading
Past indicator characteristics and backtested results do not guarantee future performance
Always combine Stochastic analysis with proper risk management, position sizing, and multi-indicator confirmation
Test selected algorithm on historical data of specific instrument and timeframe before live trading
Market regime changes may require algorithm adjustment for optimal performance
The enhanced smoothing options are intended to provide tools for optimizing the indicator's behavior to match individual trading styles and market characteristics, not to create a perfect predictive tool. Responsible usage includes understanding the mathematical properties of selected algorithms and their appropriate application contexts.

Donchian Squeeze Oscillator# Donchian Squeeze Oscillator (DSO) - User Guide
## Overview
The Donchian Squeeze Oscillator is a technical indicator designed to identify periods of low volatility (squeeze) and high volatility (expansion) in financial markets by measuring the distance between Donchian Channel bands. The indicator normalizes this measurement to a 0-100 scale, making it easy to interpret across different timeframes and instruments.
## How It Works
The DSO calculates the width of Donchian Channels as a percentage of the middle line, smooths this data, and then normalizes it using historical highs and lows over a specified lookback period. The result is inverted so that:
- **High values (80+)** = Narrow channels = Low volatility = Squeeze
- **Low values (20-)** = Wide channels = High volatility = Expansion
## Key Parameters
### Core Settings
- **Donchian Channel Period (20)**: The number of bars used to calculate the highest high and lowest low for the Donchian Channels
- **Smoothing Period (5)**: Applies moving average smoothing to reduce noise in the oscillator
- **Normalization Lookback (200)**: Historical period used to normalize the oscillator between 0-100
### Threshold Levels
- **Over Squeeze (80)**: Values above this level indicate strong squeeze conditions
- **Over Expansion (20)**: Values below this level indicate strong expansion conditions
## Reading the Indicator
### Color Coding
- **Red Line**: Squeeze condition (above 80 threshold) - Markets are consolidating
- **Orange Line**: Neutral/trending condition with upward momentum
- **Green Line**: Expansion condition or downward momentum
### Visual Elements
- **Red Dashed Line (80)**: Squeeze threshold - potential breakout zone
- **Gray Dotted Line (50)**: Middle line - neutral zone
- **Green Dashed Line (20)**: Expansion threshold - high volatility zone
- **Red Background**: Highlights active squeeze periods
## Trading Applications
### 1. Breakout Trading
- **Setup**: Wait for DSO to reach 80+ (squeeze zone)
- **Entry**: Look for breakouts when DSO starts declining from squeeze levels
- **Logic**: Prolonged low volatility often precedes significant price movements
### 2. Volatility Cycle Trading
- **Squeeze Phase**: DSO > 80 - Prepare for potential breakout
- **Breakout Phase**: DSO declining from 80 - Trade the direction of breakout
- **Expansion Phase**: DSO < 20 - Expect trend continuation or reversal
### 3. Trend Confirmation
- **Orange Color**: Suggests bullish momentum during expansion
- **Green Color**: Suggests bearish momentum or consolidation
- Use in conjunction with price action for trend confirmation
## Best Practices
### Timeframe Selection
- **Higher Timeframes (Daily, 4H)**: More reliable signals, fewer false breakouts
- **Lower Timeframes (1H, 15M)**: More frequent signals but higher noise
- **Multi-timeframe Analysis**: Confirm squeeze on higher TF, enter on lower TF
### Parameter Optimization
- **Volatile Markets**: Increase Donchian period (25-30) and smoothing (7-10)
- **Range-bound Markets**: Decrease Donchian period (15-20) for more sensitivity
- **Trending Markets**: Use longer normalization lookback (300-400)
### Signal Confirmation
Always combine DSO signals with:
- **Price Action**: Support/resistance levels, chart patterns
- **Volume**: Confirm breakouts with increasing volume
- **Other Indicators**: RSI, MACD, or momentum oscillators
## Alert System
The indicator includes built-in alerts for:
- **Squeeze Started**: When DSO crosses above the squeeze threshold
- **Expansion Started**: When DSO crosses below the expansion threshold
## Common Pitfalls to Avoid
1. **False Breakouts**: Don't trade every squeeze - wait for confirmation
2. **Parameter Over-optimization**: Stick to default settings initially
3. **Ignoring Market Context**: Consider overall market conditions and news
4. **Single Indicator Reliance**: Always use additional confirmation tools
## Advanced Tips
- Monitor squeeze duration - longer squeezes often lead to bigger moves
- Look for squeeze patterns at key support/resistance levels
- Use DSO divergences with price for potential reversal signals
- Combine with Bollinger Band squeezes for enhanced accuracy
## Conclusion
The Donchian Squeeze Oscillator is a powerful tool for identifying volatility cycles and potential breakout opportunities. Like all technical indicators, it should be used as part of a comprehensive trading strategy rather than as a standalone signal generator. Practice with the indicator on historical data before implementing it in live trading to understand its behavior in different market conditions.

Financial Radar Chart by zdmreRadar chart is often used when you want to display data across several unique dimensions. Although there are exceptions, these dimensions are usually quantitative, and typically range from zero to a maximum value. Each dimension’s range is normalized to one another, so that when we draw our spider chart, the length of a line from zero to a dimension’s maximum value will be the similar for every dimension.
This Charts are useful for seeing which variables are scoring high or low within a dataset, making them ideal for displaying performance.
How is the score formed?
Debt Paying Ability
if Debt_to_Equity < %10 : 100
elif < 20% : 90
elif < 30% : 80
elif < 40% : 70
elif < 50% : 60
elif < 60% : 50
elif < 70% : 40
elif < 80% : 30
elif < 90% : 20
elif < 100% : 10
else: 0
ROIC
if Return_on_Invested_Capital > %50 : 100
elif > 40% : 90
elif > 30% : 80
elif > 20% : 70
elif > 10% : 50
elif > 5% : 20
else: 0
ROE
if Return_on_Equity > %50 : 100
elif > 40% : 90
elif > 30% : 80
elif > 20% : 70
elif > 10% : 50
elif > 5% : 20
else: 0
Operating Ability
if Operating_Margin > %50 : 100
elif > 30% : 90
elif > 20% : 80
elif > 15% : 60
elif > 10% : 40
elif > 0 : 20
else: 0
EV/EBITDA
if Enterprise_Value_to_EBITDA < 3 : 100
elif < 5 : 80
elif < 7 : 70
elif < 8 : 60
elif < 10 : 40
elif < 12 : 20
else: 0
FREE CASH Ability
if Price_to_Free_Cash_Flow < 5 : 100
elif < 7 : 90
elif < 10 : 80
elif < 16 : 60
elif < 18 : 50
elif < 20 : 40
elif < 22 : 30
elif < 30 : 20
elif < 40 : 15
elif < 50 : 10
elif < 60 : 5
else: 0
GROWTH Ability
if Revenue_One_Year_Growth > %20 : 100
elif > 16% : 90
elif > 14% : 80
elif > 12% : 70
elif > 10% : 50
elif > 7% : 40
elif > 4% : 30
elif > 2% : 20
elif > 0 : 10
else: 0

Relative Performance Indicator - TrendSpider StyleRelative Performance Indicator - TrendSpider Style
📈 Overview
This Relative Performance (RP) indicator measures how your stock is performing compared to a benchmark index, displayed as a percentile ranking from 0-100. Based on TrendSpider's methodology, it answers the critical question: "Is this stock a leader or a laggard?"
Unlike simple ratio charts, this indicator uses percentile ranking to normalize relative performance, making it easy to identify when a stock is showing exceptional strength (>80) or concerning weakness (<20) compared to its historical relationship with the benchmark.
✨ Key Features
Three Calculation Modes:
Quarterly: 3-month relative performance for swing trading
Yearly: Weighted 4-quarter performance for position trading
TechRank: Composite of 6 technical indicators for multi-factor analysis
Clean Visual Design:
Green fills above 80 (strong outperformance)
Red fills below 20 (significant underperformance)
Dotted median line at 50 for quick reference
Current value label for instant reading
Flexible Benchmarks:
Compare against major indices (SPY, QQQ, IWM)
Sector ETFs for within-sector analysis
Custom symbols for specialized comparisons
Built-in Alerts:
Strong performance zone entry (>80)
Weak performance zone entry (<20)
Median crossovers (50 level)
📊 How To Use
Buy Signals:
RP crosses above 80: Stock entering leadership status
RP holding above 60: Maintaining relative strength
RP rising while price consolidating: Accumulation phase
Sell/Avoid Signals:
RP drops below 50: Losing relative strength
RP below 20: Significant underperformance
RP falling while price rising: Bearish divergence
Sector Rotation:
Compare multiple assets to find strongest sectors
Rotate into high RP assets (>70)
Exit low RP positions (<30)
🎯 Reading The Values
80-100: Exceptional outperformance - Strong buy/hold
60-80: Moderate outperformance - Hold positions
40-60: Market perform - No edge
20-40: Underperformance - Caution/reduce
0-20: Severe underperformance - Avoid/exit
⚙️ Calculation Method
Calculates percentage performance of both your stock and the benchmark
Finds the performance differential
Ranks this differential against historical values using percentile analysis
Normalizes to 0-100 scale for easy interpretation
This percentile approach adapts to different market conditions and volatility regimes, providing consistent signals whether in trending or choppy markets.
💡 Pro Tips
For Growth Stocks: Use quarterly mode with QQQ as benchmark
For Value Stocks: Use yearly mode with SPY as benchmark
For Small Caps: Compare against IWM, not SPY
For Sector Analysis: Use sector ETFs (XLK, XLF, XLE, etc.)
Combine with Price Action: High RP + price breakout = powerful signal
⚠️ Important Notes
RP is relative, not absolute - stocks can fall with high RP if the market falls harder
Choose appropriate benchmarks for meaningful comparisons
Best used in conjunction with price action and volume analysis
Historical lookback period affects sensitivity (adjustable in settings)
🔧 Customization
Fully customizable visual settings, thresholds, calculation periods, and smoothing options. Adjust the normalization lookback period (default 252 days) to fine-tune sensitivity to your trading timeframe.
📌 Credit
Inspired by TrendSpider's Relative Performance implementation, adapted for TradingView with enhanced customization options and Pine Script v6 optimization.
Tags to include: relativeperformance, relativestrength, percentile, ranking, sectorrotation, benchmark, outperformance, trendspider, marketbreadth, strengthindicator
Category: Momentum Indicators / Trend Analysis
Feel free to modify this description to match your style or add any specific points you want to emphasize!

Stochastic [Paifc0de]Stochastic — clean stochastic oscillator with visual masking, neutral markers, and basic filters
What it does
This indicator plots a standard stochastic oscillator (%K with smoothing and %D) and adds practical quality-of-life features for lower timeframes: optional visual masking when %K hugs overbought/oversold, neutral K–D cross markers, session-gated edge triangles (K crossing 20/80), and simple filters (minimum %K slope, minimum |K–D| gap, optional %D slope agreement, mid-zone mute, and a cooldown between markers). Display values are clamped to 0–100 to keep the panel scale stable. The tool is for research/education and does not generate entries/exits or financial advice.
Default preset: 20 / 10 / 10
K Length = 20
Classic lookback used in many textbooks. On intraday charts it balances responsiveness and stability: short enough to react to momentum shifts, long enough to avoid constant whipsaws. In practice it captures ~the last 20 bars’ position of close within the high–low range.
K Smoothing = 10
A 10-period SMA applied to the raw %K moderates the “saw-tooth” effect that raw stochastic can exhibit in choppy phases. The smoothing reduces over-reaction to micro spikes while preserving the main rhythm of swings; visually, %K becomes a continuous path that is easier to read.
D Length = 10
%D is the moving average of smoothed %K. With 10, %D becomes a clearly slower guide line. The larger separation between %K(10-SMA) and %D(10-SMA of %K) produces cleaner crosses and fewer spurious toggles than micro settings (e.g., 3/3/3). On M5–M15 this pair often yields readable cross cycles without flooding the chart.
How the 20/10/10 trio behaves
In persistent trends, %K will spend more time near 20 or 80; the 10-period smoothing delays flips slightly and emphasizes only meaningful turn attempts.
In ranges, %K oscillates around mid-zone (40–60). With 10/10 smoothing, cross signals cluster less densely; combining with the |K–D| gap filter helps keep only decisive crosses.
If your symbol is unusually volatile or illiquid, reduce K Length (e.g., 14) or reduce K Smoothing (e.g., 7) to keep responsiveness. If crosses feel late, decrease D Length (e.g., 7). If noise is excessive, increase K Smoothing first, then consider raising D Length.
Visuals
OB/OS lines: default 80/20 reference levels and a midline at 50.
Masking near edges: %K can be temporarily hidden when it is pressing an edge, approaching it with low slope, or going nearly flat near the boundary. This keeps the panel readable during “stuck at the edge” phases.
Soft glow (optional): highlights %K’s active path; can be turned off.
Light/Dark palette: quick toggle to match your chart theme.
Scale safety: all plotted values (lines, fills, markers) are clamped to 0–100 to prevent the axis from expanding beyond the stochastic range.
Markers and filters
Neutral K–D cross markers: circles in the mid-zone when %K crosses %D.
Edge triangles: show when %K crosses 20 or 80; can be restricted to a session window (02:00–12:00 ET).
Filters (optional):
Min %K slope: require a minimum absolute slope so very flat crosses are ignored.
Min |K–D| gap: demand separation between lines at the cross moment.
%D slope agreement: keep crosses that align with %D’s direction.
Mid-zone mute: suppress crosses inside a user-defined 40–60 band (defaults).
Cooldown: minimum bars between successive markers.
Parameters (quick guide)
K Length / K Smoothing / D Length: core stochastic settings. Start with 20/10/10; tune K Smoothing first if you see too much jitter.
Overbought / Oversold (80/20): adjust for assets that tend to trend (raise to 85/15) or mean-revert (lower to 75/25).
Slope & gap filters: increase on very noisy symbols; reduce if you miss too many crosses.
Session window (triangles only): use if you want edge markers only during active hours.
Marker size and offset: cosmetic; they do not affect calculations.
Alerts
K–D Cross Up (filtered) and K–D Cross Down (filtered): fire when a cross passes your filters/cooldown.
Edge Up / Edge Down: fire when %K crosses the 20/80 levels.
All alerts confirm on bar close.
Notes & attribution
Original implementation and integration by Paifc0de; no third-party code is copied.
This indicator is for research/education and does not provide entries/exits or financial advice.

Trendlines Boll Ichi S1 by GammaprodI. How to use this indicator :
------------------------------
I.1. Set your teadingview theme to dark theme.
I.2. Gammaprod indicator is valid for forex, stock and but more valid for crypto.
I.3. Use three timeframe for more validation (choose between those, that fit to your trading style) :
- Timeframe 1m, 5m, and 15m for Scalping
- Timeframe 30m, 1h and 4h for Intraday
- Timeframe 4h, 1D and 1W for Swing Trading
I.4 Always use THREE INDICATORS FROM GAMMAPROD, those three indicators is back to back each other, by the way, I only made those three indicators only (for now) :
- Trendlines Boll Ichi S1 by Gammaprod
- MACD Volume S2 by Gammaprod
- Stoch RSI Divs Zone S2 by Gammaprod
============================================================================
II. How to setting :
--------------------
II.1. Trendlines Boll Ichi Crypto by Gammaprod
II.1.A. Support and Resistance
- Well if you familiar with this indicator you can add it, but recommended for Timeframe 30m or more
II.1.B. Trendlines Primary or Trendlines Secondary
- Timeframe 1m you DON'T NEED Trendlines Primary or Trendlines Secondary
- Timeframe 5m you DON'T NEED Trendlines Secondary, but you CAN ADD Trendlines Primary if you fell it helpful (for me, it is helpful to find where the candles start or the end trend or a consolidation or where the candles will surpass a resistance or a support).
- Timeframe 15m you DON'T NEED Trendlines Secondary, DEFENITELY add Trendlines Primary it will help to find where the candles stop or a consolidation or where the candles will surpass a resistance or a support).
- Timeframe 30m or more, DEFENITELY NEED BOTH Trendlines Primary and Secondary Trendlines, it will help to find where the candle stop or consolidation or where the candle will surpass a resistance or support).
II.1.C. Bollinger, Ichimoku Cloud and Lagging Span
- Please DON'T CHANGE IT at all, it's really helpful to know when and where to make an entry decesion or a trend or a consolidation, if you don't understand how to read it, you better to learn it first (on "how to read" section and "How to OPEN position" the section below)
II.2. Stoch RSI Divs Zone Crypto by Gammaprod (DON'T CHANGE IT)
II.3. MACD Volume Crypto by Gammaprod (DON'T CHANGE IT)
============================================================================
III. How to read :
------------------
III.1. Sell or Buy Priority :
III.1.A. Sell Priority
- Color background on macd and stoch rsi is pink or purple sell is the priority, (if you're not sure to buy, just wait until the best moment to sell)
III.1.B. Buy Priority
- Color background on macd and stoch rsi Teal or light green buy is the priority, (if you're not sure to sell, just wait until the best moment to buy)
III.1.C. Indecision / Golden Moment
- Color background on stoch rsi yellow is indecision / golden moment of reversal pattern (wait until it formed background only on Stoch RSI), please be careful at this moment.
III.2. Trend / Consolidation :
III.2.A. BULLISH trend
- When Stoch RSI and MACD have teal or light green background that's means BULLISH trend, better to confirm by the candle is above green cloud and lagging span (red line) is also above the candle.
III.2.B. BEARISH trend
- When Stoch RSI and MACD have the Pink or purple background that's means BEARISH trend, better to confirm by the candle is above purple cloud and lagging span (red line) is also below the candle.
III.2.C. CONSOLIDATION
- When Stoch RSI have the mix background that's means CONSOLIDATION, better to confirm by the candle is in or near to green / purple cloud and lagging span (red line) is also on the candle.
III.3. Special Mark
III.3.A. Ideal Bullish :
- Near line 20 and green / teal background = When Stoch RSI have the char R / H on lime color label, that's means divergence or hidden divergence for buy position, if you not see this label that's means just a standard confirmation for buy
III.3.B. Not an Ideal Bullish :
- Near line 80 and green / teal background = if this happens make sure you know what happen, it could be a false signal or bullish continual pattern
III.3.C. Ideal Bearish :
- Near line 80 and pink / purple background = When Stoch RSI have the char R / H on lime color label, that's means divergence or hidden divergence for buy position, if you not see this label that's means just a standard confirmation for sell position.
III.3.D. Not an Ideal Bearish:
- Near line 20 and pink / purple background = if this happens make sure you know what happen, it could be a false signal or bearish continual pattern
III.3.E. The Beginning of Reversal (from BEARISH to BULLISH) :
- When Stoch RSI line shaping GREEN position is near 20.
- MACD lines still PINK, position lines is UNDER the HISTOGRAM, but the HISTOGRAM start to SHAPE FALL PINK (light pink) and the BACKGROUND still PINK / PURPLE.
- Position CANDLES NEAR BLUE line, NEAR PURPLE CLOUD, and lagging span (red line) STILL ON the area candle. (it used to be confirmed with the golden moment).
III.3.F. The Beginning of Reversal (from BULLISH to BEARISH) :
- When Stoch RSI line shaping PINK position is near 80.
- MACD lines still GREEN, position lines is ABOVE the HISTOGRAM, but the HISTOGRAM start to SHAPE FALL GREEN (light green) and the BACKGROUND still TEAL / GREEN.
- Position CANDLES NEAR WHITE line, NEAR TEAL CLOUD, and lagging span (red line) STILL ON the area candle. (it used to be confirmed with the golden moment).
III.3.G. False Signals, or It could be a Golden Moment (better to see it on TF 15 or bigger):
- Near line 20 or 80 and yellow background = When Stoch RSI have the char R / H on color label, that's means divergence or hidden divergence for buy / sell position, if you not see this label that's means just a standard confirmation for buy / sell depends on where the Stoch RSI line if near 20 that's means buy, near 80 means sell
============================================================================
IV. How to OPEN position:
-------------------------
IV.1. Bullish
IV.1.A. Trendlines Boll Ichi S1 by Gammaprod
- The candles above the green cloud.
- Lagging span (red line) above the candles.
- then open buy near yellow line (the first option) / blue line (the second option) (always confirm the position with two other indicators below).
IV.1.B. MACD Volume S2 by Gammaprod
- Teal or Green background.
- The lines is shaped or shaping green.
- Better if at the green histogram.
IV.1.C. Stoch RSI Divs Zone S3 by Gammaprod
- Teal or Green background.
- The lines is shaping green.
- Better if on the bottom (at a range 20).
IV.2. Bearish
IV.2.A. Trendlines Boll Ichi S1 by Gammaprod
- The candles below the purple cloud.
- Lagging span (red line) below the candles.
- then open buy near yellow line (the first option) / white line (the second option) (always confirm the position with two other indicators below).
IV.2.B. MACD Volume S2 by Gammaprod
- Pink or purple background.
- The lines are shaped or shaping green.
- Better if at the pink histogram.
IV.2.C. Stoch RSI Divs Zone S3 by Gammaprod
- Pink or purple background.
- The lines are shaping pink.
- Better if the line on the top (at a range 80).
IV.3. Consolidation
IV.3.A. Trendlines Boll Ichi S1 by Gammaprod
- The candles on the cloud (green or purple).
- Lagging span (red line) on the candles.
- then open buy near the white or blue line (always confirm the position with two other indicators below).
IV.3.B. MACD Volume S2 by Gammaprod
- Changing the background.
- The line is near the middle line.
- Have small Histogram.
IV.3.C. Stoch RSI Divs Zone S3 by Gammaprod
- Mix background specially on a timeframe 15m or more.
- The line move fast up and down.
- Better if on the bottom or the top of the lines (at a range 20 or 80).
============================================================================
>> The secret ingredient is comparing the timeframe :
The example scalping (Timeframe 1m, 5m and 15m)
- TF 1m is for making an open position.
- TF 5m is for making a judgement of the trend market.
- TF 15m is to confirm that judgement from TF 5m, be careful if it not similar then it used to be a consolidation or the beginning of the reversal.
There's a lot a way to open the position than above information that i gave it to you, but consider there are a limit chars on this column, I hope it will help your trading and make a more profit on it.
