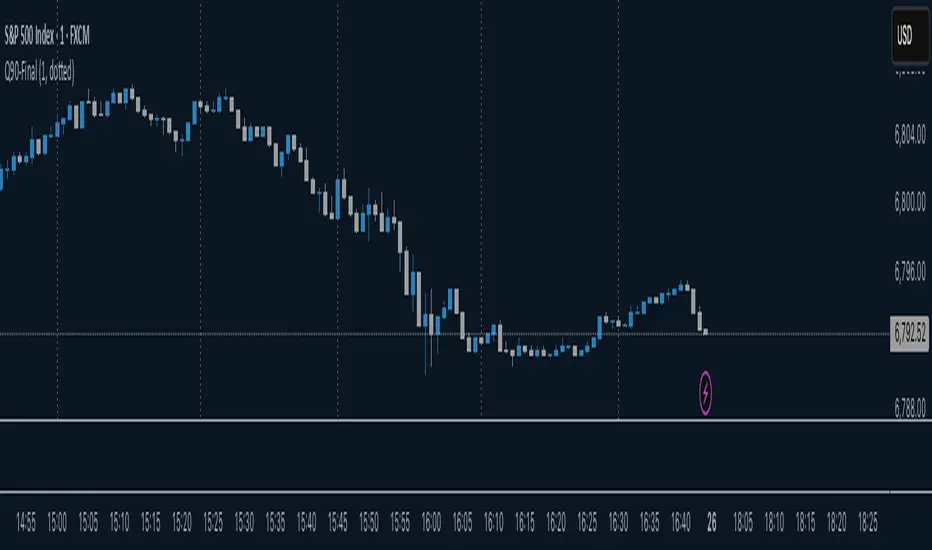
Micro cycle0-Minute Quarter Cycle Indicator (Q90-Final)
This indicator plots vertical lines marking the four quarters (Q1,Q2,Q3,Q4) of a continuous 90-minute cycle.
It is designed for traders who utilize time-based cycles for market analysis and entry/exit timing.
So you can easy identify the cycles off the micro cycles Q1,Q2,Q3 and Q4
"纳斯达克指数期货cfd" için komut dosyalarını ara
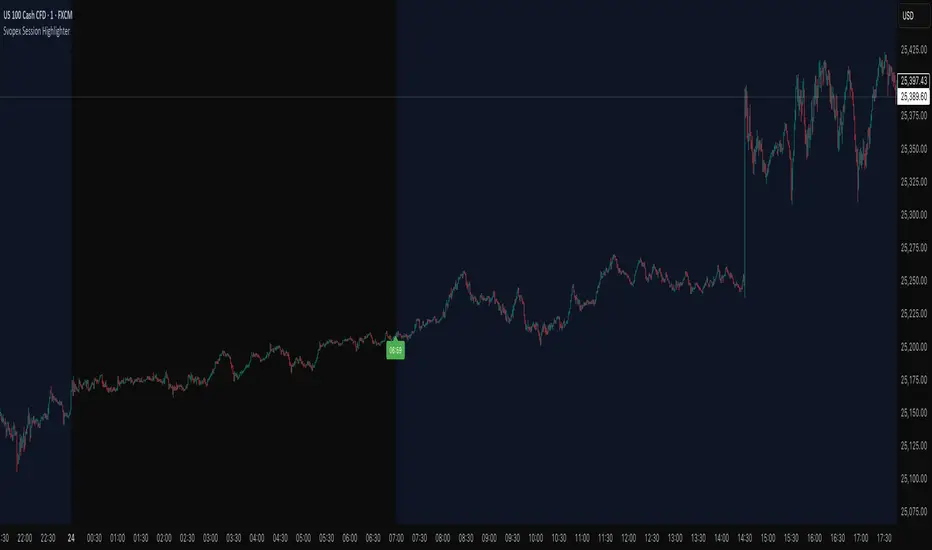
Svopex Session Highlighter# Session Highlighter
## Description
**Session Highlighter** is a powerful Pine Script indicator designed to visually identify and mark specific trading hours on your chart. This tool helps traders focus on their preferred trading sessions by highlighting the background during active hours and marking the session start with customizable visual markers.
## Key Features
- **📊 Session Background Highlighting**: Automatically shades the chart background during your defined trading hours (default: 7:00 - 23:00)
- **🎯 Smart Session Start Marker**: Places a marker on the last candle before session start, intelligently adapting to your timeframe:
- 1 Hour chart: Marker at 6:00
- 15 Minute chart: Marker at 6:45
- 5 Minute chart: Marker at 6:55
- 1 Minute chart: Marker at 6:59
- **🌍 Timezone Support**: Choose from multiple timezones (Europe/Prague, Europe/London, America/New_York, UTC)
- **🎨 5 Marker Styles**: Customize your session start indicator:
- Triangle
- Circle
- Diamond
- Label with time text
- Vertical line
- **⚙️ Fully Customizable**: Adjust start/end hours, timezone, and marker style through simple settings
## Settings
- **Start Hour**: Set your session start time (0-23)
- **End Hour**: Set your session end time (0-23)
- **Timezone**: Select your trading timezone
- **Marker Style**: Choose your preferred visual marker
## Use Cases
- Identify London/New York trading sessions
- Mark Asian session hours
- Highlight your personal trading windows
- Avoid trading during off-hours
- Perfect for day traders and scalpers
## Installation
1. Copy the Pine Script code
2. Open TradingView Pine Editor
3. Paste the code and click "Add to Chart"
4. Configure settings to match your trading schedule
TrendFlowTrendFlow is a visual trend analysis tool that helps identify changes in market direction and momentum.
It uses three exponential moving averages (EMA 21, EMA 50, and EMA 200) to define short-, medium-, and long-term trend structure.
A dynamic color fill highlights the relationship between the 21 and 50 EMAs:
When EMA 21 is above EMA 50, a green fill indicates upward momentum.
When EMA 21 is below EMA 50, a red fill shows downward momentum.
The EMA 200 line adapts its color based on its position relative to the shorter EMAs:
Red when above both EMAs (strong upward structure)
Green when below both EMAs (strong downward structure)
Gray when between them (neutral or consolidation phase)
This setup provides a clear visual framework for observing trend flow and directional bias over multiple timeframes.
Developed by The Volume Hub Fintech and Strategy Development

Buyside & Sellside Liquidity The Buyside & Sellside Liquidity Indicator is an advanced Smart Money Concepts (SMC) tool that automatically detects and visualizes liquidity zones and liquidity voids (imbalances) directly on the chart.
🟢 Function and meaning:
1. Buyside Liquidity (green):
Highlights price zones above current price where short traders’ stop-loss orders are likely resting.
When price sweeps these areas, it often indicates a liquidity grab or stop hunt.
👉 These zones are labeled with 💵💰 emojis for a clear visual cue where smart money collects liquidity.
2. Sellside Liquidity (red):
Highlights zones below the current price where long traders’ stop-losses are likely placed.
Once breached, these often signal a potential reversal upward.
👉 The 💵💰🪙 emojis make these liquidity targets visually intuitive on the chart.
3. Liquidity Voids (bright areas):
Indicate inefficient price areas, where the market moved too quickly without filling orders.
These zones are often revisited later as the market seeks balance (fair value).
👉 Shown as light shaded boxes with 💰 emojis to emphasize imbalance regions.
💡 Usage:
• Helps spot smart money manipulation and stop hunts.
• Marks potential reversal or breakout zones.
• Great for traders applying SMC, ICT, or Fair Value Gap strategies.
✨ Highlight:
Dollar and money bag emojis (💵💰🪙💸) are integrated directly into chart labels to create a clear and visually engaging representation of liquidity areas.


NOVA Breakout Signals v2.2 (TF M30)A clean, rules-based breakout signal tool for 30-minute charts.
It detects Dow swing breakouts and filters them with RSI, MACD and Volume so you only see the higher-quality entries. The script does not place trades and does not calculate SL/TP – it only prints clear LONG/SHORT labels at the entry price.
⸻
How it works
1. Timeframe enforcement – Signals are generated only on M30. On other timeframes the script shows a notice and stays silent.
2. Breakout engine (Dow swings) – The last confirmed swing high/low (pivots) is tracked.
• Breakout Up: bar closes above the last swing high by a small buffer.
• Breakout Down: bar closes below the last swing low by a small buffer.
3. Quality filters (all must be true):
• RSI (default length 30):
• Long: RSI > threshold and rising.
• Short: RSI < threshold and falling.
• MACD (12/26/9):
• Long: histogram > 0 and line > signal.
• Short: histogram < 0 and line < signal.
• Volume: current volume > SMA(volume, 20) × multiplier.
4. Debounce / anti-spam
• Cooldown of 4 hours (8 M30 bars) after any signal.
• Minimum price distance from the previous signal to avoid clustered labels.
Signals appear once the bar closes (barstate.isconfirmed). No swing lines are drawn to keep the chart clean; only entry labels are shown.
⸻
Inputs (key)
• RSI length & thresholds for Long/Short confirmation.
• MACD uses 12/26/9 (fixed).
• Volume multiplier (relative to SMA 20).
• Breakout buffer %, Cooldown hours, Min distance %.
• Show labels (on/off).
⸻
Usage tips
• Start with gold/major FX/indices on M30; use “Once per bar close” if you attach alerts.
• Increase the breakout buffer and volume multiplier in choppy markets.
• Tighten RSI thresholds (e.g., 55/45) if you want fewer but stronger signals.
⸻
Notes & limitations
• Pivots confirm after a few bars by definition; signals themselves are printed only on confirmed bar close and do not repaint once shown.
• This is a signal indicator, not investment advice. Always manage risk.

Bias Macro: M2 (FRED) → Canal de MoisésCorrelacion positiva con el oro, sirve para la tendencia macro del xauusd

Dow Jones Trading System with PivotsThis TradingView indicator, tailored for the 30-minute Dow Jones (^DJI) chart, supports DIA options trading with a trend-following approach. It features a 30-period SMA (blue) and a 60-period SMA (red), with an optional 90-period SMA (orange) drawn from rauItrades' Dow SMA outfit. A bullish crossover (30 SMA > 60 SMA) displays a green "BUY" triangle below the bar for potential DIA longs, while a bearish crossunder (30 SMA < 60 SMA) shows a red "SELL" triangle above for shorts or exits. The background turns green (bullish) or red (bearish) to indicate trend bias. Pivot points highlight recent highs (orange circles) and lows (purple circles) for support/resistance, using a 5-bar lookback. Alerts notify for crossovers.

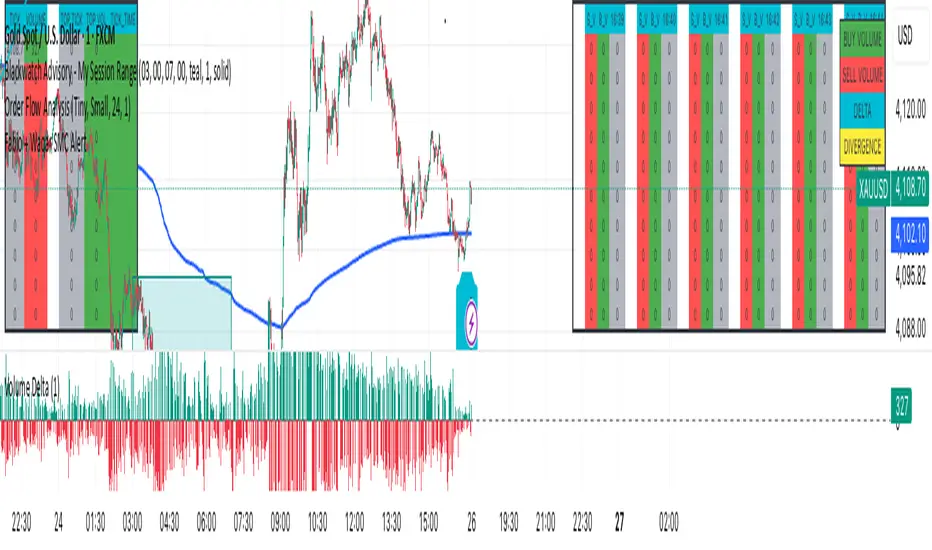
F & W SMC Alerthis script is a custom TradingView indicator designed to combine elements of a trend‑following VWAP approach (inspired by the “Fabio” strategy) with a smart‑money‑concepts framework (inspired by Waqar Asim). Here’s what it does:
* **Directional bias:** It calculates a 15‑minute VWAP and compares the current 15‑minute close to it. When price is above the 15‑minute VWAP, the script assumes a long bias; when below, a short bias. This reflects the trend‑following aspect of the Fabio strategy.
* **Liquidity sweeps:** Using recent pivot highs and lows on the current timeframe, it identifies when price takes out a recent high (for potential longs) or low (for potential shorts). This represents a “liquidity sweep” — a fake breakout that collects stops and signals a possible reversal or continuation.
* **Break of structure (BOS):** After a sweep, the script confirms that price is breaking away from the swept level (i.e., higher than recent highs for longs or lower than recent lows for shorts). This BOS confirmation helps avoid false signals.
* **Entry filters:** For a long setup, the bias must be long, there must be a liquidity sweep followed by a BOS, and price must reclaim the current‑timeframe VWAP. For a short setup, the opposite conditions apply (short bias, sweep + BOS to the downside, and price rejecting the VWAP).
* **Alerts and plot:** It provides two alert conditions (“Fabio‑Waqar Long Setup” and “Fabio‑Waqar Short Setup”) that you can attach to notifications. It also plots the intraday VWAP on your chart for visual reference.
In short, this script watches for a confluence of trend direction, liquidity sweeps, structural shifts, and VWAP reclaim/rejection, and then notifies you when those conditions align. You can use it as an alerting tool to identify high‑probability setups based on these combined strategies.

Fabio + Waqar SMC AlertThis script is a custom TradingView indicator designed to combine elements of a trend‑following VWAP approach (inspired by the “Fabio” strategy) with a smart‑money‑concepts framework (inspired by Waqar Asim). Here’s what it does:
* **Directional bias:** It calculates a 15‑minute VWAP and compares the current 15‑minute close to it. When price is above the 15‑minute VWAP, the script assumes a long bias; when below, a short bias. This reflects the trend‑following aspect of the Fabio strategy.
* **Liquidity sweeps:** Using recent pivot highs and lows on the current timeframe, it identifies when price takes out a recent high (for potential longs) or low (for potential shorts). This represents a “liquidity sweep” — a fake breakout that collects stops and signals a possible reversal or continuation.
* **Break of structure (BOS):** After a sweep, the script confirms that price is breaking away from the swept level (i.e., higher than recent highs for longs or lower than recent lows for shorts). This BOS confirmation helps avoid false signals.
* **Entry filters:** For a long setup, the bias must be long, there must be a liquidity sweep followed by a BOS, and price must reclaim the current‑timeframe VWAP. For a short setup, the opposite conditions apply (short bias, sweep + BOS to the downside, and price rejecting the VWAP).
* **Alerts and plot:** It provides two alert conditions (“Fabio‑Waqar Long Setup” and “Fabio‑Waqar Short Setup”) that you can attach to notifications. It also plots the intraday VWAP on your chart for visual reference.
In short, this script watches for a confluence of trend direction, liquidity sweeps, structural shifts, and VWAP reclaim/rejection, and then notifies you when those conditions align. You can use it as an alerting tool to identify high‑probability setups based on these combined strategies.
MACD with Smart Entry Signals & Trend Filter
This advanced MACD indicator combines traditional MACD analysis with intelligent entry signal detection and an optional EMA trend filter. It identifies high-probability entry points by analyzing histogram patterns, consolidation phases, and trend continuation setups.
### Key Features
**🎯 Smart Entry Detection**
- **Consolidation Breakouts**: Identifies exits from consolidation zones (weak bars) with strong momentum
- **Trend Reversals**: Detects potential trend changes after extended weak phases
- **Correction/Continuation Patterns**: Recognizes brief corrections within strong trends that offer continuation opportunities
**📊 Enhanced MACD Visualization**
- Color-coded histogram showing four distinct states:
- Strong Bullish (dark green): Rising histogram above zero
- Weak Bullish (light green): Falling histogram above zero
- Weak Bearish (light red): Rising histogram below zero
- Strong Bearish (dark red): Falling histogram below zero
**🔍 Multi-Layer Filtering System**
- **Candle Size Filter**: Eliminates signals during high volatility/large candle ranges
- **EMA Trend Filter**: Optional filter ensuring entries align with the dominant trend direction
- Visual markers for rejected signals (orange X for candle size, blue E for EMA trend)
**⚙️ Customizable Parameters**
- Adjustable MACD periods (default: 34/144/9)
- Configurable consolidation bar requirements
- Flexible correction pattern detection
- EMA trend filter with adjustable sensitivity
- Multiple alert types for all signal conditions
### How to Use
1. **Enable/disable filters** based on your trading style and market conditions
2. **Green triangles (L)**: Long entry signals when all conditions are met
3. **Red triangles (S)**: Short entry signals when all conditions are met
4. **Rejected signal markers**: Help you understand why certain setups were filtered out
5. **Background coloring**: Provides visual confirmation of signal zones and correction patterns
### Alert System
Comprehensive alerts for:
- Long and short entry signals
- Specific pattern types (consolidation, reversal, continuation)
- Rejected signals (helps refine strategy)
- Traditional MACD histogram crossovers
### Best Practices
- Use the EMA trend filter in trending markets to avoid counter-trend trades
- Adjust candle size filter based on your instrument's typical volatility
- Consider combining with support/resistance levels for confirmation
- Test different consolidation bar settings for your timeframe
### Parameters Summary
- Fast/Slow Length: MACD calculation periods
- Signal Smoothing: Signal line period
- Consolidation Bars: Minimum weak bars before breakout
- Max Candle Range: Filter for oversized candles
- EMA Period & Sensitivity: Trend filter configuration
---
*This indicator is designed for traders who want a systematic approach to identifying MACD-based entry opportunities with built-in risk management through filtering.*


3 EMA Breakout + RSI Pro3in 1 will mostly tell yuo the direction of the trend and tell you to buy and sell but it is not a guarantee that you will take the trade this is only a technical analysis.

3 EMA Breakout + RSI Pro3in 1 will mostly tell yuo the direction of the trend and tell you to buy and sell but it is not a guarantee that you will take the trade this is only a technical analysis.

3 EMA Breakout + RSI Pro3in 1 will mostly tell yuo the direction of the trend and tell you to buy and sell but it is not a guarantee that you will take the trade this is only a technical analysis.

XAUUSD Family Scalping (5min)🟡 XAUUSD Family Scalping 5-Min — Momentum Precision Indicator
Overview
This indicator is built for XAUUSD (Gold) on the 5-minute timeframe and is designed for short-term momentum scalping.
It helps traders identify early reversal zones, confirm momentum direction, and detect exhaustion points during high-volatility market moves.
Core Concept
The indicator measures momentum strength and price acceleration using a smoothed oscillator.
It features two adjustable thresholds:
Overbought level: 58
Oversold level: -58
When the momentum line crosses above or below these zones, it signals potential trend continuation or reversal opportunities.
Features
Detects short-term momentum shifts on XAUUSD 5M.
Works with EMA-based trend confirmation (optional).
Adaptive smoothing reduces noise and false reversals.
Highlights overbought/oversold areas visually.
Can be combined with price action or other oscillators for confluence.
Usage
Instrument: XAUUSD (Gold)
Best timeframe: 5-minute (scalping setup)
Use case: Detecting momentum exhaustion and reversal entries.
Sessions: London & New York recommended.
Disclaimer
This indicator is for market analysis and educational purposes.
No indicator guarantees profit — use proper risk management and test before live trading.

Thiru-Killzones"Thiru-Killzones - Enhanced FX Market Sessions Indicator
This is an enhanced version of the popular FX Market Sessions indicator with the following improvements:
🔧 ENHANCEMENTS:
• Added 5th Session support (NYPM - New York PM session)
• Removed all alert functionality for cleaner chart display
• Optimized plot usage to stay within TradingView's 64-plot limit
• Cleaned up UI by removing bullet point separators
• Enhanced session box styling and visibility
• Improved table display with proper row management
📊 FEATURES:
• 5 customizable trading sessions (Asia, London, NYAM, Lunch, NYPM)
• Session time zones and extensions
• Opening range detection
• Fibonacci level overlays
• Bar coloring options
• Analysis tables with session statistics
🎯 USAGE:
Perfect for identifying key market sessions and their impact on price action.
The 5-session setup provides comprehensive coverage of global FX markets.
Based on the original FX Market Sessions indicator by boitoki, enhanced with additional functionality."

Min_Position_Size_ALLLibrary "Min_Position_Size_ALL"
getMinPositionSize(symbol_, type_, broker_)
Parameters:
symbol_ (string)
type_ (string)
broker_ (string)

VIX Overnight Unch or Up AlertThis indicator alerts when VIX opens the day unchanged or higher on the day. If in fact VIX opens up unchanged or higher, it will display near the first bar of the day, previous day's close time and level and the opening time and level. The close time is typically 16:15 New York Time and the opening time is 09:30 or the first print a few minutes later. I use TVC:VIX instead of CBOT because TVC for me is real time. I also use the 1 minute chart and the script is coded as 1 minute.

Midnight Lines for Tokyo, London, New Yorkممتاز 👌 إليك **تعريفًا محدثًا وكاملًا للمؤشر باللغتين العربية والإنجليزية**، مع إدراج توضيح دقيق لتعامل المؤشر مع **تغيّر التوقيت الصيفي والشتوي (DST)** في لندن ونيويورك:
---
## 🇬🇧 **English Description (with DST behavior)**
**Indicator name:** *Midnight Lines for Tokyo, London, and New York*
**Purpose:**
This indicator automatically draws **vertical lines** on the chart at **midnight (00:00)** for the three major global trading sessions:
* **Tokyo**
* **London**
* **New York**
### 🔹 How it works:
1. The script checks each candle’s time using the built-in TradingView time zone function:
* `"Asia/Tokyo"`
* `"Europe/London"`
* `"America/New_York"`
2. When it detects **00:00** in any of these zones, it draws:
* A **vertical dotted line** that extends from the top to the bottom of the chart.
* A **label** at the top with the session name (e.g., “Tokyo Midnight”).
3. Each session has its own color for clarity:
* **Blue** → Tokyo Midnight
* **Green** → London Midnight
* **Red** → New York Midnight
### 🕒 Automatic Daylight Saving Time (DST) Adjustment:
The indicator automatically adapts to **Daylight Saving Time changes** in both **London** and **New York**:
* When London switches between **GMT and GMT+1**, the midnight line shifts automatically to remain accurate.
* When New York switches between **EST and EDT**, the script also updates accordingly.
* Tokyo does **not** observe DST, so its timing stays constant year-round.
### 🎯 Purpose:
Helps traders visually track the start of each new trading day in the major sessions and analyze:
* Session overlaps (e.g., London–New York overlap)
* Session-based trading strategies
* Price movement behavior at each new day open
---
## 🇸🇦 **الوصف بالعربية (مع إدراج تغير التوقيت)**
**اسم المؤشر:** خطوط منتصف الليل لجلسات طوكيو، لندن، ونيويورك
**الهدف:**
يقوم هذا المؤشر تلقائيًا برسم **خطوط عمودية** على الرسم البياني عند **منتصف الليل (00:00)** لكل من الجلسات الثلاث الرئيسية:
* **جلسة طوكيو**
* **جلسة لندن**
* **جلسة نيويورك**
### 🔹 كيفية العمل:
1. يستخدم المؤشر دوال TradingView لحساب الوقت الفعلي لكل مدينة:
* `"Asia/Tokyo"` لطوكيو
* `"Europe/London"` للندن
* `"America/New_York"` لنيويورك
2. عند وصول الساعة إلى **00:00** بتوقيت أي مدينة، يرسم المؤشر:
* **خطًا عموديًا متقطعًا** يمتد من أعلى إلى أسفل الرسم البياني.
* **تسمية (Label)** أعلى الخط باسم الجلسة (مثل “Tokyo Midnight”).
3. كل جلسة لها لون مختلف:
* **أزرق** → منتصف طوكيو
* **أخضر** → منتصف لندن
* **أحمر** → منتصف نيويورك
### 🕒 التعامل مع تغيّر التوقيت الصيفي والشتوي (DST):
يتكيّف المؤشر تلقائيًا مع تغيّر التوقيت في لندن ونيويورك:
* عندما تنتقل لندن بين **التوقيت الشتوي (GMT)** و**التوقيت الصيفي (GMT+1)**، يتحرك الخط تلقائيًا ليبقى في الساعة 00:00 المحلية.
* وعندما تنتقل نيويورك بين **EST** و**EDT**، يتم تعديل الخط كذلك تلقائيًا.
* أما طوكيو فلا تعتمد التوقيت الصيفي، لذا يبقى وقتها ثابتًا دائمًا على الساعة **00:00 JST**.
### 🎯 الفائدة:
يساعد المتداولين على تحديد **بداية كل جلسة تداول رئيسية**، ومراقبة:
* **تداخل الجلسات** مثل لندن ونيويورك
* **تحركات السعر عند بداية اليوم الجديد**
* **استراتيجيات التداول الزمنية حسب الجلسة**
---

Tokyo Session DivisionsTokyo Session Divisions
Description:
Asia Range Breakout is a sophisticated, multi-filter trading tool designed to identify high-probability breakout opportunities during the core Asian trading session. By combining session-based range analysis with advanced confirmation filters like Heiken Ashi momentum, Ichimoku baseline trends, and EMA alignment, this indicator helps traders capture decisive moves while filtering out market noise.
Tired of false breakouts? This system provides a structured framework to trade the Sydney and Tokyo sessions with precision and confidence.
Key Features:
Multi-Session Range Tracking:
Monitors 6 distinct pre-defined Asian sessions (Sydney Box, Tokyo Pre-Open, Tokyo Launch, etc.).
Dynamically plots High and Low boundaries for each session (Teal for Highs, Red for Lows).
Individually toggleable sessions to focus on your preferred trading window.
Smart Alert & Signal System:
Generates alerts based on Heiken Ashi candle closings relative to session ranges.
Dual-Size Signals: Differentiates between "Large" breakouts (outside the range) and "Small" signals (within the range).
Configurable alert timeframe for confirmation candle closure.Built-in Sound Alerts for real-time notifications.
Advanced Confirmation Filters:
Heiken Ashi Momentum Filter: Ensures breakout candles have significant momentum, adjustable via a threshold multiplier.
EMA 200 Filter: Confirms the breakout's alignment with the broader trend.
Ichimoku Baseline (Kijun-sen) Filter: Uses a dynamic support/resistance level for additional confirmation.
Ichimoku Baseline Divergence Filter: A unique feature that requires the baseline's slope to match the breakout direction (Bullish for buys, Bearish for sells).
ATR Volatility Filter: (Optional) Ensures the breakout candle has sufficient range relative to recent market volatility.
Visual Enhancements:
Take-Profit Lines: Projects profit targets using ATR and connects consecutive alerts with a trendline.
Heiken Ashi Overlay: Displays smoothed Heiken Ashi candles directly on the main chart for cleaner trend visualization.
Divergence Trend Line: Visually plots the slope of the Ichimoku Baseline for quick trend assessment.
Session Background Highlighter: Shades the active sessions for easy time reference.
Comprehensive Debug Info Box: Provides real-time feedback on filter status, perfect for strategy validation and learning.
Usage Instructions & Tips:
1. Initial Setup:
Start simple! Apply the indicator to a 5-minute or 1-minute chart.
Recommended Instruments:
Forex: Major pairs like AUD/USD , USD/JPY or EUR/JPY.
Indices: `NAS100` (Nasdaq), `US30` (Dow Jones), `JP225` (Nikkei 225).
Commodities: `XAUUSD` (Gold).
Initially, enable only the Sydney Box (00:30 - 03:15 UTC) as it is the most robust session, then explore others.
2. Interpreting the Signals:
Large Green Arrow (Above Bar): A strong BUY signal. The Heiken Ashi candle closed above the session's High, and all enabled filters are confirmed.
Small Green Arrow (Above Bar): A moderate BUY signal. The candle closed bullishly but within the session range.
Large Red Arrow (Below Bar): A strong SELL signal. The Heiken Ashi candle closed below the session's Low, with filter confirmation.
Small Red Arrow (Below Bar): A moderate SELL signal. The candle closed bearishly but within the session range.
3. Optimizing Your Strategy:
Filter Tuning: The default filters are balanced. Adjust them based on your risk appetite:
Increase the Heiken Ashi Threshold (e.g., to 0.2) for fewer, but stronger signals.
Disable filters like ATR or Divergence if you find them too restrictive.
The Power of Divergence: The Ichimoku Divergence filter is a powerful trend-confirmation tool. Pay close attention to it for the highest-quality signals.
Use the Debug Box: Enable the "Show Debug Info Box" to see exactly why a signal did or did not trigger. This is invaluable for understanding the indicator's logic and avoiding bad trades.
4. Risk Management:
The TP Lines provide a logical profit target based on market volatility. Consider using them for setting take-profit orders.
Always use a stop-loss. A logical level is the opposite side of the session range (e.g., for a buy signal, place a stop below the session low).

Lodon Session DivisionsLondon Session Divisions - Situational Analysis Mastery
Professional Breakout & Trend-Following Strategy Based on Tom Hougaard's Situational Analysis
🎯 WHAT IS THIS INDICATOR?
A sophisticated multi-timeframe breakout scanner designed for European trading sessions, implementing the powerful "Situational Analysis" methodology from renowned trader Tom Hougaard. This professional tool identifies high-probability breakout opportunities with comprehensive filter systems to ensure quality signals.
⭐ KEY FEATURES
🏛️ SESSION-BASED TRADING
- European Overnight Range
- London Pre-Open & First Breakouts
- Tokyo Box & London Launch Sessions
- Smart Session Detection with Auto-DST
🎯 ENHANCED CONDITIONS
- School Run Strategy (SRS) by Tom Hougaard
- Anti-SRS Filter for counter-trend opportunities
- Session-specific logic for optimal entry timing
🛡️ ADVANCED FILTER SYSTEMS
- Heiken Ashi Momentum Confirmation
- EMA 200 Trend Filter
- Ichimoku Baseline & Divergence
- RSI Threshold Filter
- ATR Volatility Filter
- Multi-timeframe Compatibility
⚡ SMART ALERTS & VISUALS
- Multi-timeframe Alert Confirmation
- Breakout Size Detection (Beyond/Within Range)
- Take Profit Levels with ATR Calculation
- Customizable Visual Markers
- Enhanced Alert Messages with Filter Status
📈 OPTIMIZED FOR
- GERMAN DAX ⚡
- OIL & GOLD 🛢️
- NIKKEI 🇯🇵
- US30 & NASDAQ 🇺🇸
- All Major Indices & Commodities
🔧 CORE STRATEGY PHILOSOPHY
This indicator embodies Tom Hougaard's Situational Analysis approach :
- Identify the Situation : Market context through session analysis
- Define the Action : Clear breakout levels and ranges
- Execute with Precision : Filtered, high-quality signals
- Manage the Trade : Built-in TP levels and size detection
🎨 CUSTOMIZATION OPTIONS
Session Management
- Toggle individual trading sessions
- Smart session auto-disable with SRS/Anti-SRS
- Customizable session times
Filter Controls
- Enable/disable all filter systems independently
- Adjustable timeframe for each filter
- Custom threshold settings
Visual Preferences
- Heiken Ashi overlay display
- Breakout marker styles and colors
- TP line customization
- Debug information panel
📊 HOW TO USE
1. SETUP : Apply to your preferred instrument (DAX, Oil, Gold, etc.)
2. CONFIGURE : Enable your preferred sessions and filters
3. MONITOR : Watch for breakout markers during active sessions
4. EXECUTE : Enter on confirmed breakouts with filter alignment
5. MANAGE : Use built-in TP levels or your own risk management
⚠️ RISK DISCLAIMER
This indicator is for educational and informational purposes only. Trading involves substantial risk and is not suitable for every investor. Always practice proper risk management and backtest strategies before live trading. Past performance is not indicative of future results.
🔒 TECHNICAL SPECIFICATIONS
- Platform : TradingView Pine Script v6
- Compatibility : All timeframes
- Markets : Forex, Indices, Commodities, Stocks
- Updates : Regular improvements and bug fixes
📞 SUPPORT & UPDATES
Regular updates based on user feedback and market changes. For suggestions or issues, please comment on the publication.
⭐ If this indicator helps your trading, please like and follow for more advanced tools! ⭐
Why Traders Love This Indicator:
✅ Comprehensive Filter System reduces false signals
✅ Session-Based Logic aligns with professional trading hours
✅ Multiple Timeframe Analysis for confirmation
✅ Customizable for Any Trading Style
✅ Professional-Grade Risk Management Tools
Boost your breakout trading profitability with institutional-grade session analysis!

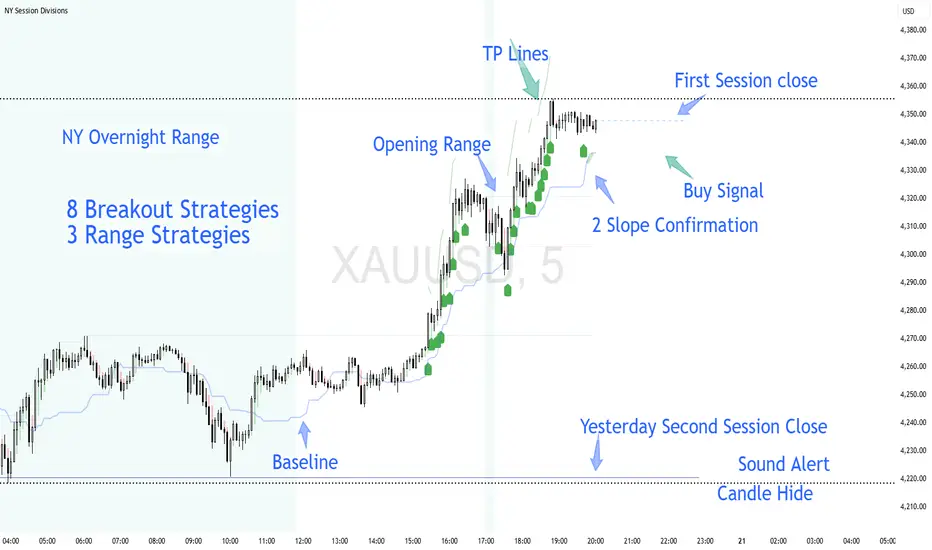
NY Session Divisions⭐NY Session Divisions - Professional Trading Session Manager
NY Session Divisions is an advanced trading indicator that professionally segments the New York trading day into precise sessions, providing institutional-grade market structure analysis with smart breakout detection and comprehensive filtering systems.
✨ KEY FEATURES
🕒 8 Professional Trading Sessions
- US Overnight Range (03:30-11:50)
- NY Pre-Open (16:45-17:00)
- NY First Session ORB (17:00-17:15)
- Premarket Range - Recommended by Mahdi Salari*
- NY Midday Range
- NY 2nd Pre-Open
- 2nd Session ORB
- US After Hours ORB
🎯 Advanced Trading Strategies
- School Run Strategy (SRS) by Tom Hougaard - Breakout-focused approach
- Anti-SRS Strategy - Range-trading methodology
- Dual Strategy System - Combine breakout and range trading for maximum flexibility
🔔 Smart Alert System
- Multi-timeframe confirmation
- Heiken Ashi candle validation
- Customizable alert conditions
- Sound notifications with detailed messages
- Post-close confirmation to avoid false signals
🛡️ Professional Filter Stack
- Ichimoku Baseline
- Divergence Detection - Advanced market analysis
- EMA 200 Filter - Trend alignment
- Ichimoku Baseline - Market structure
- ATR Filter - Volatility validation
- RSI Filter - Momentum confirmation
🎨 Advanced Visualization
- Clean session range displays
- Professional Heiken Ashi candles
- Smart breakout markers (Small/Tiny for signal strength)
- Take Profit lines with ATR-based calculations
- Customizable colors and opacity
🏆 WHY TRADERS LOVE THIS INDICATOR
✅ For Breakout Traders
- Precise session boundary detection
- Clean breakout signals with confirmation
- Multiple filter validation
✅ For Range Traders
- Clear session range identification
- Anti-SRS strategy for range-bound markets
- Support/Resistance level tracking
✅ For Professional Traders
- Institutional-grade session management
- Comprehensive filtering system
- Multi-timeframe analysis
- Customizable risk management
⚡ QUICK START GUIDE
Basic Setup (2 Minutes)
1. Enable Sessions** - Choose 1-2 sessions to start
2. Set Alerts - Configure your preferred notification method
3. Apply Filters - Enable EMA 200 and Ichimoku for starters
Advanced Configuration
- Combine SRS + Anti-SRS for comprehensive strategy
- Use multiple divergence filters for confirmation
- Customize TP lines based on your risk profile
- Drawing 1st and 2nd Session Close lines
PROFESSIONAL TIPS
Session Selection Strategy
- Start with Session 1 (US Overnight) for overall market trend identification
- Add Session 3 (NY First ORB) for opening momentum
- Use Session 4 (Premarket) for the best perfomance of the breakout strategy
Filter Optimization
- Conservative : EMA 200 + Ichimoku Baseline
- Balanced : Add ATR filter for volatility check 0.8 is enough
- Aggressive : Enable all filters for maximum confirmation but the number of signal and performance will decrease
Risk Management
- Use TP lines for automatic profit targets
- Combine with proper position sizing
- Always use stop losses
🔧 TECHNICAL SPECIFICATIONS
- Platform : TradingView Pine Script v6
- Markets : All US trading instruments (ES, NQ, YM, CL, etc.)
- Timeframes : 1min to Daily
- Auto DST Handling : Yes
- Real-time Processing : Yes
📊 PERFORMANCE FEATURES
- Zero Repaint - All signals confirmed after candle close
- Multi-Timeframe - Works across all chart timeframes
- Resource Optimized - Efficient calculation methods
- User Customizable - Complete control over all parameters
- Consistent Performance - Reliable session-based signals
- Professional Grade - Institutional-level analysis tools
- Continuous Updates - Regular improvements and enhancements
- Community Supported - Active user community and support
🔄 KEEP UPDATED
Click the Favorite Star ⭐ to receive update notifications and stay current with new features and improvements!
Professional traders don't guess - they analyze. NY Session Divisions gives you the analytical edge.
Happy Trading! 📈
Created with precision for serious traders
DISCLAIMER
This indicator is for educational and informational purposes only. It should not be considered as financial advice. Always practice proper risk management and test strategies in demo accounts before live trading. Past performance does not guarantee future results.