Simple Moving Averages (5, 10, 20, 60, 120, 200SMA for different time frames.
Covers 5, 10, 20, 60, 120, 200 sma units
"涨幅超过60日均线的股票" için komut dosyalarını ara

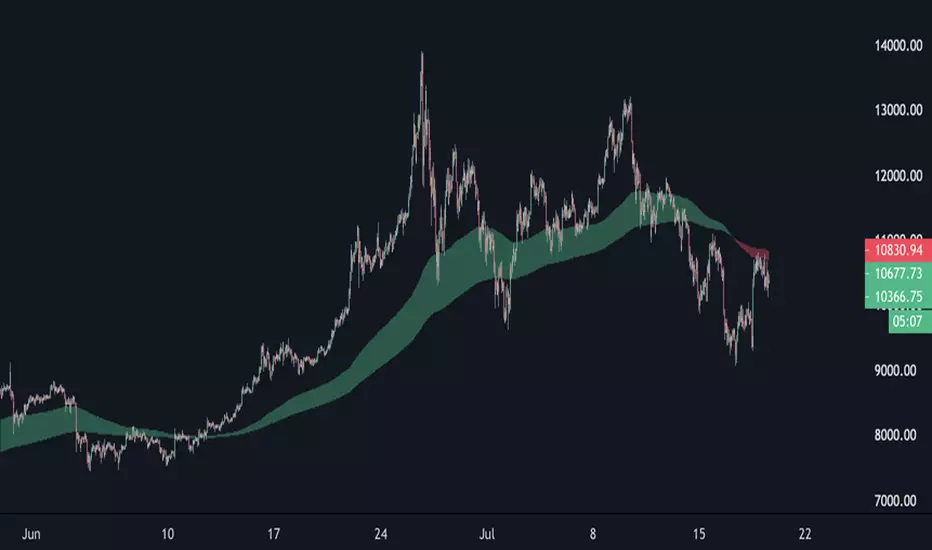
EMA Cloud 9/30/60 – Visual Trend Strength - CryptowitchThis indicator displays three Exponential Moving Averages (EMAs):
🔸 EMA 9 (short-term)
🔸 EMA 30 (mid-term)
🔸 EMA 60 (long-term)
A dynamic cloud is drawn between EMA 9 and EMA 30 to visually highlight trend momentum:
Green cloud = bullish momentum (EMA 9 above EMA 30)
Red cloud = bearish momentum (EMA 9 below EMA 30)
This cloud setup helps quickly identify trend direction, momentum shifts, consolidation zones, and potential entry/exit points.
Clean, visual, and effective – suitable for scalpers, swing traders, and trend followers alike.


Emre AOI Zonen Daily & Weekly (mit Alerts, max 60 Pips)This TradingView indicator automatically highlights Areas of Interest (AOI) for Forex or other markets on Daily and Weekly timeframes. It identifies zones based on the high and low of the previous period, but only includes zones with a width of 60 pips or less.
Features:
Daily AOI Zones in blue, Weekly AOI Zones in yellow with 20% opacity, so candlesticks remain visible.
Persistent zones: AOI boxes stay on the chart until the price breaks the zone.
Multiple zones: Supports storing multiple Daily and Weekly AOIs simultaneously.
Break Alerts: Sends alerts whenever a Daily or Weekly AOI is broken, helping traders spot key levels in real-time.
Fully automated: No manual drawing needed; zones are updated and extended automatically.
Use Case:
Ideal for traders using a top-down approach, combining Weekly trend analysis with Daily entry signals. Helps identify support/resistance, supply/demand zones, and critical price levels efficiently.

EMA band 12/60/150/200EMA band consisting of 12/60/150/200
Specifically for Indian stock market, can be used for other trading scripts after testing.
Best use case : on Daily TF.
Bull run entry criteria, Not bear market or Bottom catching.

15-Minute and 60-Minute ORB with Wicks15 and 60 minute ORBs for each trading day. Simple, yet effective.


EMA (10,20,60) + Bollinger BandsCombination of bollinger bands and exponential moving averages (10, 20, 60)
The coloring is optimized for dark background, and it is editable
This indicator combined 3 exponential moving average lines and bollinger bands . The EMA lines can be add or deleted in pine editor, and its parameters can be changed too. Same to the bollinger bands . Defaulted value for BB is 20SMA with 2 standard deviations.
Useful as a supplmentary indicators

EMA30,60,100 EMA 30 (orange),60(red),100(green)
Bullish: green below the other two
Bearish: green above other two
when lines cross, no clear trend.
When Price touches the orange = entry point
Thanks to CFXtrader for the basic script


[STRATEGY]EMA 30/60 Cross Strategystrategy based on EMA 30/60 cross
works best on 4hr timeframes & high-midcaps


120/60 Trend ModelCombination of 120 & 60 EMAs used to determine entries as well as the over all trend.
Guppy MMA 3, 5, 8, 10, 12, 15 and 30, 35, 40, 45, 50, 60Guppy Multiple Moving Average
Short Term EMA 3, 5, 8, 10, 12, 15
Long Term EMA 30, 35, 40, 45, 50, 60
Use for SFTS Class

ICT Breaker Blocks [Exponential-X]🔄 Breaker Blocks
Overview
Breaker Blocks automatically identifies failed order blocks that have reversed their polarity. When an order block gets broken, it often becomes a powerful support or resistance zone in the opposite direction. This indicator tracks these institutional "flips" based on ICT (Inner Circle Trader) concepts, helping identify where price is likely to find strong support or resistance after a structural break.
━━━━━━━━━━━━━━━━━━━━━━━━━━━━
🎯 What This Indicator Does
Detects Breaker Blocks:
• 🔵 Bullish Breaker Blocks (BB+) - Failed bearish order blocks that became support
• 🟣 Bearish Breaker Blocks (BB-) - Failed bullish order blocks that became resistance
• Tracks order blocks first, then monitors when they break
• Converts broken order blocks into breaker blocks automatically
• Shows when breakers get tested by price
How Breakers Form:
1. Order block forms (last opposite candle before strong move)
2. Price returns and breaks through the order block
3. Broken order block becomes a breaker block with flipped polarity
4. Old resistance becomes new support (or vice versa)
Visual Display: Smart Features:
• Auto-timeframe adjustment for optimal detection
• ATR-based strength filtering
• Active block highlighting
• Test tracking
• Distance calculator
• Duplicate prevention
━━━━━━━━━━━━━━━━━━━━━━━━━━━━
📚 Understanding Breaker Blocks
What Are Breaker Blocks?
Breaker blocks are failed order blocks that price has broken through. In ICT methodology:
• When institutions place orders creating an order block
• If that level fails and price breaks through
• The zone often becomes strong support/resistance in the opposite direction
• This represents institutional position flipping
Why Breakers Form:
• Failed Defense: Institutions couldn't defend the original level
• Position Flip: Institutions reversed their position
• Stop Hunt Complete: After sweeping stops, new levels form
• Polarity Change: Old resistance becomes new support (or vice versa)
Key Difference From Order Blocks: [/b>
• Order Block: Original institutional level (unbroken)
• Breaker Block: Failed order block that flipped polarity
• Breakers often provide STRONGER reactions than original OBs
• Represents where institutions changed their strategy
━━━━━━━━━━━━━━━━━━━━━━━━━━━━
🔵 Bullish Breaker Blocks Explained
Formation Process:
1. Step 1: Bearish order block forms (last bullish candle before drop)
2. Step 2: Price breaks ABOVE this bearish OB
3. Step 3: The broken bearish OB becomes a bullish breaker
4. Step 4: Now acts as SUPPORT when price returns
What It Means:
• Old resistance level failed
• Institutions flipped from selling to buying
• When price returns, zone acts as strong support
• Higher probability long setup than regular support
Trading Bullish Breakers:
Entry Setup:
• Wait for price to retrace back to bullish breaker
• Look for rejection/bounce from the breaker zone
• Enter long when price respects the breaker as support
• Stop loss: Below the breaker block
• Target: Recent high or opposite breaker
Why It Works:
Failed resistance becoming support is a strong technical signal indicating structural change in market sentiment.
━━━━━━━━━━━━━━━━━━━━━━━━━━━━
🟣 Bearish Breaker Blocks Explained
Formation Process:
1. Step 1: Bullish order block forms (last bearish candle before rally)
2. Step 2: Price breaks BELOW this bullish OB
3. Step 3: The broken bullish OB becomes a bearish breaker
4. Step 4: Now acts as RESISTANCE when price returns
What It Means:
• Old support level failed
• Institutions flipped from buying to selling
• When price returns, zone acts as strong resistance
• Higher probability short setup than regular resistance
Trading Bearish Breakers:
Entry Setup:
• Wait for price to retrace back to bearish breaker
• Look for rejection/reversal from the breaker zone
• Enter short when price respects the breaker as resistance
• Stop loss: Above the breaker block
• Target: Recent low or opposite breaker
Why It Works:
Failed support becoming resistance indicates structural change and often leads to continuation moves.
━━━━━━━━━━━━━━━━━━━━━━━━━━━━
📊 How To Use This Indicator
Strategy 1: Breaker Block Retest
Timeframes: 15min, 1H, 4H
Style: [/b> Swing trading, reversal entries
Rules:
1. Identify active breaker block (bright color, not gray)
2. Wait for price to return to the breaker zone
3. Look for reversal confirmation (pin bar, engulfing, rejection)
4. Enter in the direction the breaker suggests
5. Stop: Beyond opposite side of breaker
6. Target: 2-3R or previous structure
Example - Bullish Breaker:
• Bullish breaker at $48,000-$48,500
• Price drops to $48,200 (enters breaker)
• Bullish pin bar forms
• Enter long at $48,600, stop at $47,800
• Target: $50,000+
Strategy 2: Multi-Timeframe Breakers
Timeframes: Combine 1H + 4H or 15min + 1H
Style: [/b> High-probability setups
Rules:
1. Identify breaker on higher timeframe (4H or Daily)
2. Switch to lower timeframe (1H or 15min)
3. Look for lower TF breaker WITHIN higher TF breaker
4. Trade the lower TF breaker in same direction as HTF
5. Stop: Below lower TF breaker
6. Target: Edge of higher TF breaker or beyond
Why It Works: Alignment across timeframes increases probability
Strategy 3: Breaker + Order Block Confluence
Timeframes: 1H, 4H
Style: High-conviction trades
Rules:
1. Find breaker block that overlaps with fresh order block
2. This creates double institutional zone
3. Wait for price to reach confluence area
4. Enter on first touch with confirmation
5. Stop: Beyond confluence zone
6. Target: 3-5R
Why It Works: Two ICT concepts aligned = maximum probability
Strategy 4: Breaker Breakout
Timeframes: [/b> 5min, 15min, 1H
Style: Trend continuation
Rules:
1. Price approaches breaker block
2. Instead of respecting it, price breaks THROUGH
3. This indicates very strong momentum
4. Enter breakout in direction of break
5. Stop: Back inside the breaker
6. Target: 2-3R
Why It Works: When breakers fail, momentum is extremely strong
━━━━━━━━━━━━━━━━━━━━━━━━━━━━
⚙️ Settings Explained
Core Settings
Auto-Adjust for Timeframe (Default: ON)
• Automatically optimizes detection for current chart
• 1min: 3 bars lookback
• 5min: 4 bars lookback
• 15min: 5 bars lookback
• 1H: 6 bars lookback
• 4H+: 8-12 bars lookback
• Recommended: Keep ON
Manual Detection Length (Default: 5)
• Only used when Auto-Adjust is OFF
• Lookback period for finding order blocks
• Lower = more sensitive
• Higher = more selective
Display Settings
Show Bullish/Bearish Breaker Blocks
• Toggle each type independently
• Customize colors (default: cyan and fuchsia)
• Tip: Use colors that stand out from order blocks
Max Breaker Blocks to Display (Default: 10) [/b>
• Limits visible breakers
• Lower (5-8): Cleaner chart
• Higher (15-30): More context
• Recommended: 10-15
Show Breaker Block Labels [/b>
• Displays BB+ and BB- text
• Shows 🎯 on active (nearest) breaker
• Turn OFF for minimal appearance
Extend Blocks (bars) (Default: 50)
• How far to extend boxes to the right
• Recommended: 40-60 bars
Filters
Block Strength Filter (Default: Medium)
• Low: 0.5x ATR - More breakers, more noise
• Medium: 1x ATR - Balanced
• High: 1.5x ATR - Only strongest breakers
• Note: Breakers are naturally less common than OBs
• For learning: Use Low to see more examples
• For trading: Use Medium or High
Min Block Size % (Default: 0.1)
• Minimum breaker size as % of price
• Filters tiny insignificant blocks
• Adjust based on instrument volatility
Advanced
Show Tested Blocks (Default: OFF) [/b>
• When ON: Shows gray boxes for tested breakers
• When OFF: Breakers disappear after test
• Use ON: For learning and analysis
• Use OFF: For clean active trading
Highlight Active Block (Default: ON)
• Highlights nearest breaker to current price
• Active block shown with brighter color and 🎯
• Recommended: Keep ON
━━━━━━━━━━━━━━━━━━━━━━━━━━━━
📱 Info Panel Guide
Bullish BB Count Bearish BB Count
• Number of active (untested) bearish breaker blocks
• More bearish breakers = More resistance zones above
Bias Indicator [/b>
• ⬆ Bullish: More bullish breakers (support > resistance)
• ⬇ Bearish: More bearish breakers (resistance > support)
• ↔ Neutral: Equal breakers on both sides
Near Indicator
• Shows nearest active breaker and distance
• Example: "Bull BB -1.5%" = Bullish breaker 1.5% below price
━━━━━━━━━━━━━━━━━━━━━━━━━━━━
📱 Alert Setup
This indicator includes 2 alert types:
1. Price Entering Bullish Breaker [/b>
• Fires when price touches bullish breaker block
• Action: Watch for bounce/support
2. Price Entering Bearish Breaker
• Fires when price touches bearish breaker block
• Action: Watch for rejection/resistance
To Set Up Alerts:
1. Click "Alert" button (clock icon)
2. Select "Breaker Blocks"
3. Choose alert type
4. Configure notifications
5. Click "Create"
━━━━━━━━━━━━━━━━━━━━━━━━━━━━
💎 Pro Tips & Best Practices
✅ DO:
• Wait for confirmation before entering at breakers
• First touch of breaker has highest reliability
• Use breakers with trend direction for best results
• Combine with order blocks and FVGs for confluence
• Check multiple timeframes for breaker alignment
• Respect breakers - they're stronger than regular S/R
• Use proper stop placement beyond the breaker
⚠️ DON'T:
• Don't trade every breaker - quality over quantity
• Don't ignore breaker breaks - very strong momentum signal
• Don't use tight stops - allow room for wicks
• Don't expect all breakers to hold
• Don't trade against strong momentum through breakers
• Don't confuse breakers with regular order blocks
🎯 Best Timeframes:
• Scalping: 5min, 15min (quick breaker tests)
• Day Trading: 15min, 1H (balanced)
• Swing Trading: 1H, 4H, Daily (major breakers)
🔥 Best Markets:
• Excellent: BTC, ETH, Forex majors, ES, NQ
• Good: Gold, Oil, Major indices
• Note: Breakers need volatility to form
━━━━━━━━━━━━━━━━━━━━━━━━━━━━
🎓 Advanced Concepts
Breaker Strength Hierarchy
From weakest to strongest:
1. Support/Resistance lines
2. Order Blocks (unbroken)
3. Breaker Blocks (broken OBs) ← Often strongest
4. Multiple breakers stacked together
Breaker vs Order Block Priority
If breaker and order block overlap:
• Breaker takes precedence
• Failed levels are more significant
• Price respects breakers more reliably
Nested Breakers [/b>
When lower timeframe breaker exists within higher timeframe breaker:
• Trade lower TF breaker first
• Use higher TF breaker as final target
• Highest probability setups
Multiple Breaker Tests [/b>
• First test: Highest probability
• Second test: Still valid but weaker
• Third test: Likely to break through
Breaker Breakouts [/b>
When price breaks through breaker:
• Extremely strong momentum signal
• Old level completely invalidated
• Trade the breakout aggressively
━━━━━━━━━━━━━━━━━━━━━━━━━━━━
📈 Common Patterns [/b>
Pattern 1: The Perfect Flip
• Bearish OB forms
• Price breaks above it cleanly
• Becomes bullish breaker
• First retest bounces perfectly
• High-probability setup
Pattern 2: The Double Break
• Bullish OB breaks down (becomes bearish breaker)
• Price tests it and rejects
• Later breaks back up through breaker
• Very strong momentum signal
Pattern 3: The Breaker Ladder [/b>
• Multiple breakers stacked like stairs
• Price bounces from one to next
• Each breaker provides support/resistance
Pattern 4: The Failed Breaker
• Breaker forms but gets broken immediately
• Shows extreme momentum
• Don't fight it - trade the breakout
━━━━━━━━━━━━━━━━━━━━━━━━━━━━
🙏 If You Find This Helpful
• ⭐ Leave your feedback
• 💬 Share your experience in the comments
• 🔔 Follow for updates and new tools
Questions about breaker blocks? Feel free to ask in the comments.
━━━━━━━━━━━━━━━━━━━━━━━━━━━━
Version History [/b>
• v1.0 - Initial release with auto-timeframe detection and polarity flip tracking

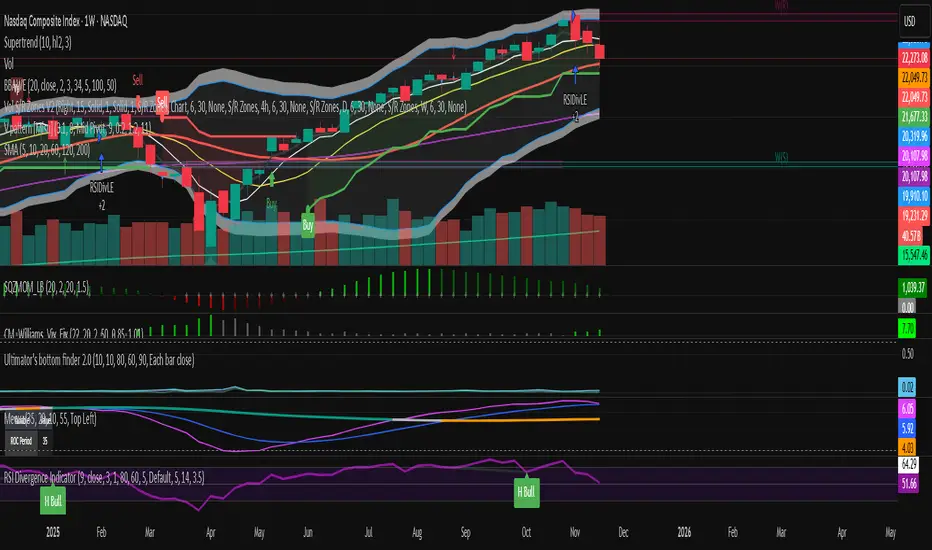
RSI Median DeviationRSI Median Deviation – Adaptive Statistical RSI for High-Probability Extremes
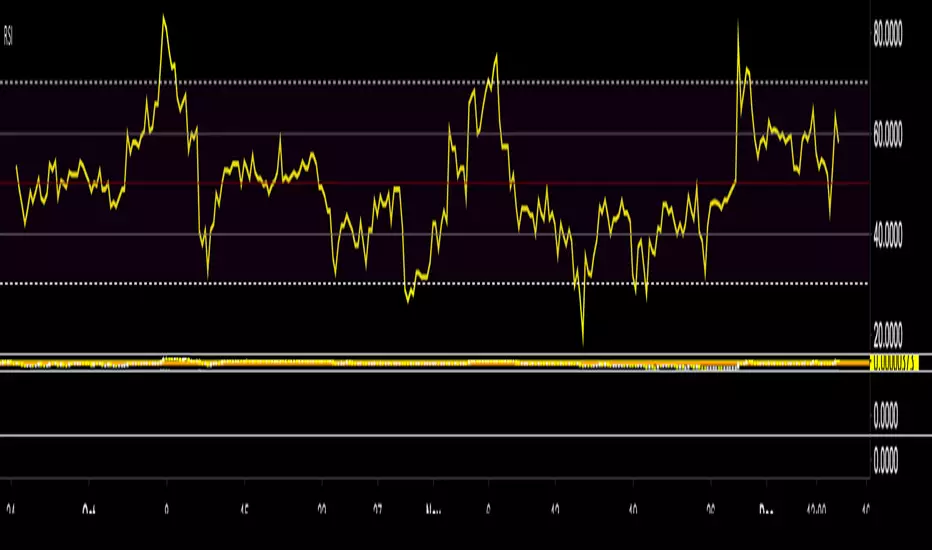
The Relative Strength Index (RSI) is a momentum oscillator developed by J. Welles Wilder in 1978 to measure the magnitude of recent price changes and identify potential overbought or oversold conditions. It calculates the ratio of upward to downward price movements over a specified period, scaled to 0-100. However, standard RSI often relies on fixed thresholds like 70/30, which can produce unreliable signals in varying market regimes due to their lack of adaptability to the actual distribution of RSI values.
This indicator was developed because I needed a reliable tool for spotting intermediate high-probability bottoms and tops. Instead of arbitrary horizontal lines, it uses the RSI’s own historical median as a dynamic centerline and measures how far the current RSI deviates from that median over a chosen lookback period. The main signals are triggered only at 2 standard deviation (2σ) extremes — statistically rare events that occur roughly 5 % of the time under a normal distribution. I selected 2σ because it is extreme enough to be meaningful yet frequent enough for practical trading. For oversold signals I further require RSI to be below 42, a filter that significantly improved results in my mean-reversion tests (enter on oversold, exit on the first bar the condition is no longer true).
The combination of percentile median + standard deviation bands is deliberate: the median is far more robust to outliers than a simple average, while the SD bands automatically adjust to the current volatility of the RSI itself, producing adaptive envelopes that work equally well in ranging and trending markets.
Underlying Concepts and Calculations
Base RSI: RSI = 100 − (100 / (1 + RS)), RS = average gain / average loss (default length 10).
Percentile Median: 50th percentile of the last "N" RSI values (default 28 = 4 weeks)
→ dynamic, outlier-resistant centerline.
Standard Deviation Bands: rolling stdev of RSI (default length 27 = = 4 weeks (almost))
→ bands = median ± 1σ / 2σ.
Optional Dynamic MA Envelopes: user-selectable moving average (TEMA, WMA, etc., default WMA length 37) for additional momentum context.
Trend Bias Coloring
Independent of the statistical extremes, the RSI line itself is colored green when above the user-defined Long Threshold (default 60) and red when below the Short Threshold (default 47). This provides an instant bullish/bearish bias overlay similar to classic RSI usage, without interfering with the main 2σ extreme signals.
Extremes are highlighted with background color (green for oversold 2σ + RSI<42, magenta for overbought 2σ) and small diamond markers for ultra-extremes (RSI <25 or >85).
Originality and Development Rationale
The indicator was built and refined through extensive testing on dozens of assets including major cryptocurrencies:
(BTC, ETH, SOL, SUI, BNB, XRP, TRX, DOGE, LINK, PAXG, CVX, HYPE, VIRTUAL and many more),
the Magnificent 7 stocks,, QQQ, SPX, and gold.
Default parameters were chosen to deliver consistent profitability in simple mean-reversion setups while maximizing Sortino ratio and minimizing maximum drawdown across this broad universe — ensuring the settings are robust and not overfitted to any single instrument or timeframe.
How to Use It
Ideal for swing / position trading on the 1h to daily charts (the same defaults work).
Oversold (high-probability long): RSI crosses below lower 2σ band AND RSI < 42
→ green background
→ enter long, exit the first bar the condition disappears.
Overbought (high-probability short): RSI crosses above upper 2σ band
→ magenta background
→ enter short, exit on opposite signal or at median. (Shorts were not tested, it's only an idea)
Use the green/red RSI line coloring for quick trend context and to avoid fighting strong momentum.
Always confirm with price action and manage risk appropriately.
This indicator is not a standalone trading system.
Disclaimer: This is not financial advice. Backtests are based on past results and are not indicative of future performance.

LibTmFrLibrary "LibTmFr"
This is a utility library for handling timeframes and
multi-timeframe (MTF) analysis in Pine Script. It provides a
collection of functions designed to handle common tasks related
to period detection, session alignment, timeframe construction,
and time calculations, forming a foundation for
MTF indicators.
Key Capabilities:
1. **MTF Period Engine:** The library includes functions for
managing higher-timeframe (HTF) periods.
- **Period Detection (`isNewPeriod`):** Detects the first bar
of a given timeframe. It includes custom logic to handle
multi-month and multi-year intervals where
`timeframe.change()` may not be sufficient.
- **Bar Counting (`sinceNewPeriod`):** Counts the number of
bars that have passed in the current HTF period or
returns the final count for a completed historical period.
2. **Automatic Timeframe Selection:** Offers functions for building
a top-down analysis framework:
- **Automatic HTF (`autoHTF`):** Suggests a higher timeframe
(HTF) for broader context based on the current timeframe.
- **Automatic LTF (`autoLTF`):** Suggests an appropriate lower
timeframe (LTF) for granular intra-bar analysis.
3. **Timeframe Manipulation and Comparison:** Includes tools for
working with timeframe strings:
- **Build & Split (`buildTF`, `splitTF`):** Functions to
programmatically construct valid Pine Script timeframe
strings (e.g., "4H") and parse them back into their
numeric and unit components.
- **Comparison (`isHigherTF`, `isActiveTF`, `isLowerTF`):**
A set of functions to check if a given timeframe is
higher, lower, or the same as the script's active timeframe.
- **Multiple Validation (`isMultipleTF`):** Checks if a
higher timeframe is a practical multiple of the current
timeframe. This is based on the assumption that checking
if recent, completed HTF periods contained more than one
bar is a valid proxy for preventing data gaps.
4. **Timestamp Interpolation:** Contains an `interpTimestamp()`
function that calculates an absolute timestamp by
interpolating at a given percentage across a specified
range of bars (e.g., 50% of the way through the last
20 bars), enabling time calculations at a resolution
finer than the chart's native bars.
---
**DISCLAIMER**
This library is provided "AS IS" and for informational and
educational purposes only. It does not constitute financial,
investment, or trading advice.
The author assumes no liability for any errors, inaccuracies,
or omissions in the code. Using this library to build
trading indicators or strategies is entirely at your own risk.
As a developer using this library, you are solely responsible
for the rigorous testing, validation, and performance of any
scripts you create based on these functions. The author shall
not be held liable for any financial losses incurred directly
or indirectly from the use of this library or any scripts
derived from it.
buildTF(quantity, unit)
Builds a Pine Script timeframe string from a numeric quantity and a unit enum.
The resulting string can be used with `request.security()` or `input.timeframe`.
Parameters:
quantity (int) : series int Number to specifie how many `unit` the timeframe spans.
unit (series TFUnit) : series TFUnit The size category for the bars.
Returns: series string A Pine-style timeframe identifier, e.g.
"5S" → 5-seconds bars
"30" → 30-minute bars
"120" → 2-hour bars
"1D" → daily bars
"3M" → 3-month bars
"24M" → 2-year bars
splitTF(tf)
Splits a Pine‑timeframe identifier into numeric quantity and unit (TFUnit).
Parameters:
tf (string) : series string Timeframe string, e.g.
"5S", "30", "120", "1D", "3M", "24M".
Returns:
quantity series int The numeric value of the timeframe (e.g., 15 for "15", 3 for "3M").
unit series TFUnit The unit of the timeframe (e.g., TFUnit.minutes, TFUnit.months).
Notes on strings without a suffix:
• Pure digits are minutes; if divisible by 60, they are treated as hours.
• An "M" suffix is months; if divisible by 12, it is converted to years.
autoHTF(tf)
Picks an appropriate **higher timeframe (HTF)** relative to the selected timeframe.
It steps up along a coarse ladder to produce sensible jumps for top‑down analysis.
Mapping → chosen HTF:
≤ 1 min → 60 (1h) ≈ ×60
≤ 3 min → 180 (3h) ≈ ×60
≤ 5 min → 240 (4h) ≈ ×48
≤ 15 min → D (1 day) ≈ ×26–×32 (regular session 6.5–8 h)
> 15 min → W (1 week) ≈ ×64–×80 for 30m; varies with input
≤ 1 h → W (1 week) ≈ ×32–×40
≤ 4 h → M (1 month) ≈ ×36–×44 (~22 trading days / month)
> 4 h → 3M (3 months) ≈ ×36–×66 (e.g., 12h→×36–×44; 8h→×53–×66)
≤ 1 day → 3M (3 months) ≈ ×60–×66 (~20–22 trading days / month)
> 1 day → 12M (1 year) ≈ ×(252–264)/quantity
≤ 1 week → 12M (1 year) ≈ ×52
> 1 week → 48M (4 years) ≈ ×(208)/quantity
= 1 M → 48M (4 years) ≈ ×48
> 1 M → error ("HTF too big")
any → error ("HTF too big")
Notes:
• Inputs in months or years are restricted: only 1M is allowed; larger months/any years throw.
• Returns a Pine timeframe string usable in `request.security()` and `input.timeframe`.
Parameters:
tf (string) : series string Selected timeframe (e.g., "D", "240", or `timeframe.period`).
Returns: series string Suggested higher timeframe.
autoLTF(tf)
Selects an appropriate **lower timeframe LTF)** for intra‑bar evaluation
based on the selected timeframe. The goal is to keep intra‑bar
loops performant while providing enough granularity.
Mapping → chosen LTF:
≤ 1 min → 1S ≈ ×60
≤ 5 min → 5S ≈ ×60
≤ 15 min → 15S ≈ ×60
≤ 30 min → 30S ≈ ×60
> 30 min → 60S (1m) ≈ ×31–×59 (for 31–59 minute charts)
≤ 1 h → 1 (1m) ≈ ×60
≤ 2 h → 2 (2m) ≈ ×60
≤ 4 h → 5 (5m) ≈ ×48
> 4 h → 15 (15m) ≈ ×24–×48 (e.g., 6h→×24, 8h→×32, 12h→×48)
≤ 1 day → 15 (15m) ≈ ×26–×32 (regular sessions ~6.5–8h)
> 1 day → 60 (60m) ≈ ×(26–32) per day × quantity
≤ 1 week → 60 (60m) ≈ ×32–×40 (≈5 sessions of ~6.5–8h)
> 1 week → 240 (4h) ≈ ×(8–10) per week × quantity
≤ 1 M → 240 (4h) ≈ ×33–×44 (~20–22 sessions × 6.5–8h / 4h)
≤ 3 M → D (1d) ≈ ×(20–22) per month × quantity
> 3 M → W (1w) ≈ ×(4–5) per month × quantity
≤ 1 Y → W (1w) ≈ ×52
> 1 Y → M (1M) ≈ ×12 per year × quantity
Notes:
• Ratios for D/W/M are given as ranges because they depend on
**regular session length** (typically ~6.5–8h, not 24h).
• Returned strings can be used with `request.security()` and `input.timeframe`.
Parameters:
tf (string) : series string Selected timeframe (e.g., "D", "240", or timeframe.period).
Returns: series string Suggested lower TF to use for intra‑bar work.
isNewPeriod(tf, offset)
Returns `true` when a new session-aligned period begins, or on the Nth bar of that period.
Parameters:
tf (string) : series string Target higher timeframe (e.g., "D", "W", "M").
offset (simple int) : simple int 0 → checks for the first bar of the new period.
1+ → checks for the N-th bar of the period.
Returns: series bool `true` if the condition is met.
sinceNewPeriod(tf, offset)
Counts how many bars have passed within a higher timeframe (HTF) period.
For daily, weekly, and monthly resolutions, the period is aligned with the trading session.
Parameters:
tf (string) : series string Target parent timeframe (e.g., "60", "D").
offset (simple int) : simple int 0 → Running count for the current period.
1+ → Finalized count for the Nth most recent *completed* period.
Returns: series int Number of bars.
isHigherTF(tf, main)
Returns `true` when the selected timeframe represents a
higher resolution than the active timeframe.
Parameters:
tf (string) : series string Selected timeframe.
main (bool) : series bool When `true`, the comparison is made against the chart's main timeframe
instead of the script's active timeframe. Optional. Defaults to `false`.
Returns: series bool `true` if `tf` > active TF; otherwise `false`.
isActiveTF(tf, main)
Returns `true` when the selected timeframe represents the
exact resolution of the active timeframe.
Parameters:
tf (string) : series string Selected timeframe.
main (bool) : series bool When `true`, the comparison is made against the chart's main timeframe
instead of the script's active timeframe. Optional. Defaults to `false`.
Returns: series bool `true` if `tf` == active TF; otherwise `false`.
isLowerTF(tf, main)
Returns `true` when the selected timeframe represents a
lower resolution than the active timeframe.
Parameters:
tf (string) : series string Selected timeframe.
main (bool) : series bool When `true`, the comparison is made against the chart's main timeframe
instead of the script's active timeframe. Optional. Defaults to `false`.
Returns: series bool `true` if `tf` < active TF; otherwise `false`.
isMultipleTF(tf)
Returns `true` if the selected timeframe (`tf`) is a practical multiple
of the active skript's timeframe. It verifies this by checking if `tf` is a higher timeframe
that has consistently contained more than one bar of the skript's timeframe in recent periods.
The period detection is session-aware.
Parameters:
tf (string) : series string The higher timeframe to check.
Returns: series bool `true` if `tf` is a practical multiple; otherwise `false`.
interpTimestamp(offStart, offEnd, pct)
Calculates a precise absolute timestamp by interpolating within a bar range based on a percentage.
This version works with RELATIVE bar offsets from the current bar.
Parameters:
offStart (int) : series int The relative offset of the starting bar (e.g., 10 for 10 bars ago).
offEnd (int) : series int The relative offset of the ending bar (e.g., 1 for 1 bar ago). Must be <= offStart.
pct (float) : series float The percentage of the bar range to measure (e.g., 50.5 for 50.5%).
Values are clamped to the range.
Returns: series int The calculated, interpolated absolute Unix timestamp in milliseconds.
