Derivative Oscillator Cu [ID: AC-P]The "AC-P" version of the Derivative Oscillator is my personal customized version of Constance Brown's Derivative Oscillator (using Everget's implementation of it as the base), with the the following modifications and additions:
VWAP Indication - option to show whether the price input option is above or below the Daily VWAP (red triangles = price input is below vwap, green triangles = price input is above vwap)
Bullish and Bearish phases from shayankm's Waddah Attar Explosion V2 () is included as indication dots (bullish = blue dots, bearish = yellow dots) below/above the Derivative Oscillator histogram
Coral Trend from Lazybear () is included as indication dots (red/green dots below/above the Derivative Oscillator histogram
Input source options for vwap, Waddah components (MACD, Bollinger Upper/Lower)
Centerline option for Coral trend, and Horizontal center option for the Derivative Oscillator with circle indication (optional - provided as option for flexibility in use with overlaying with other indicators)
This indicator is a hybrid, with a combination of leading indicators and lagging trending indicators combined into one. Specifically, a few of the other indicators I use are lacking in the momentum and trend department, and this is one of the indicators I use to address that:
VWAP provides trend information on lower timeframes from a high timeframe interval (D)
Coral Trend provides additional confirmation to VWAP trend wise, and is adjustable
Waddah Attar Explosion provides a third level of confirmation for trending moves, taking into account shorter and longer timeframes (FastEMA and SlowEMA parameters).
Script base for the Derivative Oscillator is credited to Everget () and LazyBear ().
Source attribution to Constance Brown for the Derivative Oscillator formula/indicator:
// Brown, Constance.
// Reference 1: “The Derivative Oscillator: a New Approach to an Old Problem,” Journal of Technical Analysis (Winter-Spring 1994) 45–61.
// Reference 2: Technical Analysis for the Trading Professional. New York, NY: McGraw-Hill, 1999.
Information on the Derivative Oscillator:
www.investopedia.com
Komut dosyalarını "沪深主板45度上升的股票" için ara

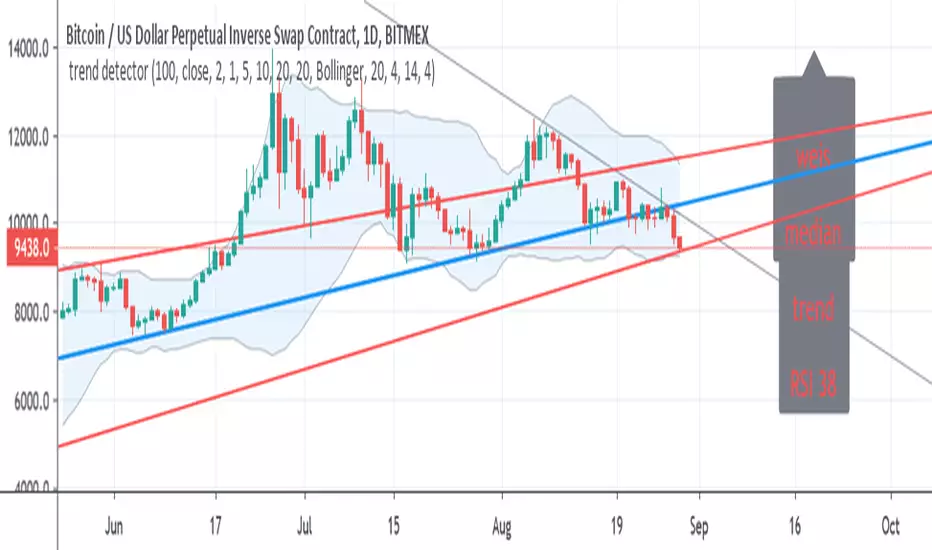
trend detectorThis is just template to build up better indicator on it
So in basic we have modified trend SMA which is fast length 10 to detect fast changes
then we weis volume (done by lazy bear)
Bollinger channel with my addition of trend lines
the median is based on basis line of the channel
so good long entry spot are when trend is positive , weis positive and rsi bellow 45 and the candles bellow median
good exit is opposite
one can can add more indicators to make it better
so I just put this together since in my trading I use this indicators allot
Delta Volume Columns [LucF]Displays delta volume columns using intrabar volume information. Each volume column is divided into three sections: buying, selling and neutral volume. Volume for each section is determined from the volume and price movement of each intrabar at a user-selected lower resolution.
Features include:
- Choice of color themes for either dark or light chart backgrounds
- Delta volume columns
- Volume Balance displayed as the difference between the MAs of buying and selling volume
- Display of divergences between a bar’s volume balance and the bar’s price movement (example: buying volume > selling volume but close < open). Divergences can be shown in 2 different color schemes (including green/red showing a tentative direction), on volume columns and/or on chart bars
- Display of bar by bar volume balance with highlighting of above average volume
- Display of the usual total volume MA
- Choice of the lower resolution used to retrieve intrabar information
- Alerts configurable on any combination of the markers, with control over long/short direction
- Choice of 3 different markers:
1. Double bumps: two consecutive bars where buying or selling volume is in the same direction and where volume > volume MA
2. Divergence confirmations: direction of the price bar following a price/volume balance divergence
3. Volume balance shifts: zero level crossings of the volume balance MA delta
The chart shows the two main modes of display:
- Top pane : shows the stacked volume columns with divergences in orange and the flattened volume balance MAs delta at the bottom of the volume columns. This volume balance is the same shown in the bottom pane. The top pane also shows the instant volume balance strip above the volume columns. The strip’s colors show which of the buying or selling volume was greater, and colors are brighter if the total volume was above the total volume MA.
- Bottom pane : shows the volume balance MAs delta with markers 1 and 2. Given that this graphic has no price momentum component, I find quite eerie how it often looks like a momentum-based signal.
The default 5 minute intrabar resolution is used in combination with the weekly chart, which is excessive.
This script uses a special characteristic of the security() function’s behavior when it is sent to a resolution lower than the chart’s resolution. Details are given in the script’s comments. This method has the advantage of working under more circumstances than some of the other loop-based methods, but it also has its limits.
IMPORTANT
This is what you need to know:
- The method used does not work on the realtime bar—only on historical bars. Consequently, the volume column shown on the realtime bar is a normal volume column plotted in green or red, following price movement. The column will only show delta volume information after it closes and becomes a historical bar.
- The indicator only works on some chart resolutions: 5, 10, 15 and 30 minutes, 1, 2, 4, 6, and 12 hours, 1 day, 1 week and 1 month. The script’s code can be modified to run on other resolutions, but chart resolutions must be divisible by the lower resolution used for intrabars.
- Intrabar resolutions can be selected from 1, 5, 15, 30, 45 minutes, 1, 2, 3, 4 hours, 1 day, 1 week and 1 month. The intrabar resolution must of course be smaller than the chart’s resolution.
- Contrary to my other indicators where alerts must be configured to trigger “Once Per Bar Close” in order to avoid false triggers (or repainting), all this indicator’s alerts are designed to trigger using previous bar information since the indicator’s calculations in the realtime bar are not exact. Markers are not plotted with a negative offset; they appear at the beginning of the realtime bar following confirmation of the marker’s condition on the previous bar. Alerts for this indicator should thus be configured to trigger “Once Per Bar” so they trigger at the beginning of the realtime bar. Note that the penalty is not that great, as it is simply the instant between the close of the previous realtime bar and the opening of the next. The advantage of using this technique is that the indicator does not repaint; a marker that appears at the beginning of the realtime bar will never disappear.
- The script only plots information that is reliable in the realtime bar, i.e., total volume and markers. All other plots are set to n/a to prevent misleading traders.
- When the difference between the chart’s resolution and the lower resolution is too important, volume columns will not calculate for all bars in the dataset.
On Delta Volume
Buying or selling volume are misnomers, as every unit of volume transacted is both bought and sold by 2 different traders. There is no such thing as “buy only” or “sell only” volume, but trader lingo is riddled with original fabulations.
Without access to order book information, traders work with the assumption that when price moves up during a bar, there was more buying pressure than selling pressure. The built-in volume indicator available on TradingView uses this logic to color the volume columns green or red. While this script’s numbers are more precise because it analyses a number of intrabars to calculate its information, it uses the exact same imperfect logic to calculate its buying/selling/neutral sections.
Until Pine scripts can have access to how much volume was transacted at the bid/ask prices, our so-called buying/selling volume information will always be a mere proxy.
Divergences
You may wonder how there can be divergences between buying/selling volume information and price movement. This will sometimes be due to the methodology’s shortcomings we have just discussed, but divergences may also occur in instances where because of order book structure, it takes less volume to increase the price of an asset than it takes to decrease it.
As usual, divergences are points of interest because they reveal imbalances, which may or may not become turning points. I do not share the overwhelming enthusiasm traders have for divergences. To your pattern-hungry brain, the orange bars this indicator shows on chart will—as divergences on other indicators do–appear to often indicate turnarounds. My opinion is that reality is generally quite sobering, as many who have tried building automated rules based on divergences will tell you. I do not have hard numbers on the lack of performance of divergences—only many failed attempts to make them perform, which a few experienced strategy modelers I know share with me. Please don’t try to read too much into them. While they look great on past data, I find they are often difficult to use in realtime to make bets with good odds.
Thanks to:
- A guy called Kuan who commented on a Backtest Rookies presentation of an intrabar delta volume indicator using a for loop. The heart of “my” indicator is code borrowed from Kuan; I just built a hopefully useful wrapper around it.
- @theheirophant, my partner in the exploration of the sometimes weird abysses of security() ’s behavior at lower resolutions.


QuantNomad - RSI Strategy - NKE - 5mReally good performance of Simple RSI Strategy for Nike (NKE) 5m chart.
Params: RSI Length: 30, RSI OverSold level: 45, RSI OverBought Level: 60
Performance:57% profit, 112 trades, 73% prof, 6.7% dd, 1.36 sharpe.
And remember:
Past performance does not guarantee future results.

rsi sma/ema cuCustom RSI with SMA 9, EMA 45 and Bull/Bear Control Zones from Krown and Constance Brown.

EMA 9/45/90/180/270/360 ReversalsHey!
This is a 6EMA crossover script, to make a whole trend and S/R analysis in a second ;)
Hope you like it! Leave a like pls :)
Zero Phase Filtering [Repaint] - ExperimentalImportant !
The indicator is for experimental purpose only, it must not be used as a decisional tool but only as a visual one (like Zig-Zag, Fractal etc). The information this indicator display is uncertain and subject to drastic changes over time. If you have further question feel free to pm me.
Introduction
Most of the filters you will find are causal, this mean that they depend on present and past input values, this explain the lag they produce. Non causal filters however will use future input values. A well know way to get a zero-phase filter is by using the forward backward method, but this is not possible in pinescript as i recall. So we have to use some kind of function that will display future values, this is possible using the security function in version 2 or the one in version 3 using barmerge.lookahead_on .
The Use Of A Repainting Indicator
Its always better to filter data in order to have a clearer view of what is happening, this can be useful when doing some forecasting or doing less formal kind of analysis. However since it repaint you cant use it as a signal provider or use signals of other indicators using this filter as source.
For example if you want to forecast a smooth indicator, the forecast of this indicator under normal circumstances could still have lag associated with it, so you would have to react before your forecast, this wont happen if you apply this filter as your indicator source.
The Filter
We smooth with a simple moving average the price provided by the security function twice, length control the smoothing level. Since security depend on the time frame you are in you must select your time frame in the indicator parameter selection window.
Filtering using 45 minutes time frame close price in a 5 minutes chart, we fix this by selecting our time frame.
Consider the fact that the input of the indicator is just periodic price, so sometimes the lag can sometimes be less or more than 0 and the estimation not centered.
The indicator can work on time frames up to 1h, after that the filter have some lag, i tried fixing this and i ended up having data errors.
Applying our filter as source for the rsi oscillator.
Conclusion
It is possible to have a kind of zero-phase filters, but it would be better if pinescript could support backward indexing thus making us able to do forward backward filtering.
Since noise can affect our analysis, applying smoothing without having to use offset in plot can be considered useful.

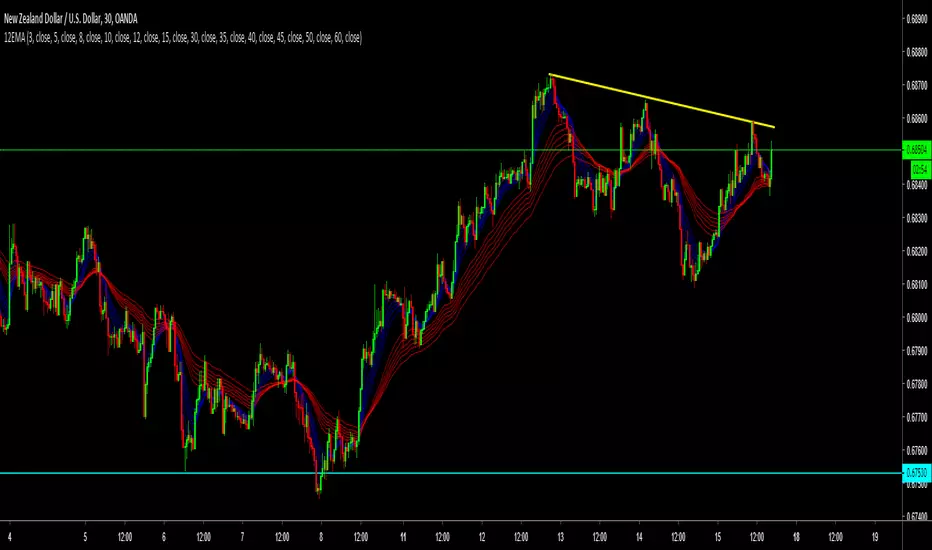
12 Exponential Moving AveragesThe Guppy Multiple Moving Average (GMMA). The short-term MAs are typically set at 3, 5, 8, 10, 12, and 15 periods. The longer-term MAs are typically set at 30, 35, 40, 45, 50, and 60.

12 Exponential Moving Averages Guppy The Guppy Multiple Moving Average (GMMA). The short-term MAs are typically set at 3, 5, 8, 10, 12, and 15 periods. The longer-term MAs are typically set at 30, 35, 40, 45, 50, and 60.
APEX - WaveTrend [v1]WaveTrend is a smoothed oscillator which enables it to detect true reversals in an extremely accurate manner. The beauty of this indicator is that does not generate signals during choppy sideways markets.
The basic settings are 10 / 3 / 4 these are very aggressive settings, that will generate a lot of signals in all even not so volatile markets. If you need high-quality signals you settings close to 10 / 3 /21. The strongest buy/sell signals are given when the cross occurs above or below the threshold. In the 10 / 3 / 4 you threshold for buy should be around -90 values. If you use the very smoothed variant the threshold will be around -45 to -50 values.
This indicator will be first available in APEX v1 currently being beta tested.

Divergences for many indicators v2.0A gift from me to all.
This script is developed to find Divergences for many indicators. it analyses divergences and then draws line on the graph. red for negatif, lime for positive divergences.
Currently script checks divergence for RSI, MACD, MACD Histogram, Stochastic, CCI, Momentum, OBV, Diosc, VWMACD and CMF indicators. You can use some or all of these indicators to check divergences as you wish by choosing them on the menu. Also you can add/remove many other indicators to the script to check if there is divergence.
The script first calculates tops/bottoms by using higher time frame zig zag and then finds divergences.
Higher Time Frames are
if currend period 1 min => HTF = 5 mins
if currend period 3 mins => HTF = 15 mins
if currend period 5 mins => HTF = 15 mins
if currend period 15 mins => HTF = 1 hour
if currend period 30 mins => HTF = 1 hour
if currend period 45 mins => HTF = 1 hour
if currend period 1 hour => HTF = 4 hours
if currend period 2 hours => HTF = 4 hours
if currend period 3 hours => HTF = 4 hours
if currend period 4 hours => HTF = 1 day
if currend period 1 day => HTF = 1 week
if currend period 1 week => HTF = 1 week
future plan : script finds regular divergences, soon I will add hidden divergences and also I plan to add alert ;)


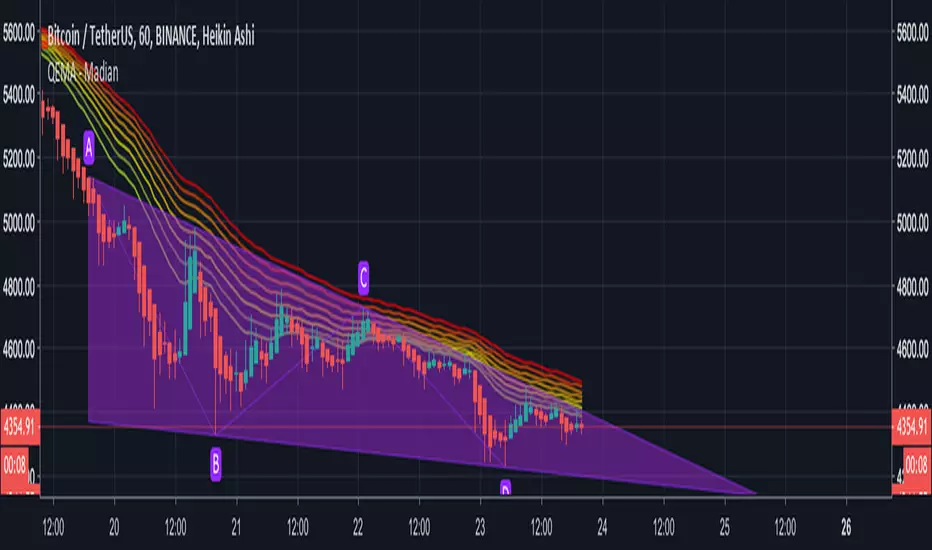
QEMA - 8 Exponential Moving Averages (20 - 55) / MadianQEMA - 8 Exponential Moving Averages (20, 25, 30, 35, 40, 45, 50, 55)
This QEMA act as support and resistance .
Derivative OscillatorThis indicator was originally developed by Constance (Connie) M. Brown (Journal of Technical Analysis (Winter-Spring 1994, 45-61): "Derivative Oscillator: A New Approach to an Old Problem").

TRI MA DominoBlue lines are first group (3,5,8,13,21) SMA and red lines are second group (35,40,45,50,55) SMA. When blue lines cross above red lines that signals bull market and vice versa. More lines we have above or bellow (creating domino effect) the stronger the signal for bull/bear.
This indicator should be used to determine where are we currently in the market and should we expect trend change/transition or continuation.
It should not be used as sole indicator for taking trades but as a tool to help you with TA and your trading plan.
Good hunting ;)

RSI / Stoch / SRSI / MFI / Aroon Overlay [SigmaDraconis]Combines 4 popular indicators (RSI, Stoch, SRSI, MFI) and 1 peculiar one (Aroon) in 1 for those who want to save indicators but not only.
This is an evolution of my (simpler) "RSI / Stoch / Stoch RSI (SRSI) Overlay " that you can find on my scripts.
Added bands for oversold/overbought areas (70/30 common for RSI and 80/20 for SRSI and MFI), as well as a middle 50 horizontal line.
Neutral bands around 55-45 added as well that can be hidden for less clutter. I also recommend a more transparent coloring for these since Pine script doesn't allow default transparency for horizontal lines.
By default only RSI and Stoch are activated, you can activate Aroon, MFI and SRSI on the inputs window.
Some extra notes:
* RSI, Stoch and MFI can help to strengthen one's decision as well as Aroon to predict a possible trend reversal, SRSI can show when RSI has high probability of being topped or bottomed when oversold/overbought but don't forget to look at volume and how the trend progresses that can keep SRSI above 80 or below 20 while RSI and price continues to trend, divergences are most helpful here to find possible reversal areas.
* This chart depicts some interesting divergences, as well as Stoch tops and bottoms and confluences between RSI/MFI and Stoch on some over-extended tops and bottoms that shown being good reversal zones.
RSI resistances are shown as well, failing to break above 60 or the neutral zone (this is a bearish BTC trend chart after all) or failing to gain support to break up certain levels (RSI notes a more bullish trend when consistently above 60 and more bearish below 40).
If you like it and use it to profit, please tip me below :)
Tip jars:
BTC: 15nMBiEGVrdGcu9C1h6QRcTNRvugHkqrMQ
ETH: 0xC33845946c48B61fBCbEA0367ec2238CaF2b73bc
BTS: sigma-draconis

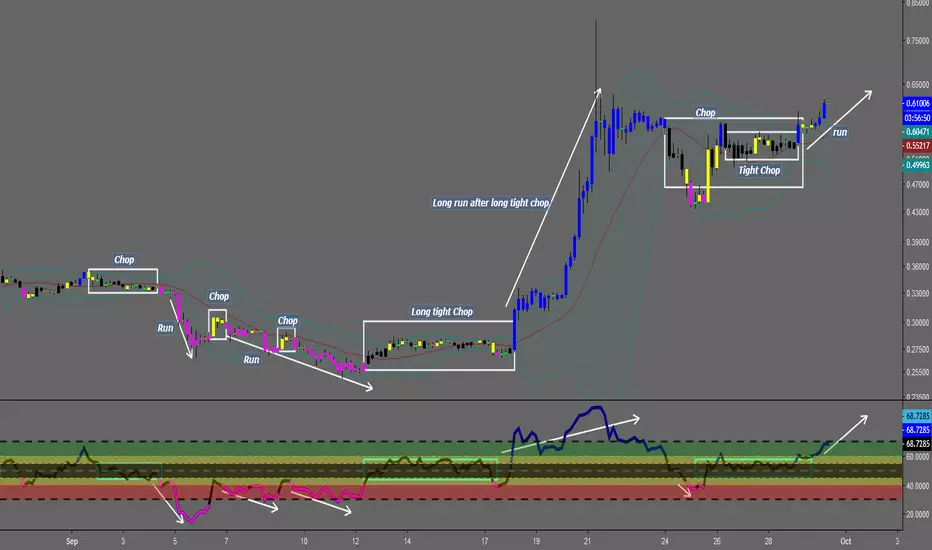
Chop and explodeThe purpose of this script is to decipher chop zones from runs/movement/explosion
The chop is RSI movement between 40 and 60
tight chop is RSI movement between 45 and 55. There should be an explosion after RSI breaks through 60 (long) or 40 (short). Tight chop bars are colored black, a series of black bars is tight consolidation and should explode imminently. The longer the chop the longer the explosion will go for. tighter the better.
Loose chop (whip saw/yellow bars) will range between 40 and 60.
the move begins with blue bars for long and purple bars for short.
Couple it with your trading system to help stay out of chop and enter when there is movement. Use with "Simple Trender."
Best of luck in all you do. Get money.
AlexInc's Bar v1.2Публикую новую версию моего скрипта для BTCUSD . Работает для таймфреймов 45 мин, 1 ч, 2 ч. Отличается от предыдущей, что для сигнала BarColor используются только значимые свечи, т.е. те, у которых длина больше условного значения. Считаю, это сделает стратегию более гладкой.
Now I publish new version of my BTCUSD strategy script. It works for 45m, 1h, 2h timeframes. It differs from previous by way of ckeching BarColor signal. Now strategy uses only meanful bars. That means that their height must be greater than some evaluated value. I think this change will make strategy more smooth.

My Ichimoku indicator & Strategyhello I'm a beginner in trading, but I try to learn how to code strategies.
I recoded the Ichimoku indicator, and created my personnal strategy based on it.
The backtesting is done from 1/1/2017 to today in 45 min Time Unit for candles, with a 1 000 € equity.
The trades are all Long Entries and Exits with no pyramiding, no short trades at all.
/!\ Exchanges commission fees are not calculated and can in reality easily divide by 2 the total profit (am I right guys?) /!\
A buy signal is triggered upon these conditions:
- close is above the Kuma (cloud)
AND
- close crosses over Kijunsen AND Kijunsen is not flat (calculated with rising and falling with input "Kijunsen Lag")
OR
- Close crosses over ChikouSpan AND there was a sell signal in the last 8 candles
Sell signal is the same but reversed.
I appreciate your feedback ! Maybe I will update this later if I get better results.

XPloRR MA-Buy ATR-Trailing-Stop Long Term Strategy Beating B&HXPloRR MA-Buy ATR-MA-Trailing-Stop Strategy
Long term MA Trailing Stop strategy to beat Buy&Hold strategy
None of the strategies that I tested can beat the long term Buy&Hold strategy. That's the reason why I wrote this strategy.
Purpose: beat Buy&Hold strategy with around 10 trades. 100% capitalize sold trade into new trade.
My buy strategy is triggered by the EMA(blue) crossing over the SMA curve(orange).
My sell strategy is triggered by another EMA(lime) of the close value crossing the trailing stop(green) value.
The trailing stop value(green) is set to a multiple of the ATR(15) value.
ATR(15) is the SMA(15) value of the difference between high and low values.
Every stock has it's own "DNA", so first thing to do is find the right parameters to get the best strategy values voor EMA, SMA and Trailing Stop.
Then keep using these parameter for future buy/sell signals only for that particular stock.
Do the same for other stocks.
Here are the parameters:
Exponential MA: buy trigger when crossing over the SMA value (use values between 11-50)
Simple MA: buy trigger when EMA crosses over the SMA value (use values between 20 and 200)
Stop EMA: sell trigger when Stop EMA of close value crosses under the trailing stop value (use values between 8 and 16)
Trailing Stop #ATR: defines the trailing stop value as a multiple of the ATR(15) value
Example parameters for different stocks (Start capital: 1000, Order=100% of equity, Period 1/1/2005 to now):
BAR(Barco): EMA=11, SMA=82, StopEMA=12, Stop#ATR=9
Buy&HoldProfit: 45.82%, NetProfit: 294.7%, #Trades:8, %Profit:62.5%, ProfitFactor: 12.539
AAPL(Apple): EMA=12, SMA=45, StopEMA=12, Stop#ATR=6
Buy&HoldProfit: 2925.86%, NetProfit: 4035.92%, #Trades:10, %Profit:60%, ProfitFactor: 6.36
BEKB(Bekaert): EMA=12, SMA=42, StopEMA=12, Stop#ATR=7
Buy&HoldProfit: 81.11%, NetProfit: 521.37%, #Trades:10, %Profit:60%, ProfitFactor: 2.617
SOLB(Solvay): EMA=12, SMA=63, StopEMA=11, Stop#ATR=8
Buy&HoldProfit: 43.61%, NetProfit: 151.4%, #Trades:8, %Profit:75%, ProfitFactor: 3.794
PHIA(Philips): EMA=11, SMA=80, StopEMA=8, Stop#ATR=10
Buy&HoldProfit: 56.79%, NetProfit: 198.46%, #Trades:6, %Profit:83.33%, ProfitFactor: 23.07
I am very curious to see the parameters for your stocks and please make suggestions to improve this strategy.

Reversal Candlestick Pattern With Trend IndentifierThis script help to identified popular candlestick pattern combined with trend identifier.
Most script only focus on criteria of the pattern. Such as how much the length of the body compared to previous candle etc.
Besides criteria of the candle, this script also considered the trend into the logic.
For example bullish engulfing is a bullish reversal signal, which is only valid in a down trend.
To identified trend, I'm using RSI. Normally, RSI less than 50 is considered a down trend, and RSI greater than 50 is considered up trend. In this script, you can customize the criteria of how much RSI is up trend and down trend.
Default value RSI >= 55 is up trend, RSI <= 45 is down trend.
Your feedback and suggestion is welcome.
Supported pattern:
White Marubozu (wm)
Black Marubozu (bm)
Hammer (h)
Hanging Man (hm)
Inverted Hammer (ih)
Shooting Star (ss)
Bullish Engulfing (e)
Bearish Engulfing (e)
Tweezer Bottom (tb)
Tweezer Top (tt)
Three White Soldiers (tws)
Three Black Crows (tbc)
Morning Star (ms)
Evening Star (es)
Three Inside Up (tiu)
Three Inside Down (tid)
Reference:
babypips.com