Tick Profile HeatmapThis is a market internal TICK heatmap with the intent of displaying areas of price associated to stronger reactions with NYSE TICK (by default).
This code is based off of a variation of a Volume Profile coded originally by colejustice who originally used code from LuxAlgo . The full-width volume bars that colejustice setup were replaced with full-width bars representative of TICK breaking +/- $500, the current cumulative value representing the "heat" is comprised of hlc3 by default but that can be changed. In a future update I may add additional logic here to capture highs and lows in the heatmap specifically, and perhaps additional colors.
As with other traditional profiling studies, this indicators purpose is to visualize correspondence to specific price levels, allowing rapid assessment where the most TICK activity is occurring, and where it hasn't been. This information may provide areas of support and resistance and regions where price may move quickly repeatedly.
All of the same input guidance that colejustice provided is the same for those pre-existing inputs:
Inputs are set up such that you can customize the lookback period, number of rows, and width of rows for most major timeframes individually. Timeframes between those available will use the next lower timeframe settings (e.g., 2m chart will use the 1m settings.)
Zero usage of volume is present in this indicator, only TICK data so please don't confuse it with volume studies.
"文华财经tick价格" için komut dosyalarını ara

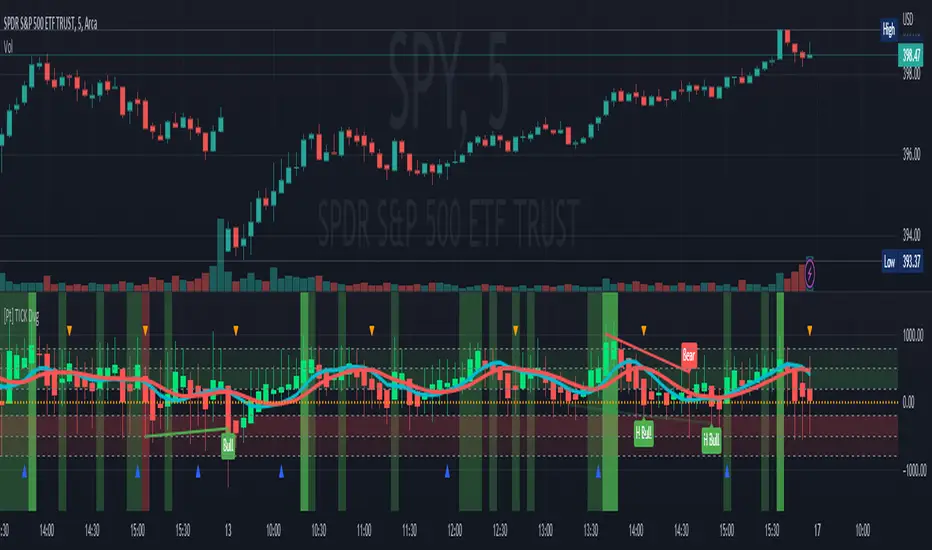
TICK Divergence + Heikin Ashi [Pt]This indicator identifies divergence between NYSE TICK and price, displays TICK in line, bar, or Heikin Ashi format, calculates various types of moving average lines and shows moving average crossovers.
What is TICK
NYSE TICK, also known as the TICK index, is a technical analysis indicator that shows the number of stocks on the New York Stock Exchange (NYSE) that are trading on an uptick or a downtick in a particular period of time. The TICK index is calculated by subtracting the number of stocks trading on a downtick from the number of stocks trading on an uptick. A reading of +1000 on the TICK index, for example, would indicate that there are 1000 more stocks trading on an uptick than on a downtick. The TICK index is often used as a measure of market sentiment, as it can provide insight into whether there is more buying or selling pressure in the market at a given time. A high TICK index reading may suggest that there is strong buying pressure, while a low TICK index reading may indicate that there is more selling pressure in the market.
The TICK index is usually very volatile, so this indicator is best suited for lower timeframes, such as 1 to 5 min charts.
Features
1) Shows bullish, bearish, hidden bullish and hidden bearish divergences
2) Three display modes for TICK data: Line, Bar, Heikin-Ashi
3) Plot various moving average lines and crossovers. Overall background
4) Configurable significant zones. Background colors will change based on closing TICK value.
Tick Renko Chart - Percent BasedA Renko Tick chart based on continuously adjusting percentage.
Live Renko bricks formed by tick data
Adjustable brick width
Outline mode, or line mode for more bricks
Scalp with a Renko, get weird.
The settings can and will break the script if you turn them up too high. Turning off outline mode will not look as nice, but can potentially allow for a larger number of bricks.

Tick Tick BoomThis is THE tick tick boom method from the GOLD MINDS group!
When we enter a trade the line changes color.
If your charts are not in UTC time then you can adjust the UTC offset time. If your charts are in UTC-9 then set this to 9, if you are in UTC+1 set this to -1, if your charts are un UTC then set this to 0.
I noticed daily pivots, support, and resistance levels are pretty useful targets here. Uncheck the box if you would like to see the levels.
Many thanks to Dimitri Wallace!


TICK IndicatorThis indicator is meant for primarily day trading. This indicator displays TICK in an easy to follow format and becomes more visible when there is a strong move in either direction
TICK Extremes IndicatorSimple TICK indicator, plots candles and HL2 line
Conditional green/red coloring for highs above 500, 900 and lows above 0, and for lows below -500, -900, and highs above 0
Probably best used for 1 - 5 min timeframes
Always open to suggestions if criteria needs tweaking or if something else would make it more useful or user-friendly!

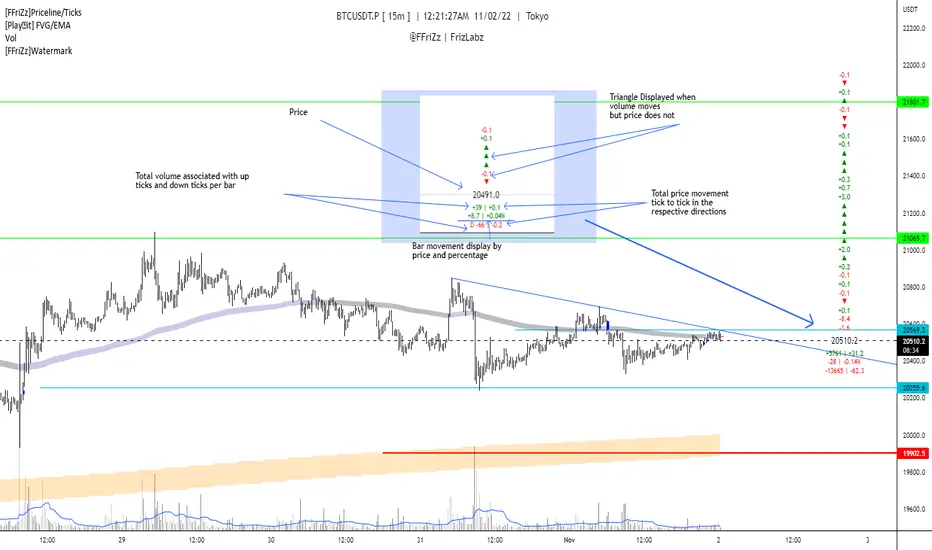
[FFriZz]Priceline/TicksFFriZz | FrizLabz -- Priceline/Ticks
Due to TradingView not allowing us to change the size or style of the Priceline I decided to make this
You can change the style, size, color of the Price line with this Script
There is also an option for the closing price to be plotted on the Priceline
-- Colors --
You can have the Line and/or the Closing price change colors with the price movements
both are adjustable to your preference
-- Ticks --
Will show the difference in price from tick to tick
when Volume moves but price doesn't it will show '▲▼'
-- Adjustments --
The offset of the Close and Ticks can be adjusted from left to right
Can Extend Priceline in all directions
Can change the Line style and Width
Can change all the Text sizes and Colors
Can also Change Colors to change with Price movements
Can Change number of Ticks to show
-- Priceline --
You don't have to but I suggest going to the settings of your Chart and turning off the Priceline
-- Challenge --
There is Some code at the bottom that will move the Label and Ticks to the x% of your screen in from the right once
the last bar is no longer visible. I decided not to use it because even when the feature is turned off any movement of the
chart resets the Ticks. If you find out a way to have it not reset the Ticks Let me know!
If you find any bugs or have any suggestions feel free to DM me or leave a comment!
Hope you Enjoy! -- FFriZz | FrizLabz
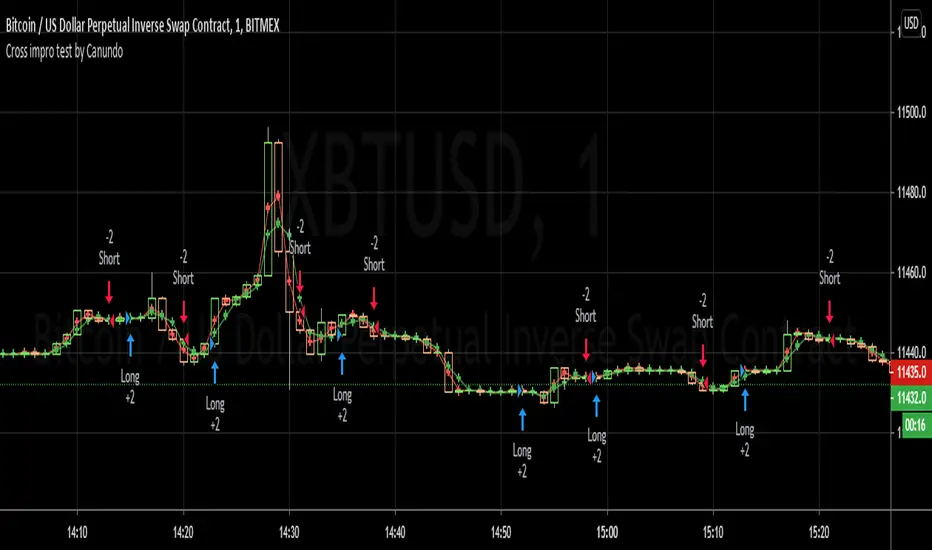
Cross impro test by Canundo Crossover Crossunder Tick valuesThis is a script where I tried to check the following things:
Even thought the tick of an asset is, for example 0.5, there are calculated prices, like SMA's that have even more decimals. Leading to crosses happening that for example happen at the same price. Consequently triggering totally useless in side markets. What happens if SMA values are restricted to the tick resolution? (Option works on it's own or with a combination of the others.)
What happens if I set my own tick value, like 0.8 instead of 0.5, what will be the effect for calculated values that are used for crossings? Will tick sizes improve the success rate? (This option will work only when the first option is active.)
Can success rate, especially for sideway markets be improved when adding a spread between MA's, so that it triggers less in sideway markets? (Option works on it's own or with a combination of the others.)
First of all, I had a hard time to round prices properly when it needs to be dynamic and working for different assets with different amounts of decimal values in the tick. The solution is that abs(floor(syminfo.mintick)) will give you the amount of decimals a tick has. It works for all ticks that are at least lower than 10. I'm not sure how huge ticks are out there. I did not implement this solution at the end since I found another way to test it.
Findings:
The first option, when activated, takes out half the trades and raises the percent profitability by 8% so there is some effect. However, all of the tested options have less advantage than I hoped for but are nevertheless something worthy for sideway markets. The first option just forces the MA's from the example to use the tick resolution.
See these two images. One when the first option is off, the second when it's active.
The lines are the MA's with adjusted values, the crosses are the places of the MA's when left as is.
Here a screenshot of the third option set to the value 2 on the 1 minute XBTUSD chart.
The advantage is that less trades trigger that have a low change in price and so less trading fees will happen.
The disadvantage is that all options can implement some delay for a crossing since the crossing will trigger once a slightly bigger move into the direction was taken.
This test environment was not meant to be profitable but to test the effects.
Maybe someone finds it interesting or wanted to test the same, so here you can save some work.
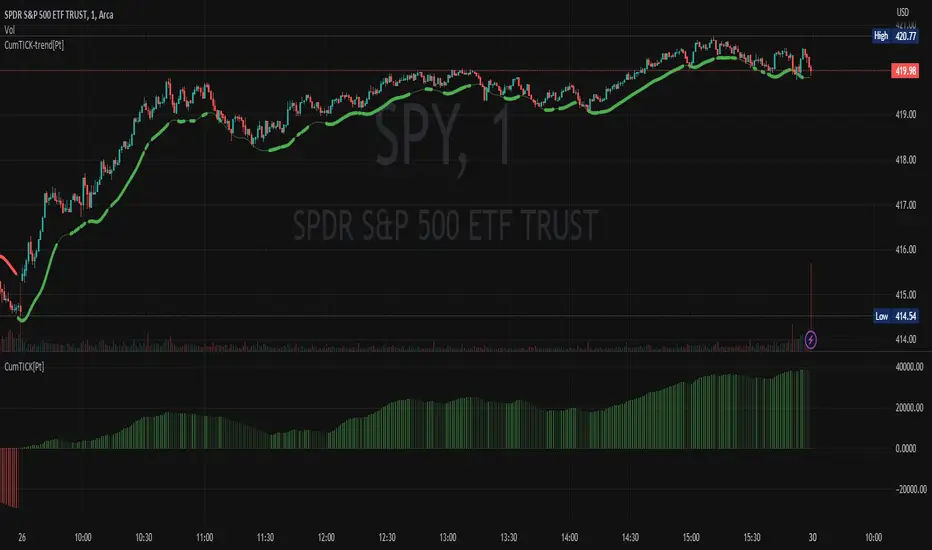
Cumulative TICK [Pt]Cumulative TICK Indicator, shown as the bottom indicator, is a robust tool designed to provide traders with insights into market trends using TICK data. This indicator visualizes the cumulative TICK trend in the form of colored columns on a separate chart below the main price chart.
Here's an overview of the key features of the Cumulative TICK Indicator:
1. Selectable TICK Source 🔄: The indicator allows users to choose from four different TICK data sources, namely USI:TICK , USI:TICKQ , USI:TICKI , and $USI:TICKA.
2. TICK Data Type Selection 🎚️: Users can select the type of TICK data to be used. The options include: Close, Open, hl2, ohlc4, hlc3.
3. Optional Simple Moving Average (SMA) 📊: The indicator offers an option to apply an SMA to the Cumulative TICK values, with a customizable length.
4. After-hour Background Color 🌙: The background color changes during after-hours to provide a clear distinction between regular and after-hour trading sessions.
🛠️ How it Works:
The Cumulative TICK Indicator uses TICK data accumulated during the regular market hours (9:30-16:00) as per the New York time zone. At the start of a new session or at the end of the regular session, this cumulative TICK value is reset.
The calculated Cumulative TICK is plotted in a column-style graph. If the SMA is applied, the SMA values are used for the column plots instead. The columns are colored green when the Cumulative TICK is positive and red when it is negative. The shades of green and red vary based on whether the Cumulative TICK is increasing or decreasing compared to the previous value.
This is a simple yet powerful tool to track market sentiment throughout the day using TICK data. Please note that this indicator is intended to be used as part of a comprehensive trading strategy. Always ensure you are managing risk appropriately and consulting various data sources to make informed trading decisions.
Tick StatisticsTick Statistics:
I have seen many questions/queries related to tick data in TV telegram channels. This script will help pine scripts to understand how ticks work, how to capture and process tick data.
This is an educational indicator script for pine scripters.
The indicator shall work only on real time candles. Tick data capture is initiated as soon as indicator is loaded on the chart. You might not get correct statistics on 1st candle in case indicator is loaded when real time candle is in progress, in such case you can monitor the statistics generated for subsequent candles.
Generated statistics is shown on the chart by placing 2 diamond shapes above and below the candle.
Diamond shape below the candle will have candles ‘tick data’ listed in a table. This can be view by placing mouse pointer on the diamond shape. Refer to point 1 below for more details.
Diamond shape above the candle will have statistics as mentioned in point no 2 onwards. To view the statistics place the mouse point on the diamond shape. The shape will appear in green color when both tick price and tick volume are both moving in the same direction. The diamond shape in red color means tick price and tick volume are moving in opposite direction.
The script captures tick by tick data and generate statistics below:
1. List of tick data with details below: (this is stored in the diamond shape placed below the candle)
a. Tick no
b. Tick type – Up tick (Up), Down tick (Dn), No change (--)
c. Tick price
d. Volume
e. Price difference (as compared to previous tick price)
f. Volume difference (as compared to previous tick volume)
2. Tick statistics
a. Total ticks
b. Number of up ticks
c. Number of down ticks
d. Number of No change ticks
3. Volume Statistics
a. Total volume
b. Up tick volume
c. Down tick volume
d. Volume associated with ticks where there is no change
e. Candle volume (just for reconciliation purpose)
4. Max-min statistics
a. Max volume = <> at price = <> at tick no = <>
b. Min volume = <> at price = <> at tick no = <>
c. Max price = <> at volume = <> at tick no = <>
d. Min price = <> at volume = <> at tick no = <>
5. Candle summary
a. Price << Up >> (if price is up as compared to 1st tick <> otherwise
b. Volume <> (if up tick volume is more than down tick volume <> otherwise

NYSE TickThe NYSE Tick indicator is a market breadth indicator used to determine short-term bullish or bearish market sentiment. The NYSE Tick index compares the number of stocks on the New York Stock Exchange that are ticking up to the number of stocks ticking down at a specific moment in time. When the NYSE Tick is hovering around the zero line, roughly the same number of stocks are ticking up as are ticking down. When the overall market is rising it will usually present on the NYSE Tick as a rise in value that will generally stay mostly above the zero line for a period of time. The opposite is true when the general market is falling and can be seen as the NYSE Tick staying mostly below the zero line. This information can be very helpful for a short-term day trader who trades a market that also follows many of these same stocks, like the E-Mini S&P 500 Futures (ES), for example. While the index can theoretically rise or fall to over ±2,000 if all stocks on the NYSE are ticking up or down at the same time, it’s generally considered an extreme movement if the NYSE Tick is ±1,000. For this reason, the indicator has default reference lines at ±1,000 and halfway marks at ±500. In order to partially smooth out the movement and make movement trends more easily read, the indicator plots the values using Heikin Ashi candles instead of the standard bars or candlesticks. The price-line value displayed is an accurate live value, however, rather than the OHLC average value of a standard Heikin Ashi candle. Since the standard hours for the NYSE are Monday – Friday, 09:30 – 16:00 EST, the indicator only plots bars during this time.

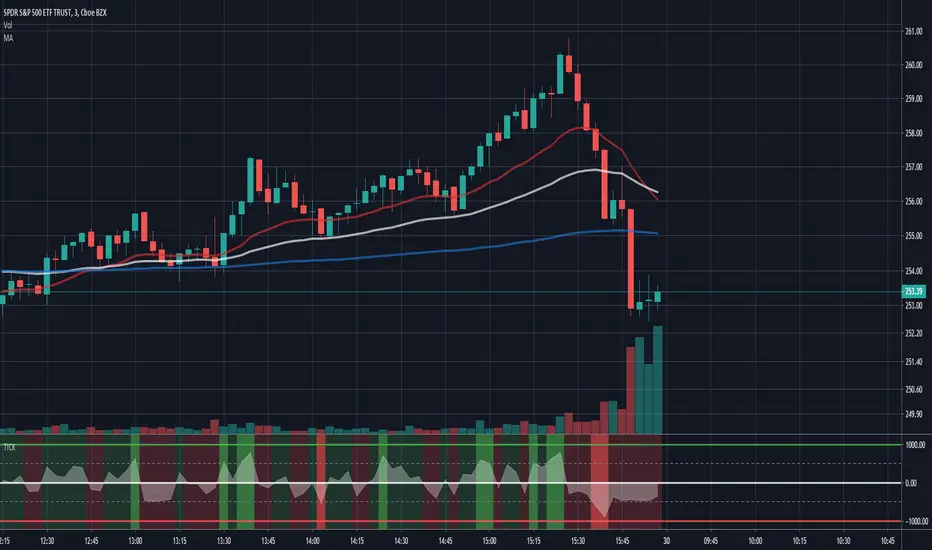
Cumulative TICK Trend[Pt]Cumulative TICK Trend indicator is a comprehensive trading tool that uses TICK data to define the market's cumulative trend. Trend is shown on ATR EMA bands, which is overlaid on the price chart. Cumulative TICK shown on the bottom pane is for reference only.
Main features of the Cumulative TICK Trend Indicator include:
Selectable TICK Source: You have the flexibility to choose your preferred TICK source from the following options, depending on the market you trade: USI:TICK, USI:TICKQ, USI:TICKI, and USI:TICKA.
TICK Data Type: Select the type of TICK data to use, options include: Close, Open, hl2, ohlc4, hlc3.
Simple Moving Average (SMA): You can choose to apply an SMA on the calculated Cumulative TICK values with a customizable length.
Average True Range (ATR) Bands: It provides the option to display ATR bands with adjustable settings. This includes the ATR period, EMA period, source for the ATR calculation, and the ATR multiplier for the upper band.
Trend Color Customization: You can customize the color of the bull and bear trends according to your preference.
Smooth Line Option: This setting allows you to smooth the ATR Bands with a customizable length.
How it Works:
This indicator accumulates TICK data during market hours (9:30-16:00) as per the New York time zone and resets at the start of a new session or the end of the regular session. This cumulative TICK value is then used to determine the trend.
The trend is defined as bullish if the SMA of cumulative TICK is equal to or greater than zero and bearish if it's less than zero. Additionally, this indicator plots the ATR bands, which can be used as volatility measures. The Upper ATR Band and Lower ATR Band can be made smoother using the SMA, according to the trader's preference.
The plot includes two parts for each trend: a stronger color (Red for bear, Green for bull) when the trend is ongoing, and a lighter color when the trend seems to be changing.
Remember, this tool is intended to be used as part of a comprehensive trading strategy. Always ensure you are managing risk appropriately and consulting various data sources to make informed trading decisions.

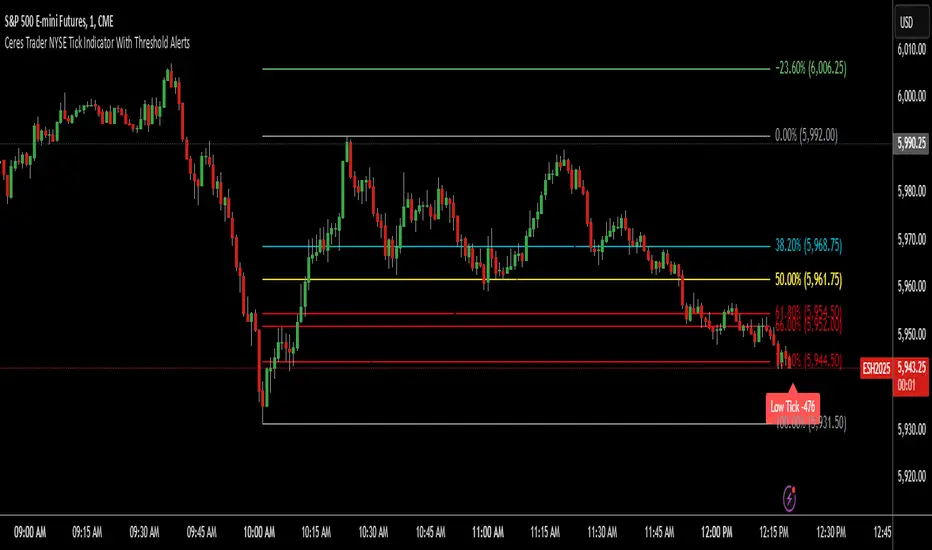
Ceres Trader NYSE Tick Indicator With Threshold AlertsThe Ceres Trader NYSE Tick Indicator provides real-time alerts for significant shifts in the NYSE Tick, empowering traders to identify potential overbought and oversold market conditions. It displays labels directly on the chart when the Tick reaches predefined thresholds, offering a clear and immediate visual representation of market sentiment.
Key Features:
Threshold-Based Alerts:
Highlights "High Tick" and "Low Tick" conditions when the Tick exceeds user-defined thresholds (default: 400 and -400).
Identifies "Extreme High Tick" and "Extreme Low Tick" conditions for more significant shifts (adjusted default: 800 and -800).
Visual Labels:
Displays colored labels directly on the price chart, indicating the type of Tick event and its value.
Green labels signal potential overbought conditions, while red labels indicate potential oversold conditions.
Low tick labels are placed below the price bar, and high tick labels are placed above the price bar for improved visibility.
Real-Time Data:
Utilizes the NYSE Tick symbol ("TICK") to provide up-to-the-minute market data.
User-Friendly Design:
Simple and intuitive design, suitable for traders of all experience levels.
How to Use:
Add the "Ceres Trader NYSE Tick Indicator with Threshold Alerts" to your TradingView chart.
Observe the colored labels that appear when the Tick reaches the specified thresholds.
Use these alerts to identify potential trading opportunities based on overbought or oversold market conditions.
Consider adjusting the threshold values within the indicator settings to align with your specific trading strategy.
[Pt] TICK + Heikin Ashi RSI IndicatorThis indicator combines NYSE TICK and RSI to aim to provide a view of NYSE market trend strength.
What is TICK
NYSE TICK, also known as the TICK index, is a technical analysis indicator that shows the number of stocks on the New York Stock Exchange (NYSE) that are trading on an uptick or a downtick in a particular period of time. The TICK index is calculated by subtracting the number of stocks trading on a downtick from the number of stocks trading on an uptick. A reading of +1000 on the TICK index, for example, would indicate that there are 1000 more stocks trading on an uptick than on a downtick. The TICK index is often used as a measure of market sentiment, as it can provide insight into whether there is more buying or selling pressure in the market at a given time. A high TICK index reading may suggest that there is strong buying pressure, while a low TICK index reading may indicate that there is more selling pressure in the market.
By default, I am using -800 and 800 for oversold and overbought levels. These are configurable. Also, this indicator includes TICK divergence signals.
The TICK index is usually very volatile, so this indicator is best suited for lower timeframes, such as 1 to 5 min charts.
Idea of TICK neutral zone
As part of this indicator I've identified what I consider as "neutral" range for the TICK. Based on my own personal experience, the market tends to be in consolidation or choppy in this range. By default, I've defined this range to be -200 to 200. This range is configurable.
Signals
In combination with RSI and Heikin Ashi RSI (HARSI), which help smooths out the RSI values and make it easier to identify trends and potential reversal points, this indicator aims to generate Bullish vs Bearish signals based on the following conditions:
- bullish / bearish HARSI candle
- Inside bar on HARSI candle
- TICK trend (above or below Neutral zone)
- RSI trend (above or below 0, but not overbought or oversold)
- RSI / HARSI convergence and divergence
When all bullish conditions are met, the signal turns bright green. Bright red when all bearish conditions are met. These generated signals aims to provide users easy to read visual cues to help with their trades.
A table is also provided in attempt to identify the trend in real time:
TICK trend:
- Bullish, Extended
- Bullish
- Neutral w/ Bullish bias
- Neutral w/ Bearish bias
- Bearish
- Bearish, Extended
RSI:
- Bullish
- Bearish
Note on scale
This indicator is based on the scale for TICK, hence the RSI and HARSI are scaled. By default, standard overbought RSI value of 70 = 800 on this scale, whereas oversold value of 30 = -800.
Credits:
Heikin Ashi RSI code was borrowed from @JayRogers - Heikin Ashi RSI Oscillator

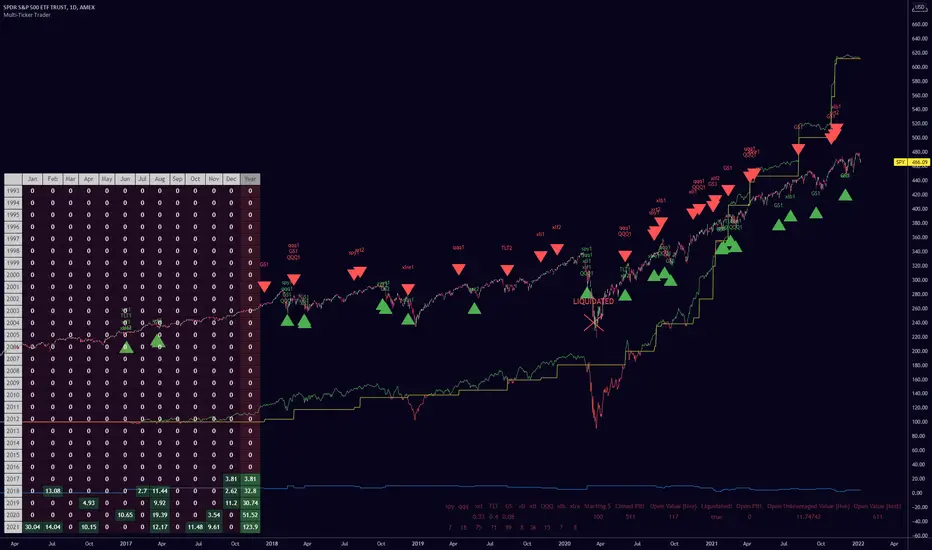
Multiple Ticker TraderThis indicator can be used as an alternative to the built in Strategy Tester for those who want to (back) test a strategy on multiple tickers simultaneously and see it's performance.
Just change the buy and sell conditions in the code to fit your needs.
The strategy I've used here is scaling into up to 10 tickers a maximum of 5 times per ticker every time they retrace (another) 10% from their all time high.
You can set the maximum number of total trades and disable scale ins by setting them to an impossible number (such as, 99% away from the all time high).
Credit to QuantNomad for the monthly/yearly returns table bottom left.
The bottom right table shows the current number of shares the algo is long and also the total all-time returns from each individual ticker, and other data.
The blue line is the number of positions the script is currently long. Each scale into the same ticker represents one position.
The yellow line is the closed P&L.
The green/red line is the live P&L.
I've used leverage for the example image just to showcase the liquidation display.
These particular buy/sell conditions cannot close positions at a loss, so be careful if you're wild enough to use this setup live without understanding the script yourself. I haven't used it live myself yet and you should assume there are serious bugs before thinking about using it live, though I'm using a similar thing on cryptos and it's going fine.
You can edit the leverage, maximum trades and back test range in the settings. The number following the ticker on each label represents which scale in was bought/sold.
Enjoy :) let me know if you find any good results
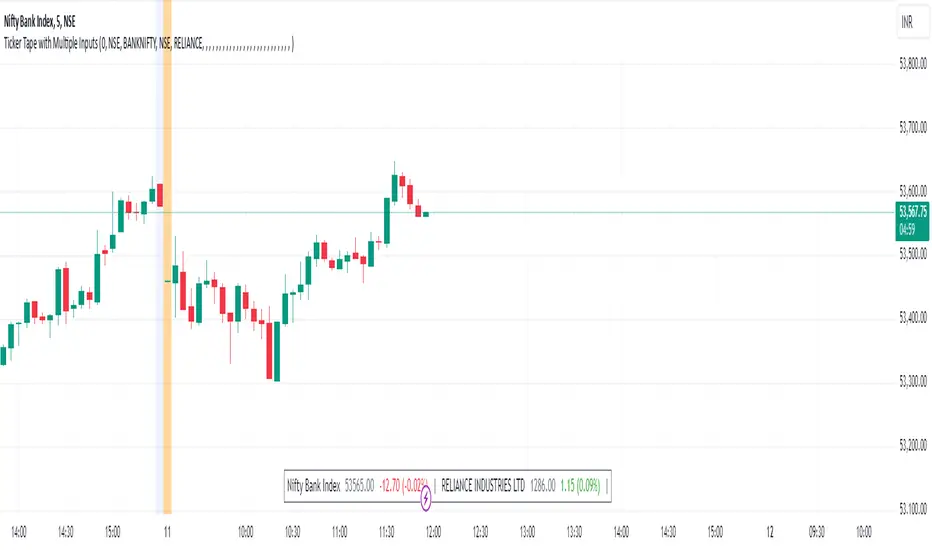
Ticker Tape with Multiple Inputs# Ticker Tape
A customizable multi-symbol price tracker that displays real-time price information in a scrolling ticker format, similar to financial news tickers.
This indicator is inspired from Tradingciew's default tickertape indicator with changes in the way inputs are given.
### Overview
This indicator allows you to monitor up to 15 different symbols simultaneously across any supported exchanges on TradingView. It displays essential price information including current price, price change, and percentage change in an easy-to-read format at the bottom of your chart.
### Features
• Monitor up to 15 different symbols simultaneously
• Support for any exchange available on TradingView
• Real-time price updates
• Color-coded price changes (green for increase, red for decrease)
• Smooth scrolling animation (can be disabled)
• Customizable scroll speed and position offset
### Input Parameters
#### Ticker Tape Controls
• Running: Enable/disable the scrolling animation
• Offset: Adjust the starting position of the ticker tape
#### Symbol Settings
• Exchange (1-15): Enter the exchange name (e.g., NSE, BINANCE, NYSE)
• Symbol (1-15): Enter the symbol name (e.g., BANKNIFTY, RELIANCE, BTCUSDT)
### Display Format
For each symbol, the ticker shows:
1. Symbol Name
2. Current Price
3. Price Change (Absolute and Percentage)
### Example Usage
Input Settings:
Exchange 1: NSE
Symbol 1: BANKNIFTY
Exchange 2: NSE
Symbol 2: RELIANCE
The ticker tape will display:
`NIFTY BANK 46750.00 +350.45 (0.75%) | RELIANCE 2456.85 -12.40 (-0.50%) |`
### Use Cases
1. Multi-Market Monitoring: Track different markets simultaneously without switching between charts
2. Portfolio Tracking: Monitor all your positions in real-time
### Tips for Best Use
1. Group related symbols together for easier monitoring
2. Use the offset parameter to position important symbols in your preferred viewing area
3. Disable scrolling if you prefer a static display
4. Leave exchange field empty for default exchange symbols
### Notes
• Price updates occur in real-time during market hours
• Color coding helps quickly identify price direction
• The indicator adapts to any chart timeframe
• Empty input pairs are automatically skipped
### Performance Considerations
The indicator is optimized for efficiency, but monitoring too many high-frequency symbols might impact chart performance. It's recommended to use only the symbols you actively need to monitor.
Version: 2.0 Stock_Cloud
Last Updated: December 2024
Last Candle OHLC (Ticks or Points)What the Code Does
1. **Draws Lines and Labels**:
- It draws lines on your chart to show the high, low, open, and close prices from the previous period (like the previous day or week).
- It also labels these lines with numbers that tell you how far the current price is from these levels.
2. **Shows Price Movement**:
- You can see how far the price has moved from these levels in terms of small price changes (ticks) or larger units (points).
- This helps you understand price movements and potential levels of support or resistance.
3. **Customizable**:
- You can choose whether to show these lines and labels, and you can select if you want to see the movement in ticks or points.
- The lines can extend into the future on your chart to help you anticipate where prices might be in the coming days.
### How It’s Useful:
1. **Identify Key Levels**:
- It helps you spot important price levels from past periods, which can act as support or resistance.
2. **Understand Price Movement**:
- You get a visual sense of how much the price has moved from key levels, which can help you gauge market volatility.
3. **Plan Trades**:
- By seeing where the price has been and how it has moved, you can better plan your trades, like deciding where to enter or exit based on these levels.
4. **Flexible for Different Markets**:
- It works across various markets, like stocks, futures, and forex, adjusting to the specific characteristics of each instrument.
In short, this tool helps you visualize and understand past price movements and levels on your chart, aiding in your trading decisions.

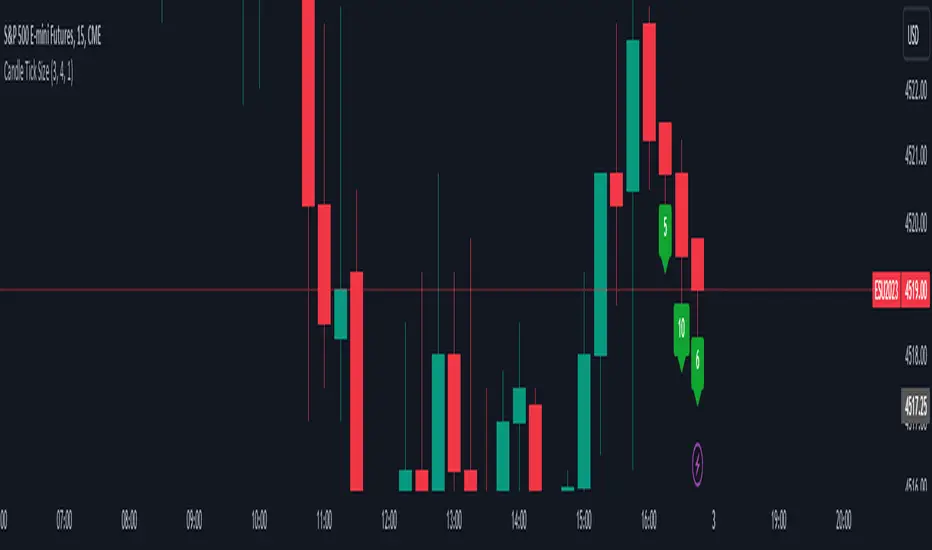
Candle Tick SizeHello everyone!
I dont think it exists, I couldnt find it any way I searched, maybe it is part of a bigger indicator. This is a really basic code, all it does, it shows the tick/pip size of the candles forming. You can adjust on how many candles should it show. Also because the code counts the point size of the candles from high to low, you can adjust that how many ticks are in one point, like for ES and NQ 4 ticks to a point, which is the basic setting. It helps me with entrys when I calculate the contract size so my risk/reward stays pretty much the same depending on the candle size for my entrys.
ALL Ticker ID informationAn example and overview of the syminfo and tickerid functions to be able to access different tools.
Here is an example of accessing the Bitfinex exchange (and requesting "instrument name") when another exchange is open (BINANCE:BTCUSDT)
There is a difference in name between BINANCE:BTCUSDT and BITFINEX:BTCUSD exchanges
Try swapping //
T = "BITFINEX:"+str.tostring(syminfo.basecurrency)+"USDT"
//T = "BITFINEX:"+str.tostring(syminfo.basecurrency)+"USD"
The script will show that this instrument does not exist "Error in the value of the instrument. There is no such currency!"
Implemented Resolve error handling with the ignore_invalid_symbol=true parameter, this gives further processing of the script without errors.
----------------------------------------------------------
Пример и обзор функций syminfo и tickerid для возможности доступа к разным инструментам.
Здесь реализован пример доступа к бирже Bitfinex(и запрос "названия инструмента"), когда открыта другая биржа (BINANCE:BTCUSDT)
Существует разница в названии между биржами BINANCE:BTCUSDT и BITFINEX:BTCUSD
Попробуйте поменять // местами
T = "BITFINEX:"+str.tostring(syminfo.basecurrency)+"USDT"
//T = "BITFINEX:"+str.tostring(syminfo.basecurrency)+"USD"
Скрипт выдаст, что данного инструмента нет "Ошибка в значении инструмента. Такой валюты нет!"
Реализована Обработка ошибки Resolve error с помощью параметра ignore_invalid_symbol=true это дает дальнейшую обработку скрипта без ошибок.

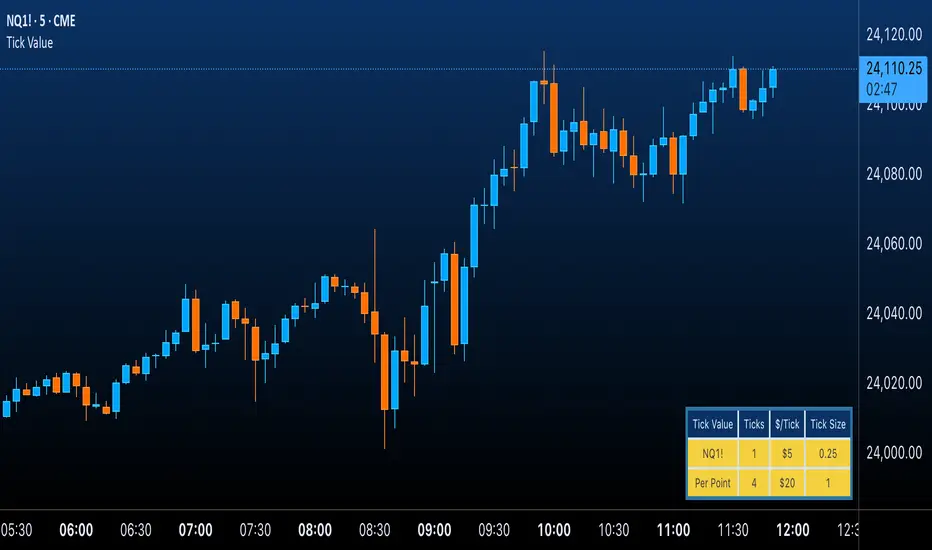
Futures Tick & Point Value [BoredYeti]Futures Tick & Point Value
This utility displays tick size, dollars per tick, and (optionally) a per-point row for the current futures contract.
Features
• Hardcoded $/tick map for common CME/NYMEX/CBOT/COMEX contracts
• Automatic fallback using pointvalue * mintick for any other symbol
• Table settings: adjustable position, text size, customizable colors
• Optional “Per Point” row showing ticks and $/point
Notes
• Contract specs can vary by broker/exchange and may change over time. Always confirm with official specifications.
• Educational tool only; not financial advice.
LNL Smart TICKLNL Smart TICK
This study is mostly beneficial for intraday traders. It is basically a user-friendly "colorful" representation of the $TICK chart with highlighted $TICK extremes. This indicator also includes: a simple trend gauge that can visualize the bias for the day, cumulative tick cloud which is showing the cumulative strength of either longs & shorts on the day.
$TICK Trend Gauge
Although it is just a exponential moving average. This average (default set on 20) works quite well as an overall gauge for the day. Whenever the gauge is green (above zero), any negative $TICK values below -500 can offer great pullback opportunities. Same applies for the red gauge. 20 EMA is below zero ? Great time to fade any +500 or +1000 tick readings. Obviously the gauge can be ajdusted to any number based on personal style.
$TICK Extremes (little triangles)
These little triangles are triggered anytime $TICK jumps above or below the pre-set values of +1000 or -1000. By just simply observing the $TICK triangles during the day can tell you how much volaility or pressure there is. Sometimes there will be 20 green triangles and only 2 red ones. That obviously mean there is a strong bearish pressure. But there will be days when you are not going to see any triangles at all which can mean there is either a low volatility or the price is stuck in the indecisive market.
Cumulative $TICK Cloud
Cumulative $TICK by itself is a great study for day traders. It is basically running "counting" $TICK that is adding the previous $TICK values from previous bars. Cumulative $TICK can create a direct picture of the current market sentiment. It is not just a simple green / red line but a cloud that can really show you the depth on the $TICK. Some days, the cloud will be quite wide which is a good sign for the strength to one side, but sometimes the cloud will be so narrow it will practically disappear. This would be telling you the exact opposite - not much conviction to any side. Of course the depth as well as the color of the cloud can change during the day.
$TICK & Cumulative $TICK Tables
By just looking at these tables. You can immidiately tell the state of the current $TICK. They both can be red or green. It all depends whether the values are positive or negative. The tables are just a little visual addition to the whole $TICK study.
Hope it helps.

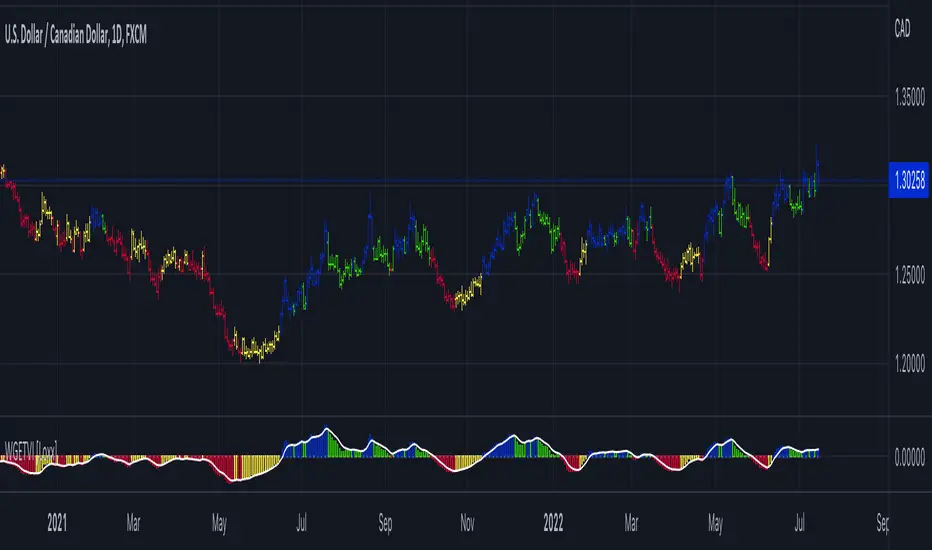
William Blau Ergodic Tick Volume Indicator (TVI) [Loxx]William Blau Ergodic Tick Volume Indicator (TVI) is a volume/volatility indicator that is used for finding reversals in price movement
What is William Blau Ergodic Tick Volume?
This is one of the techniques described by William Blau in his book "Momentum, Direction and Divergence" (1995). If you like to learn more, we advise you to read this book. His book focuses on three key aspects of trading: momentum, direction and divergence. Blau, who was an electrical engineer before becoming a trader, thoroughly examines the relationship between price and momentum in step-by-step examples. From this grounding, he then looks at the deficiencies in other oscillators and introduces some innovative techniques, including a fresh twist on Stochastics. On directional issues, he analyzes the intricacies of ADX and offers a unique approach to help define trending and non-trending periods.
William Blau's definition of TVI ergodicity is that the indictor is ergodic when periods are set to 32, 5, 1, and the signal is set to 5. Other combinations are not ergodic, according to Blau.
How to use TVI
TVI bar color change is a signal to enter the market. When the TVI changes from yellow to red, it is a signal to buy and if the TVI bar changes from blue to green, it is a signal to sell.
Just like the MACD and TRIX, the zero line on the indicator determines market sentiment and trend. If the TVI bars are above the zero line it's bullish and if the TVI bars are below the zero line the trend is bearish. Zero line crosses can be used to determine continuation and trend entries as well.
Included
Bar coloring
35+ moving averages for both TVI and the signal