"富时中国50期指" için komut dosyalarını ara


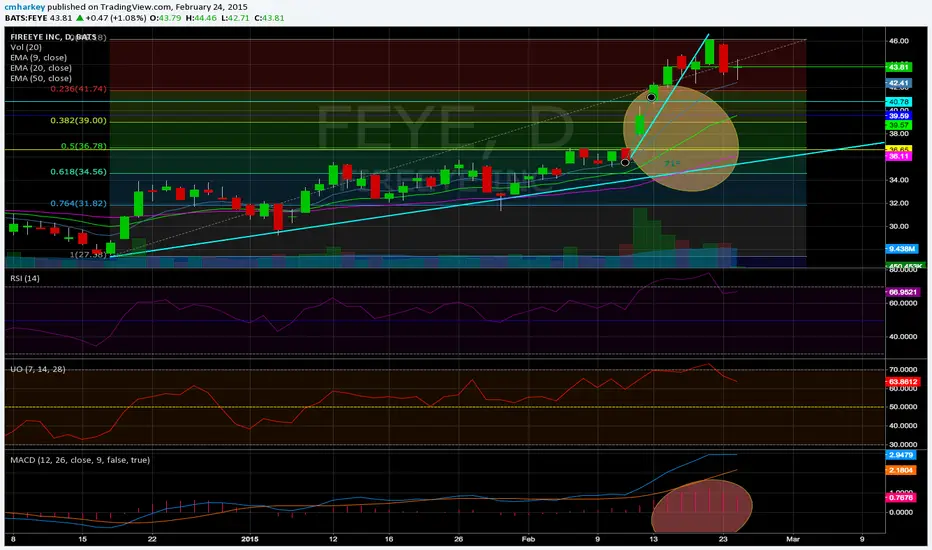
UO_30-50-70Ultimate Oscillator with bands present at the 30, 50, and 70 pt levels.
Personally use this every time, created a script to hard code these lines so I wouldn't need to redraw them all the time.
Enjoy
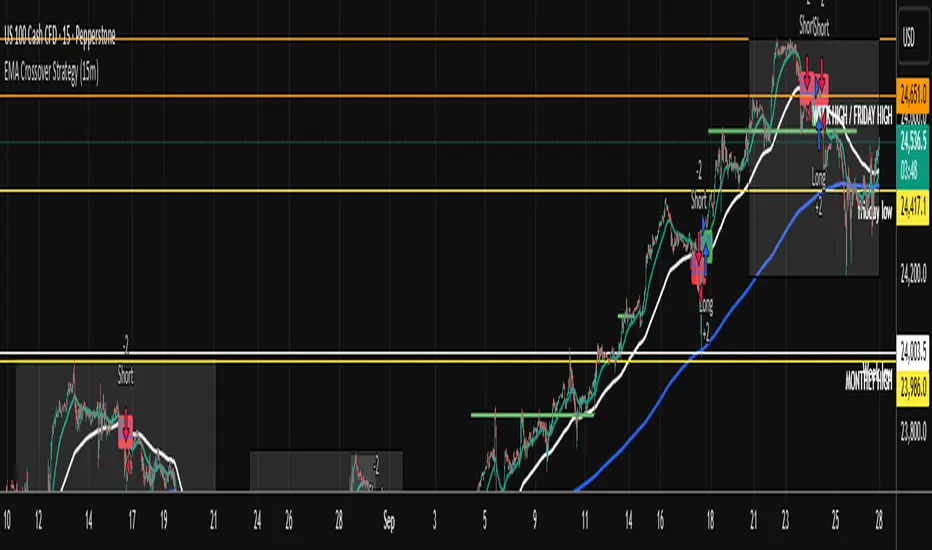
EMA Crossover Strategy (15m)50 and 200 ema crossing when leaving anchor. when 50 and 200 crosses will give you direction of where market is going. wait for a pull back and take trade. sl on highest or lowest point of apex tp open . when you see multiple equal ( low or High) get put of trade.
The Lazy Trader - Index (ETF) Trend Following Robot50/150 moving average, index (ETF) trend following robot. Coded for people who cannot psychologically handle dollar-cost-averaging through bear markets and extreme drawdowns (although DCA can produce better results eventually), this robot helps you to avoid bear markets. Be a fair-weathered friend of Mr Market, and only take up his offer when the sun is shining! Designed for the lazy trader who really doesn't care...
Recommended Chart Settings:
Asset Class: ETF
Time Frame: Daily
Necessary ETF Macro Conditions:
a) Country must have healthy demographics, good ratio of young > old
b) Country population must be increasing
c) Country must be experiencing price-inflation
Default Robot Settings:
Slow Moving Average: 50 (integer) //adjust to suit your underlying index
Fast Moving Average: 150 (integer) //adjust to suit your underlying index
Bullish Slope Angle: 5 (degrees) //up angle of moving averages
Bearish Slope Angle: -5 (degrees) //down angle of moving averages
Average True Range: 14 (integer) //input for slope-angle formula
Risk: 100 (%) //100% risk means using all equity per trade
ETF Test Results (Default Settings):
SPY (1993 to 2020, 27 years), 332% profit, 20 trades, 6.4 profit factor, 7% drawdown
EWG (1996 to 2020, 24 years), 310% profit, 18 trades, 3.7 profit factor, 10% drawdown
EWH (1996 to 2020, 24 years), 4% loss, 26 trades, 0.9 profit factor, 36% drawdown
QQQ (1999 to 2020, 21 years), 232% profit, 17 trades, 3.6 profit factor, 2% drawdown
EEM (2003 to 2020, 17 years), 73% profit, 17 trades, 1.1 profit factor, 3% drawdown
GXC (2007 to 2020, 13 years), 18% profit, 14 trades, 1.3 profit factor, 26% drawdown
BKF (2009 to 2020, 11 years), 11% profit, 13 trades, 1.2 profit factor, 33% drawdown
A longer time in the markets is better, with the exception of EWH. 6 out of 7 tested ETFs were profitable, feel free to test on your favourite ETF (default settings) and comment below.
Risk Warning:
Not tested on commodities nor other financial products like currencies (code will not work), feel free to leave comments below.
Moving Average Slope Angle Formula:
Reproduced and modified from source:

50 & 200 SMA + RSI Average Strategy (Long Only, Single Trade)It works better in trending markets. It delivers its best performance in the 4-hour to 1-day timeframes.

50-Minute Opening Range BreakoutThis is a test of the opening range with Bearish/Bullish confirmation

50-Line Oscillator // (\_/)
// ( •.•)
// (")_(")
25-Line Oscillator
Description:
The 25-Line Oscillator is a sophisticated technical analysis tool designed to visualize market trends through the use of multiple Simple Moving Averages (SMAs). This indicator computes a series of 26 SMAs, incrementally increasing the base length, providing traders with a comprehensive view of price dynamics.
Features:
Customizable Base Length: Adjust the base length of the SMAs according to trading preferences, enhancing versatility for different market conditions.
Rainbow Effect: The indicator employs a visually appealing rainbow color scheme to differentiate between the various trend lines, making it easy to identify crossovers and momentum shifts.
Crossovers Detection: The script includes logic to detect crossover events between consecutive trend lines, which can serve as signals for potential entry or exit points in trading.
Clear Visualization: Suitable for both novice and seasoned traders, the plots enable quick interpretation of trends and market behavior.
How to Use:
Add the indicator to your chart and customize the base length as desired.
Observe the rainbow-colored lines for trend direction.
Look for crossover events between the SMAs as potential trading signals.
Application: This indicator is particularly useful for swing traders and trend followers who aim to capitalize on market momentum and identify reversals. By monitoring the behavior of multiple SMAs, traders can gain insights into the strength and direction of price movements over various time frames.


AK Simple Moving Average 50 days Simple Moving average suitable for Intraday on 1Hr,30Min.15Min Time frames
1. When candle crossing above SMA Line - Go for Long Entries
2. When candle crossing below SMA Line - Go for short Entries
50 SMA / 200 EMA / 128EMA Moving Average CrossFound success using 50SMA vs 200EMA.
128 EMA also charted for it's BTC relevance.


50/100/200 Moving Averages (Pine Script For Copy)by fresca
SCRIPT LANGUAGE
Copy script below and adjust based on your preferences.
-function (change function from "sma" to "ema", "wma" and more)
-length (25 Day, 150 Day or add more averages to the three in this script.)
-color, (red, yellow, etc. or use color hex codes i.e. #FEDA15, #FFAD8F, etc.)
-transparency (set to desired level 1-100)
Or add more options.
RESOURCES
Color hex codes site: www.canva.com
Trading View Pine Script Editor Reference Guide: www.tradingview.com

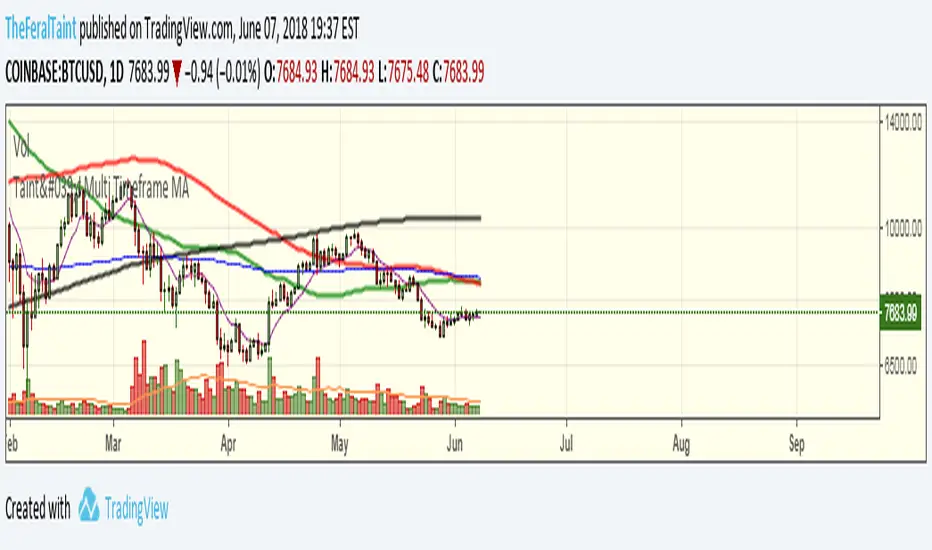
Taint's Multi Time Frame MA50-100-200 SMA with two 200 EMA's all with the ability choose a time frame for each.


YM Ultimate SNIPER# YM Ultimate SNIPER - Documentation & Trading Guide
## 🎯 Unified GRA + DeepFlow | YM-Optimized for Low Volatility
**TARGET: 3-7 High-Confluence Trades per Day**
> **Philosophy:** *YM's lower volatility is not a weakness—it's our edge. Predictability + precision = consistent profits.*
---
## ⚡ QUICK REFERENCE CARD
```
┌─────────────────────────────────────────────────────────────────────────────┐
│ YM ULTIMATE SNIPER - QUICK REFERENCE │
├─────────────────────────────────────────────────────────────────────────────┤
│ │
│ 💰 YM BASICS: │
│ ═════════════ │
│ • 1 tick = 1 point = $5/contract │
│ • Typical daily range: 150-400 points │
│ • 30-40% less volatile than NQ │
│ • More institutional, less retail noise │
│ │
├─────────────────────────────────────────────────────────────────────────────┤
│ │
│ 🎯 TIER THRESHOLDS (YM-OPTIMIZED): │
│ ══════════════════════════════════ │
│ S-TIER: 50+ pts = $250+/contract → HOLD (Institutional sweep) │
│ A-TIER: 25-49 pts = $125-245/contract → SWING (Strong momentum) │
│ B-TIER: 12-24 pts = $60-120/contract → SCALP (Quick grab) │
│ │
├─────────────────────────────────────────────────────────────────────────────┤
│ │
│ ⏰ SESSION WINDOWS: │
│ ═══════════════════ │
│ LDN → 3:00-5:00 AM ET (European flow) │
│ NY → 9:30-11:30 AM ET (US opening drive) │
│ PWR → 3:00-4:00 PM ET (End-of-day rebalancing) │
│ │
│ Expected Trades: 1-2 LDN | 2-3 NY | 1-2 PWR = 4-7 total │
│ │
├─────────────────────────────────────────────────────────────────────────────┤
│ │
│ 📊 CONFLUENCE SCORING (MAX 10 POINTS): │
│ ═══════════════════════════════════════ │
│ Tier Signal: S=3, A=2, B=1 points │
│ In Active Zone: +2 points │
│ POC Aligned: +1 point (POC at body extreme) │
│ Imbalance Support:+1 point (supporting IMB nearby) │
│ Strong Volume: +1 point (2x+ average) │
│ Strong Delta: +1 point (70%+ dominance) │
│ CVD Momentum: +1 point (CVD trending with signal) │
│ │
│ MINIMUM SCORE: 5/10 to show signal (adjustable) │
│ IDEAL SCORE: 7+/10 for highest probability │
│ │
├─────────────────────────────────────────────────────────────────────────────┤
│ │
│ 🚨 SIGNAL TYPES: │
│ ═════════════════ │
│ S🎯 / A🎯 / B🎯 → GRA Tier Signals (Full confluence) │
│ Z🎯 → Zone Entry (At DFZ zone + delta + volume) │
│ SP → Single Print (Institutional impulse) │
│ │
├─────────────────────────────────────────────────────────────────────────────┤
│ │
│ ✓ ENTRY CHECKLIST: │
│ ═══════════════════ │
│ □ Signal appears (check Score ≥5) │
│ □ Session active (LDN!/NY!/PWR!) │
│ □ Table: Vol GREEN, Delta colored, Body GREEN │
│ □ CVD arrow (▲/▼) matches direction │
│ □ Note stop/target lines on chart │
│ □ Check Zone status (bonus if IN ZONE) │
│ □ Execute at signal candle close │
│ │
├─────────────────────────────────────────────────────────────────────────────┤
│ │
│ 🎯 POSITION SIZING BY TIER: │
│ ═══════════════════════════ │
│ S-TIER (50+ pts): Full size, hold 2-5 min, target 2.5:1 R:R │
│ A-TIER (25-49): 75% size, hold 1-3 min, target 2.0:1 R:R │
│ B-TIER (12-24): 50% size, hold 30-90 sec, target 1.5:1 R:R │
│ │
├─────────────────────────────────────────────────────────────────────────────┤
│ │
│ ⛔ DO NOT TRADE WHEN: │
│ ════════════════════ │
│ ✗ Session shows "---" │
│ ✗ Score < 5/10 │
│ ✗ Vol shows RED (<1.8x) │
│ ✗ Delta < 62% │
│ ✗ Multiple conflicting signals │
│ ✗ Just before major news (FOMC, NFP, etc.) │
│ │
└─────────────────────────────────────────────────────────────────────────────┘
```
---
## 📋 WHY YM? LEVERAGING LOW VOLATILITY
### The YM Advantage
Most traders avoid YM because "it doesn't move enough." This is precisely why it's perfect for precision scalping:
| Factor | NQ | YM | Advantage |
|--------|----|----|-----------|
| **Daily Range** | 300-600 pts | 150-400 pts | More predictable moves |
| **Tick Value** | $5/tick (4 ticks/pt) | $5/tick (1 tick/pt) | Simpler math |
| **Retail Noise** | High | Low | Cleaner signals |
| **Whipsaws** | Frequent | Rare | Fewer fakeouts |
| **Trend Persistence** | Short | Long | Easier holds |
| **Fill Quality** | Variable | Consistent | Better execution |
### Why 3-7 Trades is the Sweet Spot
```
YM SESSION BREAKDOWN:
════════════════════
LONDON (3-5 AM ET): 1-2 trades
├── Why: European institutions positioning for US open
├── Character: Slow build-up, clean trends
└── Best signals: Zone entries + A/B tier
NY OPEN (9:30-11:30 AM ET): 2-3 trades
├── Why: Highest volume, most institutional activity
├── Character: Initial balance formation, breakouts
└── Best signals: S/A tier, zone confluence
POWER HOUR (3-4 PM ET): 1-2 trades
├── Why: End-of-day rebalancing, MOC orders
├── Character: Mean reversion or trend acceleration
└── Best signals: Zone entries, B tier quick scalps
TOTAL: 4-7 high-quality setups per day
```
---
## 🔧 YM-SPECIFIC OPTIMIZATIONS
This unified indicator has been specifically tuned for YM's characteristics:
### Tier Thresholds
| Tier | NQ (Original) | YM (Optimized) | Rationale |
|------|---------------|----------------|-----------|
| S-Tier | 100 pts | **50 pts** | YM's daily range is ~50% of NQ |
| A-Tier | 50 pts | **25 pts** | Proportional scaling |
| B-Tier | 20 pts | **12 pts** | Still 5%+ of typical daily range |
### Filter Adjustments
| Filter | NQ Value | YM Value | Why |
|--------|----------|----------|-----|
| Volume Ratio | 1.5x | **1.8x** | Higher bar = less retail noise |
| Delta Threshold | 60% | **62%** | Tighter for cleaner signals |
| Body Ratio | 70% | **72%** | More conviction required |
| Range Multiplier | 1.3x | **1.4x** | Bigger move = real signal |
| Gap ATR% | 30% | **25%** | Smaller gaps still significant |
| Zone Age | 50 bars | **75 bars** | Zones last longer in slow market |
### Why These Changes Work
1. **Higher Volume Bar**: YM has more institutional flow. Requiring 1.8x volume ensures we're catching real moves, not retail chop.
2. **Tighter Delta**: With less noise, we can demand clearer buyer/seller dominance before entering.
3. **Longer Zone Life**: YM trends persist longer. A zone that would be stale in NQ is still viable in YM.
4. **Smaller Gap Threshold**: YM gaps are naturally smaller. 25% of ATR in YM is significant institutional activity.
---
## 📊 CONFLUENCE SCORING SYSTEM
The unified indicator uses a 10-point confluence scoring system to filter for only the highest-probability setups:
### Score Breakdown
```
CONFLUENCE SCORE CALCULATION:
═════════════════════════════
BASE POINTS (Tier):
├── S-Tier signal: +3 points
├── A-Tier signal: +2 points
└── B-Tier signal: +1 point
BONUS POINTS:
├── Inside Active Zone (DFZ): +2 points
│ └── Price within bull/bear zone = institutional level
│
├── POC Alignment: +1 point
│ └── POC at body extreme = strong conviction
│
├── Imbalance Support: +1 point
│ └── Supporting imbalance within 1 ATR
│
├── Strong Volume (2x+): +1 point
│ └── Exceptional institutional participation
│
├── Strong Delta (70%+): +1 point
│ └── Clear one-sided aggression
│
└── CVD Momentum: +1 point
└── CVD trending with signal direction
MAXIMUM POSSIBLE: 10 points
```
### Score Interpretation
| Score | Quality | Action | Expected Win Rate |
|-------|---------|--------|-------------------|
| 8-10 | 🥇 Elite | Full size, hold for target | 75-80% |
| 6-7 | 🥈 Strong | Standard size, manage actively | 65-70% |
| 5 | 🥉 Valid | Reduced size, quick scalp | 55-60% |
| <5 | ⚫ Filtered | No signal shown | N/A |
### Adjusting Minimum Score
- **Conservative (Score ≥6)**: Fewer trades, higher win rate
- **Standard (Score ≥5)**: Balanced approach, 3-7 trades/day
- **Aggressive (Score ≥4)**: More trades, requires active management
---
## 📐 SIGNAL TYPES EXPLAINED
### 1. GRA Tier Signals (S🎯, A🎯, B🎯)
These are the primary signals from the merged GRA system:
```
TIER SIGNAL REQUIREMENTS:
═══════════════════════════
ALL must be TRUE:
├── ✓ Point movement meets tier threshold
├── ✓ Volume ≥ 1.8x average
├── ✓ Delta ≥ 62% (buy or sell dominance)
├── ✓ Body ≥ 72% of candle range
├── ✓ Range ≥ 1.4x average
├── ✓ Small opposite wick (<50% of body)
├── ✓ CVD confirms direction (if enabled)
├── ✓ Active session (LDN/NY/PWR)
└── ✓ Confluence Score ≥ minimum (default 5)
```
### 2. Zone Entry Signals (Z🎯)
When price enters a DeepFlow zone with confirmation:
```
ZONE ENTRY REQUIREMENTS:
═══════════════════════════
ALL must be TRUE:
├── ✓ Price inside fresh/tested zone (not broken)
├── ✓ Delta ≥ 62% in zone direction
├── ✓ Volume ≥ 1.5x average
└── ✓ Active session
NOTE: Z🎯 only appears when NOT already showing tier signal
(prevents duplicate signals on same candle)
```
### 3. Single Print Markers (SP)
Mark institutional impulse candles for future S/R:
```
SINGLE PRINT REQUIREMENTS:
═══════════════════════════
ALL must be TRUE:
├── ✓ Range ≥ 1.6x average
├── ✓ Body ≥ 72% of range
├── ✓ Volume ≥ 1.8x average
├── ✓ Delta ≥ 62% confirms direction
└── ✓ Active session
USE: Horizontal lines at high/low act as future S/R
```
---
## 🎯 TRADING STRATEGIES
### Strategy 1: Zone + Tier Confluence (Highest Probability)
```
THE ULTIMATE YM SETUP:
═══════════════════════
Setup:
1. Active DeepFlow zone exists (green box below for long)
2. Price pulls back INTO the zone
3. Tier signal fires INSIDE the zone (S🎯/A🎯)
4. Score shows 7+/10
Entry: Signal candle close
Stop: Below zone bottom (for longs)
Target: Based on tier (1.5-2.5:1 R:R)
Why It Works:
• Zone = institutional limit orders
• Tier signal = momentum confirmation
• Double confirmation = high probability
Expected Win Rate: 70-75%
```
### Strategy 2: Pure Tier Signal with POC Stop
```
SNIPER TIER TRADE:
══════════════════
Setup:
1. Tier signal appears (preferably A or S)
2. Score ≥ 5/10
3. Note POC level on signal candle
4. Red/green stop/target lines appear
Entry: Signal candle close
Stop: Beyond POC (shown on chart)
Target: Auto-calculated based on tier
Key: POC placement matters
• POC near candle bottom (longs) = STRONG
• POC in middle = weaker signal
• POC at extreme = possible exhaustion
Expected Win Rate: 60-65%
```
### Strategy 3: Zone Bounce (Continuation)
```
ZONE BOUNCE TRADE:
══════════════════
Setup:
1. Fresh zone created during session
2. Price leaves zone, moves in zone direction
3. Price returns to test zone (within 15 bars)
4. Z🎯 signal appears or rejection candle forms
Entry: At CE line (middle of zone)
Stop: Beyond zone edge
Target: Previous swing high/low
Why It Works:
• Zones represent unfilled orders
• First retest often finds support/resistance
• Lower volatility = cleaner bounces
Expected Win Rate: 55-60%
```
### Strategy 4: Single Print Scalp
```
SINGLE PRINT SCALP:
═══════════════════
Setup:
1. Single Print (SP) marker appears
2. Note the gold/purple lines at high/low
3. Wait for price to return to SP level
4. Look for rejection or tier signal at level
Entry: At SP line with confirmation
Stop: Beyond the SP line
Target: Quick 1:1 or to next structure
Why It Works:
• SP = price moved too fast, orders unfilled
• Price often returns to "fill" these levels
• YM's slower pace makes retests likely
Expected Win Rate: 55-60%
```
---
## 📊 TABLE LEGEND
| Field | Reading | Color Meaning |
|-------|---------|---------------|
| **Pts** | Current candle points | Gold/Green/Yellow = Tiered |
| **Tier** | S/A/B/X | Tier color or white |
| **Vol** | Volume ratio | 🟢 ≥1.8x, 🔴 <1.8x |
| **Delta** | Buy/Sell % | 🟢 Buy dom, 🔴 Sell dom |
| **Body** | Body % of range | 🟢 ≥72%, 🔴 <72% |
| **CVD** | Trend direction | ▲ Bullish, ▼ Bearish |
| **Sess** | Active session | 🟡 LDN!/NY!/PWR!, ⚫ --- |
| **POC** | Point of Control | 🟡 Gold price level |
| **Zone** | Zone position | 🟢 BUY⬚, 🔴 SELL⬚, ⚫ --- |
| **Zones** | Active zone count | #B/#S format |
| **Score** | Confluence score | 🟢 7+, 🟡 5-6, ⚫ <5 |
| **IMB** | Recent imbalances | Count in last 10 bars |
| **R:R** | Risk/Reward | 🟢 On signal, ⚫ No signal |
---
## ⏰ SESSION-SPECIFIC PLAYBOOKS
### London Session (3:00-5:00 AM ET)
```
CHARACTER: Slow, methodical, trend-building
VOLUME: Medium (50-70% of NY)
BEST SETUPS: Zone entries, A/B tier with zones
PLAYBOOK:
• Enter on zone retests
• Expect 15-25 pt moves
• Don't fight early direction
• Watch for pre-NY positioning
TYPICAL TRADES: 1-2
```
### NY Open (9:30-11:30 AM ET)
```
CHARACTER: Fast, volatile, high-conviction
VOLUME: Highest of day
BEST SETUPS: S/A tier, zone confluence
PLAYBOOK:
• First 15 min: Observe Initial Balance
• 9:45-10:15: Best setups form
• S-tier signals = ride the wave
• Be aggressive on high scores
TYPICAL TRADES: 2-3
```
### Power Hour (3:00-4:00 PM ET)
```
CHARACTER: Rebalancing, MOC orders
VOLUME: Medium-high (70-80% of NY)
BEST SETUPS: B tier scalps, zone entries
PLAYBOOK:
• Watch for mean reversion setups
• Quick scalps around POC levels
• Don't hold through close
• Take profits at 1:1 R:R
TYPICAL TRADES: 1-2
```
---
## 🔧 RECOMMENDED SETTINGS
### Conservative (Fewer, Better Trades)
| Setting | Value | Notes |
|---------|-------|-------|
| Min Confluence Score | 6 | Only strong setups |
| Min Volume Ratio | 2.0 | Higher bar |
| Delta Threshold | 65% | Stricter dominance |
| Max Zones | 8 | Less clutter |
### Standard (Balanced)
| Setting | Value | Notes |
|---------|-------|-------|
| Min Confluence Score | 5 | Default |
| Min Volume Ratio | 1.8 | Default |
| Delta Threshold | 62% | Default |
| Max Zones | 12 | Default |
### Aggressive (More Opportunities)
| Setting | Value | Notes |
|---------|-------|-------|
| Min Confluence Score | 4 | More signals |
| Min Volume Ratio | 1.5 | Lower bar |
| Delta Threshold | 60% | Looser |
| Max Zones | 15 | More context |
---
## 🚨 ALERT SETUP
Configure these alerts in TradingView:
| Alert | Priority | Action |
|-------|----------|--------|
| 🎯 YM S-TIER LONG/SHORT | 🔴 CRITICAL | Drop everything, check immediately |
| 🎯 YM A-TIER LONG/SHORT | 🟠 HIGH | Evaluate within 15 seconds |
| 🎯 YM B-TIER LONG/SHORT | 🟡 MEDIUM | Check if available |
| 🎯 YM ZONE BUY/SELL | 🟢 STANDARD | Good context entry |
| 📦 NEW ZONE | 🔵 INFO | Mark on mental map |
| ⭐ SINGLE PRINT | 🔵 INFO | Note for future S/R |
| SESSION OPEN | ⚪ INFO | Prepare to trade |
### Alert Message Format
```
🎯 YM A-LONG | YM1! @ 42,150 | 68%B | Score: 7/10 | IN ZONE | POC: 42,125 | Stop: 42,098 | SWING
```
---
## ⚠️ COMMON MISTAKES TO AVOID
| Mistake | Why It's Bad | Solution |
|---------|-------------|----------|
| Trading outside sessions | Low volume = noise | Wait for LDN/NY/PWR |
| Ignoring score | Low scores = low probability | Require ≥5/10 |
| Fighting the zone | Zones are institutional | Trade WITH zones |
| Oversizing B-tier | Quick scalps, not holds | 50% size max |
| Holding through news | Volatility spike | Exit before FOMC, NFP |
| Chasing after signal | Entry on close only | Miss it = wait for next |
| Ignoring POC position | Middle POC = indecision | Strong = extreme POC |
---
## 📈 DAILY TRADE JOURNAL TEMPLATE
```
DATE: ___________
SESSION: □ LDN □ NY □ PWR
TRADE 1:
├── Time: _______
├── Signal: S🎯 / A🎯 / B🎯 / Z🎯
├── Score: ___/10
├── Entry: _______
├── Stop: _______
├── Target: _______
├── In Zone: □ Yes □ No
├── Result: +/- ___ pts ($_____)
└── Notes: _______________________
TRADE 2:
DAILY SUMMARY:
├── Total Trades: ___
├── Win Rate: ___%
├── Net P/L: $_____
├── Best Setup: _______
└── Improvement: _______________________
```
---
## 🏆 GOLDEN RULES FOR YM
> **"YM rewards patience. Wait for the confluence—it's worth it."**
> **"Low volatility means you can size up. One good trade beats five forced trades."**
> **"Score 7+ is your edge. Anything less is gambling."**
> **"The zone + tier combo is your bread and butter. Master it."**
> **"Leave every trade with money. YM gives you time to manage."**
---
## 📊 VISUAL GUIDE
```
PERFECT YM SNIPER SETUP:
═══════════════════════════════════════════════════════════════════
│ Current Price
│
┌─────────────────────────┴────────────────────────────┐
│ BEARISH ZONE (Red) │
│- - - - - - - CE Line (Entry for shorts) - - - - - - │
│ │
└──────────────────────────────────────────────────────┘
│
══════════════════╪══════════════════ SP High (Purple)
│
┌─────────────────────┤
│█████████████████████│ ← A🎯 LONG Signal
│█████████████████████│ Score: 8/10
│ ●──────────────────│ ← POC (Gold) near bottom = STRONG
│█████████████████████│
│█████████████████████│
└─────────────────────┤
│
══════════════════╪══════════════════ SP Low (Purple)
│
┌─────────────────────────┴────────────────────────────┐
│ BULLISH ZONE (Green) │
│- - - - - - - CE Line (Entry for longs) - - - - - - -│
│██████████████████████████████████████████████████████│
└──────────────────────────────────────────────────────┘
│
Stop Loss
CONFLUENCE CHECK:
✓ A-Tier signal (+2)
✓ At edge of bullish zone (+2)
✓ POC at bottom of candle (+1)
✓ Strong volume 2.3x (+1)
✓ Delta 72% buyers (+1)
✓ CVD bullish (+1)
TOTAL: 8/10 = ELITE SETUP
ACTION: Full size LONG at signal candle close
STOP: Below zone bottom
TARGET: 2:1 R:R (auto-calculated)
```
---
## 🔧 TROUBLESHOOTING
| Issue | Cause | Fix |
|-------|-------|-----|
| No signals appearing | Score too high | Lower min score to 4-5 |
| Too many signals | Score too low | Raise min score to 6+ |
| Zones cluttering chart | Max zones high | Reduce to 8-10 |
| POC not showing | Tiered filter on | Check "POC Only Tiered" |
| Session not highlighting | Wrong timezone | Verify timezone setting |
| Alerts not firing | Not configured | Set up in TradingView alerts |
---
## 📝 PINE SCRIPT V6 TECHNICAL NOTES
This indicator uses advanced features:
- **User Defined Types (UDT)**: Clean state management for zones/imbalances
- **`request.security_lower_tf()`**: Intrabar volume analysis
- **Dynamic Array Management**: Efficient memory for drawings
- **Confluence Scoring Engine**: Multi-factor signal qualification
- **Auto Stop/Target**: Dynamic risk management calculation
**Minimum TradingView Plan:** Pro (for intrabar data access)
---
*© Alexandro Disla - YM Ultimate SNIPER*
*Pine Script v6 | TradingView*
*Unified GRA v5 + DeepFlow Zones | YM-Optimized*
