SET13_INDEXThe average RSI of top 13 marketcaptilization in SET50, as list by below.
1. PTT
2. AOT
3. ADVANC
4. CPALL
5. GULF
6. PTTEP
7. SCC
8. SCB
9. KBANK
10. BDMS
11. EA
12. OR
13. SCGP
Note that OR started trading on February 2021 so that the indicator will not appear before that period and
the top 13 marketcapiliation ranked on 22 February 2022 so pls becareful about look ahead bias.
Komut dosyalarını "宁德时代2021年净利润+资产负债率" için ara
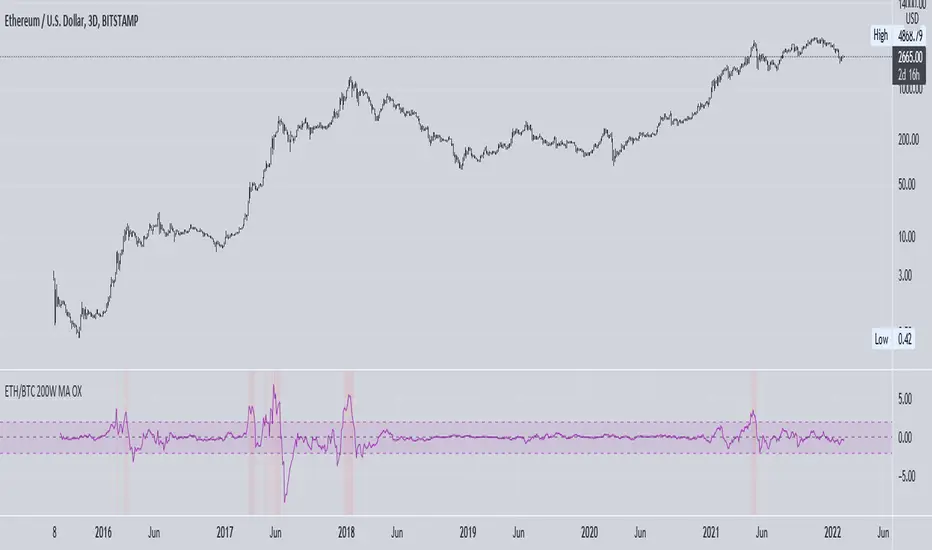
ETH vs BTC 200W SMA OverextensionHistorically, when BTC suffers a correction and ETH continues to rally, this hints at an impending market-wide correction. In Jan 2018, ETH rallies while BTC corrects, signalling the end of the bull cycle. In May 2021, ETH rallies while BTC ranges between $50-$60k, then a major correction occurs. This indicator attempts to monitor this phenomenon in order to help spot potential macro tops in the cryptocurrency market.
The indicator takes the price of the asset and divides it by the 200 week SMA value. This gives an over/undervaluation in percentage terms. When ETH becomes significantly more overvalued relative to BTC, the indicator will warn of a potential top forming (see red shaded areas).
This is for edutainment purposes only. Don't make financial decisions based on this indicator.
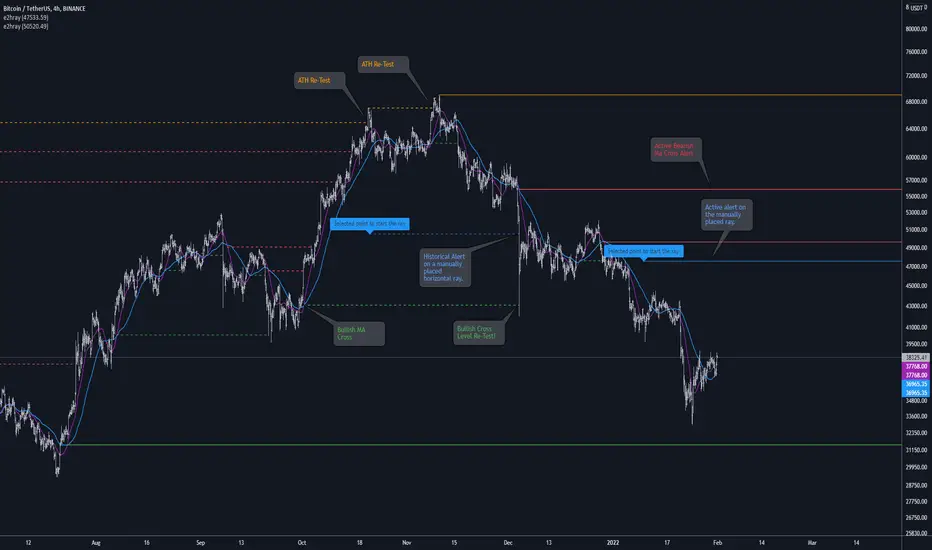
[e2] Drawing Library :: Horizontal Ray█ OVERVIEW
Library "e2hray"
A drawing library that contains the hray() function, which draws a horizontal ray/s with an initial point determined by a specified condition. It plots a ray until it reached the price. The function let you control the visibility of historical levels and setup the alerts.
█ HORIZONTAL RAY FUNCTION
hray(condition, level, color, extend, hist_lines, alert_message, alert_delay, style, hist_style, width, hist_width)
Parameters:
condition : Boolean condition that defines the initial point of a ray
level : Ray price level.
color : Ray color.
extend : (optional) Default value true, current ray levels extend to the right, if false - up to the current bar.
hist_lines : (optional) Default value true, shows historical ray levels that were revisited, default is dashed lines. To avoid alert problems set to 'false' before creating alerts.
alert_message : (optional) Default value string(na), if declared, enables alerts that fire when price revisits a line, using the text specified
alert_delay : (optional) Default value int(0), number of bars to validate the level. Alerts won't trigger if the ray is broken during the 'delay'.
style : (optional) Default value 'line.style_solid'. Ray line style.
hist_style : (optional) Default value 'line.style_dashed'. Historical ray line style.
width : (optional) Default value int(1), ray width in pixels.
hist_width : (optional) Default value int(1), historical ray width in pixels.
Returns: void
█ EXAMPLES
• Example 1. Single horizontal ray from the dynamic input.
//@version=5
indicator("hray() example :: Dynamic input ray", overlay = true)
import e2e4mfck/e2hray/1 as e2draw
inputTime = input.time(timestamp("20 Jul 2021 00:00 +0300"), "Date", confirm = true)
inputPrice = input.price(54, 'Price Level', confirm = true)
e2draw.hray(time == inputTime, inputPrice, color.blue, alert_message = 'Ray level re-test!')
var label mark = label.new(inputTime, inputPrice, 'Selected point to start the ray', xloc.bar_time)
• Example 2. Multiple horizontal rays on the moving averages cross.
//@version=5
indicator("hray() example :: MA Cross", overlay = true)
import e2e4mfck/e2hray/1 as e2draw
float sma1 = ta.sma(close, 20)
float sma2 = ta.sma(close, 50)
bullishCross = ta.crossover( sma1, sma2)
bearishCross = ta.crossunder(sma1, sma2)
plot(sma1, 'sma1', color.purple)
plot(sma2, 'sma2', color.blue)
// 1a. We can use 2 function calls to distinguish long and short sides.
e2draw.hray(bullishCross, sma1, color.green, alert_message = 'Bullish Cross Level Broken!', alert_delay = 10)
e2draw.hray(bearishCross, sma2, color.red, alert_message = 'Bearish Cross Level Broken!', alert_delay = 10)
// 1b. Or a single call for both.
// e2draw.hray(bullishCross or bearishCross, sma1, bullishCross ? color.green : color.red)
• Example 3. Horizontal ray at the all time highs with an alert.
//@version=5
indicator("hray() example :: ATH", overlay = true)
import e2e4mfck/e2hray/1 as e2draw
var float ath = 0, ath := math.max(high, ath)
bool newAth = ta.change(ath)
e2draw.hray(nz(newAth ), high , color.orange, alert_message = 'All Time Highs Tested!', alert_delay = 10)
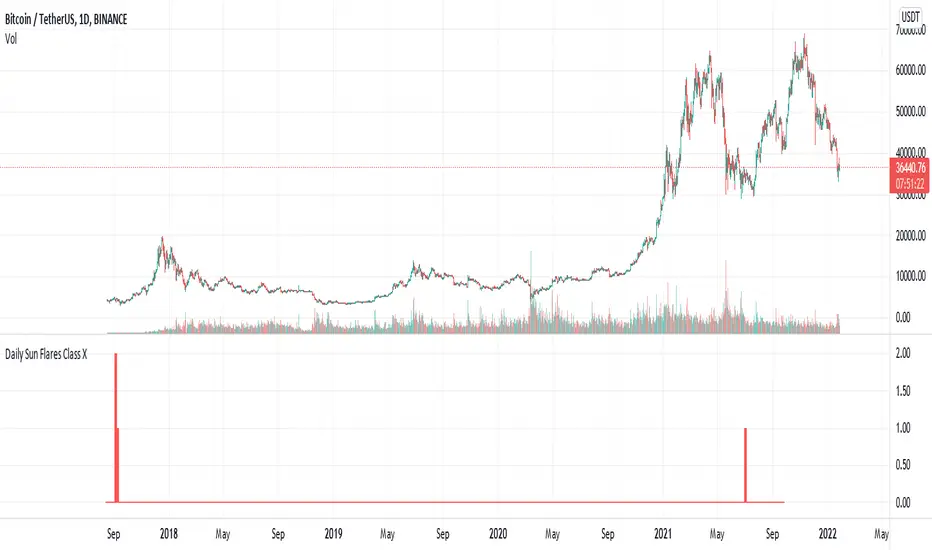
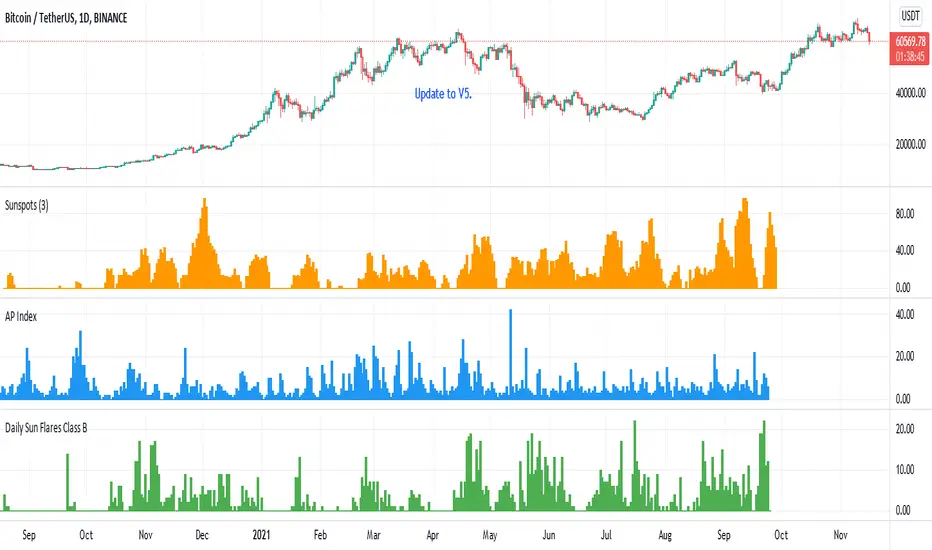
Daily Sun Flares Class XThe classification system for solar flares uses the letters A, B, C, M or X, according to the peak flux as measured at the Earth by the GOES spacecraft.
These are daily Class X sun flares. The data was created by counting daily flares of this class based on the peak time of the flare.
2015-01-01 until 2021-08-25
Percentage Levels by TimeframePlots the positive and negative percentage levels from a selection of timeframes and sources for any ticker. You can use this within a pullback trading system. For example, if you historically look at the average pullback of large cap stocks and ETF's, you can use this indicator to plot the levels it could pullback to for an entry to go long. It can be used as potential targets when trading a ticker short. Another use for this is to backtest the set percentage targets using TradingView's bar replay feature to see how ETF's and large cap stocks have reacted at these levels. Note: This is intended to be used at timeframes equal to higher than the chart's as it may cause re-painting issues.
Currently percentage levels are statically set to 1, 3, 5, 10, 15, 20, 25, and 30% levels above and below the chosen source (open, high, low, close). You can also display the data based on timeframes from Daily (1D) all the way up to Yearly (12M)
*Not financial advice but in my opinion the current percentage levels set (see above) are best used for ETF's and Large Cap Stocks.
Jan 2
Release Notes: Added the ability to select the historical bars to look back when plotting levels
Jan 2
Release Notes: To get a better display or proper resolution on your charts, change the view settings to "Scale Price Chart Only"
Jan 2
Release Notes: To add % labels for this indicator on the price axis, change your chart settings to include "Indicator Name Label" & "Indicator Last Value". You can find this under the Label section after hitting the gear icon in the bottom right of your chart.
Jan 2
Release Notes: Added: Custom Line Plot Extension Settings. Ideally both values should be equal to display optimal extended lines. To return to a base setting: '1' = Historical Lookback & '0' = Offset Lines. Also note this is dependent on the timeframe you are viewing on the chart.
Jan 2
Release Notes: Removed indicator from example chart that was not needed.
Jan 2
Release Notes: Updated some comments in the Pine Script
Jan 2
Release Notes: Update: Added commentary and instructions in the indicator settings to address recommended line plot settings for Stocks/ETF's vs Futures
Jan 2
Release Notes: Changed title from "Calculation Method" to "Calculation Source"
Jan 4 2021
Normal use of security() dictates that it only be used at timeframes equal to or higher than the chart's as it may cause re-painting

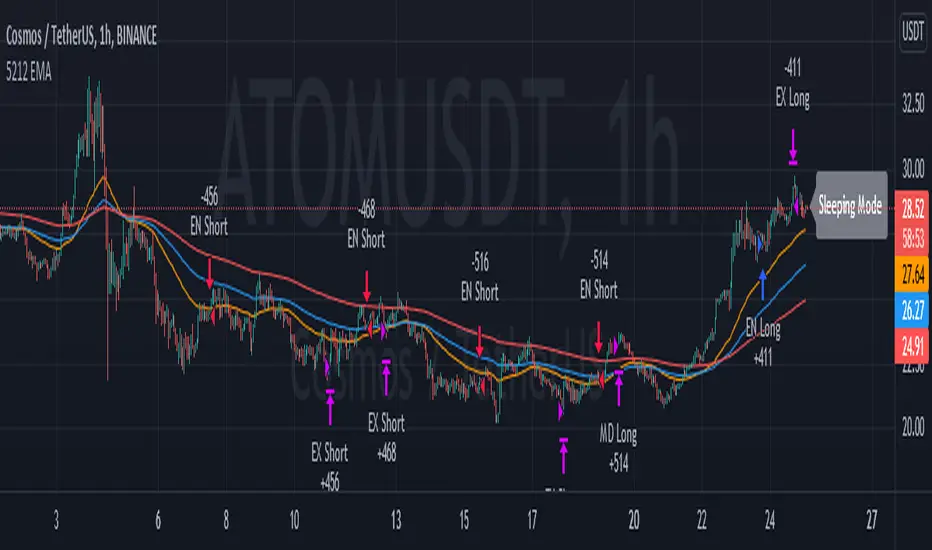
5212 EMA Strategyver 01
23 December 2021
This strategy using :
- 3 EMA period 50, 100, 200
- stochastic RSI slow
Long Cond :
- Stochastic RSI cross below 20
- EMA 50 > 100 > 200
Short Cond :
- Stochastic RSI cross above 80
- EMA 50 < 100 < 200
Sleeping Mode
- EMA 50 between EMA 100 & EMA 200
F&G_IndexIntroduction.
This indicator shows the behavior of Fear and Greed Index (F&G_Index) for the cryptocurrency market in an intuitive way for traders. This indicator has been modified from a script developed by @cptpat called "Fear and Greed Index FGI (Daily Update) alternative.me" (Tradingview user). The Fear and Greed Index values are taken directly from alternative.me.
The novelty of this proposal is to indicate the extreme levels (lower/upper) of the Fear and Greed Index according to a statistical analysis of the historical data. Also its daily update. It is not recommended to use in isolation. The appropriate way is in consensus with other indicators.
The extreme values.
Two upper and lower limits are established that correspond to the first standard deviation (1·SD) and 1.5 standard deviation (1.5·SD), respectively. These limits will help to know different important levels of greed or fear in the market based on real and historical data. The values obtained for each case are shown below, which will mark the extremes. These values may be modified in the future. If so, they will be updated and the community will be informed.
1·SD higher = 69 (F&G_Index).
1·SD lower = 24 (F&G_Index).
1.5·SD higher = 81 (F&G_Index).
1.5·SD lower = 12 (F&G_Index).
These limits are statistically significant and representative of extreme values of the Fear and Greed Index. Above all, for the case of 1.5·SD higher/lower, whose occurrence of the cases are significantly lower. These data are obtained for a daily record from August 2017 to December 2021, for a total of 1407 data. The occurrence of the Fear and Greed Index value exceeding the indicated levels is shown below.
F&G_Index > 1·SD higher (Greed). Occurrence <22,5%
F&G_Index < 1·SD lower (Fear). Occurrence <19%
1·SD lower < F&G_Index < 1·SD higher (Neutral). Occurrence ≈59%
F&G_Index > 1.5·SD higher (Extreme Greed). Occurrence <8%
F&G_Index < 1.5·SD lower (Extreme Fear). Occurrence <3%
How to use the indicator.
Its use is very simple and intuitive and is based on the levels indicated above. The blue line shows the historical value of F&G_Index. When the value of F&G_Index exceeds the levels indicated above, a vertical band of color will be tinted (brown/red, green/lime green or gray with transparency) as indicated below. This allows you to locate important areas in a very visual way.
F&G_Index > 1·SD higher (Greed). Brown color
F&G_Index < 1·SD lower (Fear). Green color.
1·SD lower < F&G_Index < 1·SD higher (Neutral). Gray color with transparency.
F&G_Index > 1.5·SD higher (Extreme Greed). Red color.
F&G_Index < 1.5·SD lower (Extreme Fear). Lime green color.
Image of the indicator.

60-Day Accumulated Increasing RateIs this Bitcoin bull run still driven by new investors and new funds? Definitely. That’s why the 60-day accumulative increasing rate is so important and it can even determine everything. The only thing that can be trusted is the math. In history, each capital inflow uptrend bull run has ended once the 60-day accumulative increasing rate reached a high level and when the short-term euphoric investors push BTC price to rise at a fast speed and use up all kinds of leverages. At that point, there’s no time for new investors and new funds to flow in, thus the cryptocurrency market will crash from the global top.
In that sense, the crashes on 4th September, 2017 and 19th May, 2021 didn’t end the bull run, instead,they lengthened the bull run span.The last bull run cycle (2017) might have ended prematurely when BTC reached $10,000, recording 150% accumulated increase over 60 days. Then BTC won’t be pumped up to $20,000 if the course wasn’t interrupted by September 4th, 2017 incident.
Technical analysts(they are far from trustworthy, full of bollocks) call the correction of BTC: “consolidation or wipeout”, just like that diabetes is called as Liver Qi Stagnation, weight lossing, being thirsty and other symptoms. It’s quite fun to watch so many people explaining it in a false concept. Everyone knows what the maths is. That’s enough.
PS: This indicator can only be applied to Bitcoin daily chart!

CRC.lib Log FunctionsLibrary "CRCLog"
default_params() Returns default high/low intercept/slope parameter values for Bitcoin that can be adjusted and used to calculate new Regression Log lines
log_regression() Returns set of (fib) spaced lines representing log regression (default values attempt fitted to INDEX:BTCUSD genesis-2021)

A simple trading strategy for XTZ/EUR (December 2021)This is my current trading strategy for XTZ/EUR for this month of December.
It tries to avoid pumps/dumps (i.e. does not trade on big candles).
It always performs one order in each candle for the trading window of the rebalance bear/bull market indicator (check my profile for it).
It has alerts configured so that you can use it in your server/broker (just pass along the `{{strategy.order.alert_message}}` in the alert message, it will include a positive number of XTZ when to buy, or a negative number when to sell).
It does not repaint.
The amount of crypto and fiat in the portfolio can be configured in the cog.
It does not outperform buy/hold for the bull months.
Check the results in the Data Window of Trading View (please avoid the Strategy Tester, it has too many bugs and is not intended for out of the box strategies such a this one).
All code is open source.

Half-Pi Cycle CKB top indicator (insanely experimental)This is an insanely experimental script. It's a modified version of the Bitcoin pi-cycle top indicator.
It changes the Bitcoin pi-cycle top formula by halving the number of days in the two DMAs used in calculation, from 350/111 to 175/56. So I call it the half-pi cycle. It correctly picked the top of CKB (Nervos Network) vs USDT on Huobi in spring 2021 within three days.
It probably is a coincidence, and could very easily not pick the next cycle peak correctly at all. Using such a short number of days makes it a little dubious, but I had no choice since there's only so much price history for this coin. I strongly advise you to not make any trades based on this script ! I cannot be held accountable if you lose money due to this script. It hasn't been shown to be accurate multiple times like the Bitcoin pi-cycle top indicator. I simply find this interesting and want to see if it works next time.

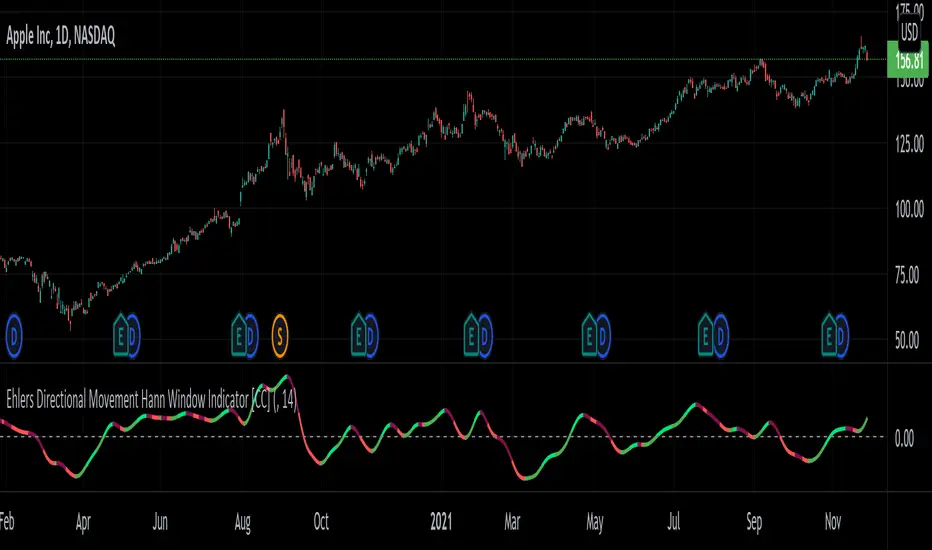
Ehlers Directional Movement Hann Window Indicator [CC]The Directional Movement Hann Window Indicator was created by John Ehlers (Stocks and Commodities Dec 2021 pgs 17-18) and this is his updated version of the classic Directional Movement indicator created by J. Welles Wilder. Ehlers uses the Hann Window Filtering after using an exponential moving average to smooth the classic directional movement indicator. This helps significantly with the lag and lack of smoothing which are both issues with the classic indicator. I have included strong buy and sell signals in addition to the normal ones so strong signals are darker in color and normal signals are lighter in color. Buy when the line turns green and sell when it turns red.
Let me know if there are any other indicators you would like to see me publish!
Daily Sun Flares Class AThe classification system for solar flares uses the letters A, B, C, M or X, according to the peak flux as measured at the Earth by the GOES spacecraft.
These are daily Class A sun flares. The data was created by counting daily flares of this class based on the peak time of the flare.
2015-01-01 until 2021-08-25
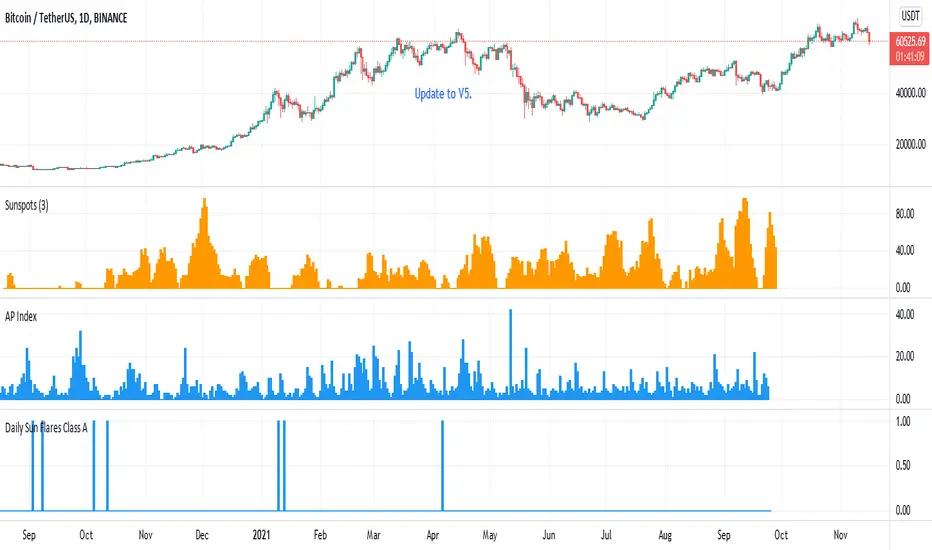
Daily Sun Flares Class BThe classification system for solar flares uses the letters A, B, C, M or X, according to the peak flux as measured at the Earth by the GOES spacecraft.
These are daily Class B sun flares. The data was created by counting daily flares of this class based on the peak time of the flare.
2015-01-01 until 2021-08-25
Bitcoin Bull Runs Mid Cycle Aligned This script plots 2 lines which are the 2013 and 2016 bull run. The plots are aligned on their mid cycles to the 2021 mid cycle.
Settings:
You can move the plots on the x and y axis in the settings for the Daily, Weekly and Monthly TFs.
The plot is weird on the Monthly TF, best to use the Daily and Weekly.
If it doesn't load at first you have to zoom out fully and go back to 2013 for it to load. Then it will load.

Ripple (XRP) Model PriceAn article titled Bitcoin Stock-to-Flow Model was published in March 2019 by "PlanB" with mathematical model used to calculate Bitcoin model price during the time. We know that Ripple has a strong correlation with Bitcoin. But does this correlation have a definite rule?
In this study, we examine the relationship between bitcoin's stock-to-flow ratio and the ripple(XRP) price.
The Halving and the stock-to-flow ratio
Stock-to-flow is defined as a relationship between production and current stock that is out there.
SF = stock / flow
The term "halving" as it relates to Bitcoin has to do with how many Bitcoin tokens are found in a newly created block. Back in 2009, when Bitcoin launched, each block contained 50 BTC, but this amount was set to be reduced by 50% every 210,000 blocks (about 4 years). Today, there have been three halving events, and a block now only contains 6.25 BTC. When the next halving occurs, a block will only contain 3.125 BTC. Halving events will continue until the reward for minors reaches 0 BTC.
With each halving, the stock-to-flow ratio increased and Bitcoin experienced a huge bull market that absolutely crushed its previous all-time high. But what exactly does this affect the price of Ripple?
Price Model
I have used Bitcoin's stock-to-flow ratio and Ripple's price data from April 1, 2014 to November 3, 2021 (Daily Close-Price) as the statistical population.
Then I used linear regression to determine the relationship between the natural logarithm of the Ripple price and the natural logarithm of the Bitcoin's stock-to-flow (BSF).
You can see the results in the image below:
Basic Equation : ln(Model Price) = 3.2977 * ln(BSF) - 12.13
The high R-Squared value (R2 = 0.83) indicates a large positive linear association.
Then I "winsorized" the statistical data to limit extreme values to reduce the effect of possibly spurious outliers (This process affected less than 4.5% of the total price data).
ln(Model Price) = 3.3297 * ln(BSF) - 12.214
If we raise the both sides of the equation to the power of e, we will have:
============================================
Final Equation:
■ Model Price = Exp(- 12.214) * BSF ^ 3.3297
Where BSF is Bitcoin's stock-to-flow
============================================
If we put current Bitcoin's stock-to-flow value (54.2) into this equation we get value of 2.95USD. This is the price which is indicated by the model.
There is a power law relationship between the market price and Bitcoin's stock-to-flow (BSF). Power laws are interesting because they reveal an underlying regularity in the properties of seemingly random complex systems.
I plotted XRP model price (black) over time on the chart.
Estimating the range of price movements
I also used several bands to estimate the range of price movements and used the residual standard deviation to determine the equation for those bands.
Residual STDEV = 0.82188
ln(First-Upper-Band) = 3.3297 * ln(BSF) - 12.214 + Residual STDEV =>
ln(First-Upper-Band) = 3.3297 * ln(BSF) – 11.392 =>
■ First-Upper-Band = Exp(-11.392) * BSF ^ 3.3297
In the same way:
■ First-Lower-Band = Exp(-13.036) * BSF ^ 3.3297
I also used twice the residual standard deviation to define two extra bands:
■ Second-Upper-Band = Exp(-10.570) * BSF ^ 3.3297
■ Second-Lower-Band = Exp(-13.858) * BSF ^ 3.3297
These bands can be used to determine overbought and oversold levels.
Estimating of the future price movements
Because we know that every four years the stock-to-flow ratio, or current circulation relative to new supply, doubles, this metric can be plotted into the future.
At the time of the next halving event, Bitcoins will be produced at a rate of 450 BTC / day. There will be around 19,900,000 coins in circulation by August 2025
It is estimated that during first year of Bitcoin (2009) Satoshi Nakamoto (Bitcoin creator) mined around 1 million Bitcoins and did not move them until today. It can be debated if those coins might be lost or Satoshi is just waiting still to sell them but the fact is that they are not moving at all ever since. We simply decrease stock amount for 1 million BTC so stock to flow value would be:
BSF = (19,900,000 – 1.000.000) / (450 * 365) =115.07
Thus, Bitcoin's stock-to-flow will increase to around 115 until AUG 2025. If we put this number in the equation:
Model Price = Exp(- 12.214) * 114 ^ 3.3297 = 36.06$
Ripple has a fixed supply rate. In AUG 2025, the total number of coins in circulation will be about 56,000,000,000. According to the equation, Ripple's market cap will reach $2 trillion.
Note that these studies have been conducted only to better understand price movements and are not a financial advice.

Gherkinit Futures Cycle█ OVERVIEW
Presented here is code for the " NYSE:GME Futures cycle theory" originally conceived by Gherkinit (Pi-Fi) and his quantitative analysts which is still under peer review.
This theory was built upon the knowledge that many intelligent investors on Reddit accrued over the past year in regards to the Mother Of All Short Squeezes this stock has to offer.
Up until now, what happened in January 2021 was considered an anomaly brought on by FOMO and retail interest but it's starting to look like unfair market makers and similar went to cover and ran head on into retail FOMO which is why they cut off the buying at that time. In order to understand what happened and what's to come, visualizing the theory with ease is essential.
█ WHAT THE SETTINGS MEAN
- Enable Draw | Visual Clean up
(True/False) Quarterly dates : Enables or disables the quarterly dates that repeat every "cycle".
(True/False) Roll dates : Enables or disables the roll dates that repeat every "cycle".
(True/False) Expiration dates : Enables or disables the expiration dates that repeat every "cycle".
(True/False) Run dates : Enables or disables the run dates that repeat every "cycle".
- Date Colors | Making things look good
(Color) Quarterly : Color for the respective date.
(Color) Roll : Color for the respective date.
(Color) Expiration : Color for the respective date.
(Color) Run : Color for the respective date.
- Extended Cycle | Look into the future
(Integer) Extended line height multiplier : A multiplier value for the height of the lines representing the selected "future" cycle.
(Dollar Amount) Extended line height : The height value in dollars of the lines representing the selected "future" cycle.
(Integer) Extended line width : The width of the lines representing the selected "future" cycle.
(Integer) Extended cycle ID : The cycle you want to see "ahead" or in the "future". For example if you set the value to "0" you'll only see cycles from the past up until the present (already occurred). If you set the value to "1" you will see the estimated dates for the specific cycle in the future i.e. 1 cycle ahead of the last completed/visible cycle on the chart.
█ EXTRA INFO
This indicator was simply made by a bored CS student who didn't want to endlessly mark dates on a graph after learning more about the theory.
Hope this help whoever uses this. To the moon fellow apes!
- Winter ;)
P.s. Pickle 4 Life

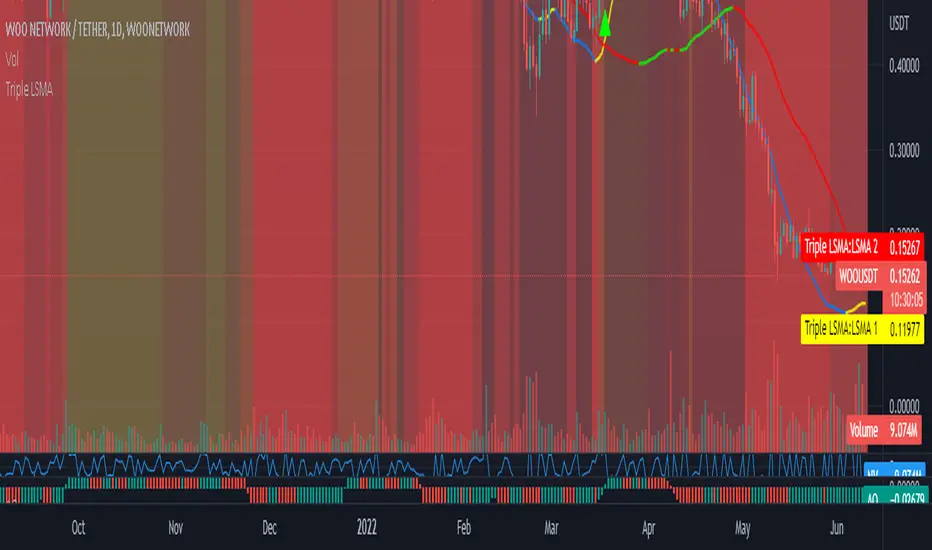
Triple Colored Least Squares Moving Average + Crossover AlertsThis script is forked from the ‘ Double Colored Least Squares Moving Average + Crossover Alerts ‘ from @IronKnightmare.
First release & notes : 2021-11-03.
Overview:
The Least Squares Moving Average is used mainly as a crossover signal to identify bullish or bearish trends. When a shorter duration line cross a longer one a trend can be identified. When multiple lines or the price action cross a longterm trend the confirmation can be further validated. Tradingview contains already some indicators with 1 or two LSMA trendlines that can be configured and toggled.
The original script that I forked had two LSMA lines that could be plotted with other valuable functions, I added a third for further confirmation as some trading systems will use three lines or some combination of those for validation.
Usage:
In inputs
- You will see LSMA 1, LSMA 2 & LSMA 3. The default values are 40, 100 & 400 representing the number of periods plotted by that line : fast, medium and slow changing trendlines will be plotted. The offset value and source are standard for most scripts.
In Style
- You can toggle LSMA 1, 2 or 3 and any combination of those. There are much more possibilities this way.
- For each LSMA, Color 0 & Color 1 are for coloring the slope of the trendline,
- Color 0 for rising slope,
- Color 1 for descending slope.
- The script will automatically color the rise or fall of the trendline accordingly. You can also set one identical color in both slopes for one unique color.
- The ‘ Long Crossover 1 on 2 ’ is a signal for when the LSMA 1 cross over the LSMA 2, usually a shorter periods trendline, more volatile, climbing over the medium term one. A Signal will be traced on the chart at that crossing, you can configure this. The ‘Short Crossover 1 on 2’ is when the LSMA 1 cross under the LSMA 2, a signal will be traced on the chart accordingly.
- The Long Crossover 1 on 3 & Short Crossover 1 on 3 act on the same principle, although the crossing of the fast LSMA on the long / slow LSMA are used. Both can be toggled.
- The ‘ Background Coloring Line 1 : 0-Neutral, 1-Up, 2-Down ’ is an optional background coloring for the LSMA1 line. This can provide additional information at a quick glance, especially if you combine the two other lines backgrounds, the partial transparency will compound.
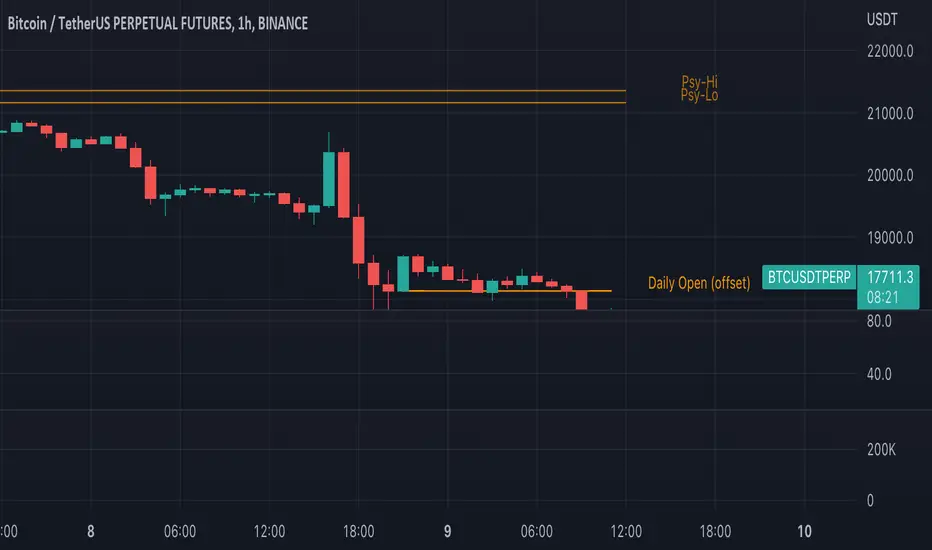
Traders Reality Psy Levels/Daily Open GMT AwareTraders Reality Psy Levels/Daily Open GMT Aware
This indicator serves as the Tradingview equivalent of an MT4 indicator suite (Psy Levels and Daily Open)
Functionality:
In general we define Asia session to start with the Sydney exchange open.
For all intends and purposes for this indicator Asia session is defined as the open of the NZX market and close of the ASX market according to the 24 hour market clock.
The Daily Open is defined as the open of the Asia session.
The Psychological High and Low are defined as the first high and first low the Asian session starting at Saturday night and going into Sunday morning.
These are 2 key confluences that can be used in various strategies. These are in some sense similar to pivot points.
The script is GMT ( UTC ) offset aware meaning you can adjust the start of the day to any point within the allowed GMT offsets (-12 to 14)
For example if your exchange timezone is UTC+0 then the start of the Asia session starts at 2000 (UTC+0) and ends at 0400 (UTC+0) when Sydney if not in DST
You will set the offset to 4. When Sydney is in DST you will set the offset to 3
Naturally since the offset allows the entire range of GMT offsets to be used you do not need to choose the Asia market as the start of the day.
The default setting is set to 4 as of Nov 1st 2021
The GMT offset puts the calculation in the correct place regardless of exchange timezone so you do not need to adjust any settings
when working with exchanges not on UTC+0
Psy levels works only on exchanges that are open on the weekends that provide with 24x7 data.
The GMT offset puts the calculation in the correct place regardless of exchange timezone.
Features:
1) Plot the current Daily Open for timeframes between 4 hour and 1 min.
2) Plot the current weekly Psychological High and Low for timeframes between 4 hour and 1 min.
3) Configurable GMT offset, default set to Sydney open (as defined above)
4) Toggle to show historical Daily Open values (line)
5) Toggle to show historical Psychological High and Low values (line)
6) Turn labels on and off
7) Change line/label colors
Foot notes:
Use at your own risk and your own responsibility. No guarantees are provided and no responsibility is assumed by the developers of this script.
Original @plasmapug, additional edits (with permission) by @infernixx and @Peshocore
INSECURITY() from @JayRogers (enhanced for gmt offset)
TradingGroundhog - Strategy & Fractal V1#-- Public Strategy - No Repaint - Fractals -- Short term
Here I come with another script, more simple than Wavetrend V1. You will love it.
#-- Synopsis --
Another simple idea, on a small time frame (15 min) we buy when the opening price goes below a Bottom fractals and sell when it goes over a Top fractals, but as this script do not use Wavetrends. You should stop by your self to use the script during long lasting downtrends.
I developed the strategy using BTC /EUR 3 MIN BINANCE but it can be applied to many other cryptos, I don't know for forex or others. You can use it for short term (to a month of uptrend) and automated trading.
#-- Graph reading --
And now, how to read it ?
Fractals:
Yellow Flags occur when the opening price goes below a Bottom fractal , it means Buy.
White Flags appear when the opening price goes over a Top fractal , it means Sell.
#-- Parameters --
*** Parameters have been intensively optimized using 10 cryptocurrency markets in order to have potent efficiency for each of them. I would recommend to only change the Can Be touch parameter. For the others, I don't recommend any modifications. The idea behind the script is to be able to switch between markets without having to optimize parameters, less work, easy to target active crypto and therefor limit the risks. ***
Can be touch :
'Filter fractals' : Activate or Disable the filtering fractal operation. If Enable, buy during less risky periods. (Activate is often better)
Can be touch but not necessary :
'VolumeMA' : The Volume corrector used by the fractals
'Extreme window' : The number of price individuals to look for if we want to remove extreme fractals.
Not to touch :
'Long Sop Loss (%)' : The minimal difference of price between a Fractal bottom and the opening price to buy.
#-- Time frame --
Should be used with the following time frames depending on the necessity:
1 MIN
3 MIN (Preferred with the parameters set)
5 MIN
#-- Last words --
The script can be set up to send Tradingview signals to 3comma just by adding comment = " " in strategy.close_all() and strategy.entry().
Good trades !
Disclaimer (As it should always be one to any script)
***
This script is intended for and only to be used for personal purposes only. No such information provided by it constitutes advice or a recommendation for any investment or trading strategy for any specific person. There is no guarantee presented or implied as to the accuracy of specific forecasts, projections, or predictive statements offered by the script. Users of the script agree that its original developer does not take responsibility for any of your investment decisions. Please seek professional advice before trading.
***
# Here are the results from the 20rst of September 2021 with 100% of equity on the BTC /EUR 3 Min and with a capital of 10 000 EUR. So almost, one month.
# As I saw, it goes from +30% to more than +160% (the great SHIB) depending on the selected crypto. It may be negative if you spot a downtrend.

TradingGroundhog - Strategy & Wavetrend V2#-- Public Strategy - No Repaint - Fractals - Wavetrend --
Here I come with another script, a nice and simple strategy based on fractals and Wavetrends.
#-- Synopsis --
A simple idea, on a small time frame (15 min) we buy when the opening price goes below a Bottom fractals and sell when it goes over a Top fractals, but in order to avoid bad and evil downtrends, we use Wavetrends based on a Daily time frame. From it, Tops and Bottoms are extracted. If the opening price goes above Wavetrend Tops, no trades will be conducted during the day. If the price goes below Wavetrend bottoms, no trades will be executed from 1 to N days, until a new Wavetrend bottom is generated.
I developed the strategy using BTC /EUR 15 MIN BINANCE but it can be applied to many other cryptos, I don't know for forex or others. You can use it for long term and automated trading, I implemented the Wavetrend indicator to do so, or for short term if you have spot a long coming uptrend. Test it, look at its profit and long or short period on your crypto of choice.
#-- Graph reading --
And now, how to read it ?
Wavetrends:
Red Backgrounds are associated to No Trade periods. These periods occur when the price goes below a Wavetrend bottom or above a Wavetrend Top. They are here to limit the loss.
Blue Gradient lines represent the past Tops. For each bar, only the increasing values of the Wavetrend tops are acquired. Going from light to dark blue based on the age of the Tops. Thus, if on line goes from dark to light, this means the price is approaching a previous Wavetrend top. In the opposite, if it darken, thus the price say 'buy buy' and go dropping.
Yellow Gradient lines represent the past Bottoms. They are based on the same principe that the blue lines.
Fractals:
Yellow Flags occur when the opening price goes below a Bottom fractal , it means Buy.
White Flags appear when the opening price goes over a Top fractal , it means Sell.
#-- Parameters --
*** Parameters have been intensively optimized using 10 cryptocurrency markets in order to have potent efficiency for each of them. I would recommend to only change the Can Be touch parameter. For the others, I don't recommend any modifications. The idea behind the script is to be able to switch between markets without having to optimize parameters, less work, easy to target active crypto and therefor limit the risks. ***
Can be touch :
'Combined Smoothness' : The number of open individuals used by the Wavetrend. (6 or 9, often 9 is better but with less volatile crypto it will be 6)
'Filter fractals' : Activate or Disable the filtering fractal operation. If Enable, buy during less risky periods. (Disable is often better)
Can be touch but not necessary :
'VolumeMA' : The Volume corrector used by the fractals
'Extreme window' : The number of price individuals to look for if we want to remove extreme fractals.
Not to touch :
'Limit_candle to look on' : Number of candles to use to compute the Wavetrend Tops and Bottoms.
'Length top bottom drawn' : Size of the lines
'Long Sop Loss (%)' : The minimal difference of price between a Fractal bottom and the opening price to buy.
#-- Time frame --
Should be used with the following time frames depending on the necessity:
1 MIN
3 MIN (Interesting for short term profit, may need some parameter ajustements)
5 MIN
15 MIN (Preferred for long term profit, the script was developed on it)
#-- Last words --
The script can be set up to send Tradingview signals to 3comma just by adding comment = " " in strategy.close_all() and strategy.entry().
Good trades !
Disclaimer (As it should always be one to any script)
***
This script is intended for and only to be used for personal purposes only. No such information provided by it constitutes advice or a recommendation for any investment or trading strategy for any specific person. There is no guarantee presented or implied as to the accuracy of specific forecasts, projections, or predictive statements offered by the script. Users of the script agree that its original developer does not take responsibility for any of your investment decisions. Please seek professional advice before trading.
***
# Here are the results from the 1rst of July 2021 with 100% of equity on the BTC /EUR 15 Min and with a capital of 1 000 EUR.
# As I saw, it goes from +20% to more than +100% depending on the selected crypto. Sometimes it's negative but it's quite rare on crypto using the EUR.

Anchored VWAP ClickIt calculates AVWAP set from a mouse click on a chart instead of having to edit a popup box, manually transferring date and time from the chart.
It's the Oct 2021 sample script from Tradingview to demonstrate their new chart interactive capabilities of Pine script.
www.tradingview.com
I take no credit for this, just noticed it wasn't in the Public Library.
This ability to accept OnMouse positional data from the chart, into an indicator has been needed in TV for a long time.
Glad to see they continue to grow the capabilities.

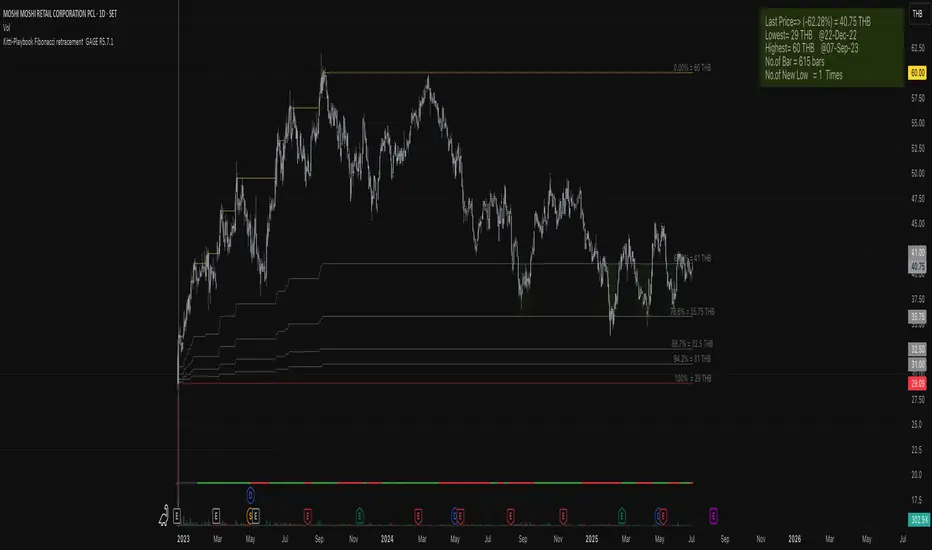
Kitti-Playbook Fibonacci retracement GAGE R0.00
Release Notes: Oct 25 2021
OVERVIEW :Kitti-Playbook Fibonacci retracement GAGE R0.00
Easy for visualize Fibonacci retracement level
CONCEPTS
1)Minimum Line = Lowest level of Source form start
2)Maximum Line = Highest level of Source form New Low
3)Calculation
a) Fibonacci Retracement of 61.8% form Maximum level
b) Fibonacci Retracement of 78.6% form Maximum level
c) Fibonacci Retracement of 88.7% form Maximum level
d) Fibonacci Retracement of 94.2% form Maximum level
4)Information Display
a) Information Bar show Number of New Low , Max level , Min Level , Last Bar No, Current Pricel
b) GAGE Scale Number
c) New Low