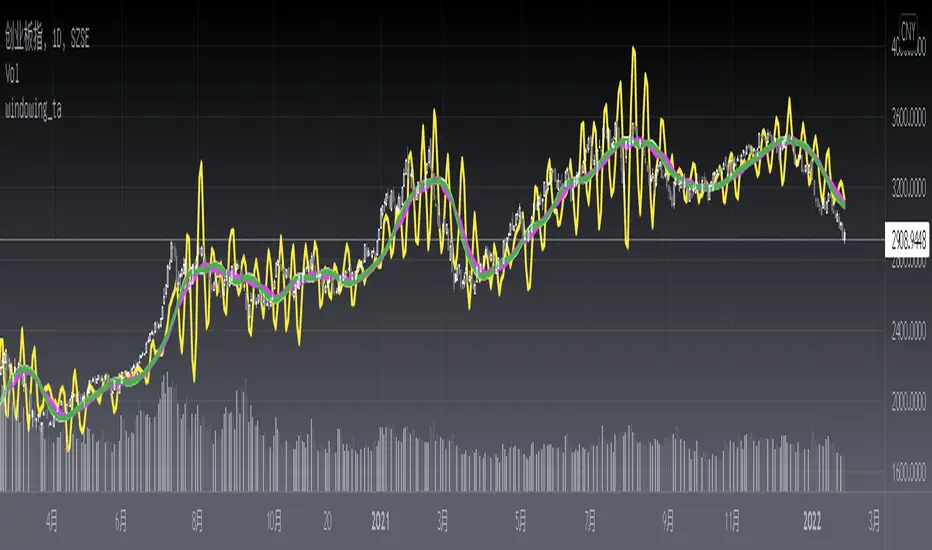
windowing_taAll Signals Are the Sum of Sines. When looking at real-world signals, you usually view them as a price changing over time. This is referred to as the time domain. Fourier’s theorem states that any waveform in the time domain can be represented by the weighted sum of sines and cosines. For example, take two sine waves, where one is three times as fast as the other–or the frequency is 1/3 the first signal. When you add them, you can see you get a different signal.
Although performing an FFT on a signal can provide great insight, it is important to know the limitations of the FFT and how to improve the signal clarity using windowing. When you use the FFT to measure the frequency component of a signal, you are basing the analysis on a finite set of data. The actual FFT transform assumes that it is a finite data set, a continuous spectrum that is one period of a periodic signal. For the FFT, both the time domain and the frequency domain are circular topologies, so the two endpoints of the time waveform are interpreted as though they were connected together. When the measured signal is periodic and an integer number of periods fill the acquisition time interval, the FFT turns out fine as it matches this assumption. However, many times, the measured signal isn’t an integer number of periods. Therefore, the finiteness of the measured signal may result in a truncated waveform with different characteristics from the original continuous-time signal, and the finiteness can introduce sharp transition changes into the measured signal. The sharp transitions are discontinuities.
When the number of periods in the acquisition is not an integer, the endpoints are discontinuous. These artificial discontinuities show up in the FFT as high-frequency components not present in the original signal. These frequencies can be much higher than the Nyquist frequency and are aliased between 0 and half of your sampling rate. The spectrum you get by using a FFT, therefore, is not the actual spectrum of the original signal, but a smeared version. It appears as if energy at one frequency leaks into other frequencies. This phenomenon is known as spectral leakage, which causes the fine spectral lines to spread into wider signals.
You can minimize the effects of performing an FFT over a noninteger number of cycles by using a technique called windowing. Windowing reduces the amplitude of the discontinuities at the boundaries of each finite sequence acquired by the digitizer. Windowing consists of multiplying the time record by a finite-length window with an amplitude that varies smoothly and gradually toward zero at the edges. This makes the endpoints of the waveform meet and, therefore, results in a continuous waveform without sharp transitions. This technique is also referred to as applying a window.
Here is a windowing_ta library with J.F Ehlers Windowing functions proposed on Sep, 2021.
Library "windowing_ta"
hann()
hamm()
fir_sma()
fir_triangle()
"如何用wind搜索股票的发行价和份数" için komut dosyalarını ara
Windowed Volume Weighted Moving AverageIntroduction
The concept of windowing was briefly introduced in the Blackman filter post, however windowing is more than just some window functions, and isn't exclusively used in filter design.
Today we will use windowing with the volume weighted moving average, a moving average that weight the price with volume in order to be more reactive when volume is high, that is the moving average is more reactive when the market is more active. The use of windowing in the vwma allow to enhance its performance in the frequency domain which result in a smoother output.
Note that i made a similar indicator long ago, but at that time I was not great at all with math and pinescript in general and the indicator was therefore wrong, i want to remind to the community that i'am not a professional, only an enthusiast, I never claimed to be a master coder and i'am totally open to receive criticism, if I sounded like bragging in the past I apologize, at 20 years old it is still easy to act like a kid, the information contained in my posts is only shared in order to help others but also myself, since sharing is also a way to learn more effectively. That said lets go with the indicator.
Windowing
Windowing consist on applying a window function to a signal, by applying i mostly talk about multiplying, this process is mostly used with windowed sinc filters in order to reduce ripples in the pass/stop band, but can be used with any kind of filters in order to have better frequency domain performance, the only thing we need to do is to multiply the filter weights by a window function.
In order to understand windowing it is useful to visualize this process and understand spectral leakage. Remember that we can describe a signal as the sum of sine/cosine waves of different frequencies, amplitude and phase, leakage is an effect that appear with signals having discontinuities, that is when a signal non periodic.
This figure show a non periodic sine wave of frequency 0.1, a non periodic signal will have is last sample value different from its first sample value, if we where to do its fourier transform we wouldn't end up with a single bin at 0.1 but with more bins, this is spectral leakage, the discontinuities in the signal create additional frequency components. In order to reduce leakage we must make the signal approximately periodic, this is done by making use of window functions.
A window function is symmetric and relatively smooth, all we have to do is to multiply our first non periodic signal with the window function.
We end up with the following windowed signal :
The signal is approximately periodic and leakage has been reduced. Now that we have seen that, it might be useful to see why it is useful in filters.
Remember that the Fourier transform of the filter weights gives us its frequency response, if our weights introduce leakage we end up with ripples, so windowing the filter weights might help reduce the ripples in the frequency response, which result in a smoother filter output.
Volume Weighted Moving Average
A volume weighted moving average is a FIR filter who use volume as filter kernel, therefore the frequency response of this filter always change, it is therefore not wrong to qualify the vwma as an adaptive moving average. Higher volume mean higher weighting of the current closing price value, which therefore produce a more reactive output.
However the smoothness of the moving average is relatively poor.
Windowed Volume Weighted Moving Average
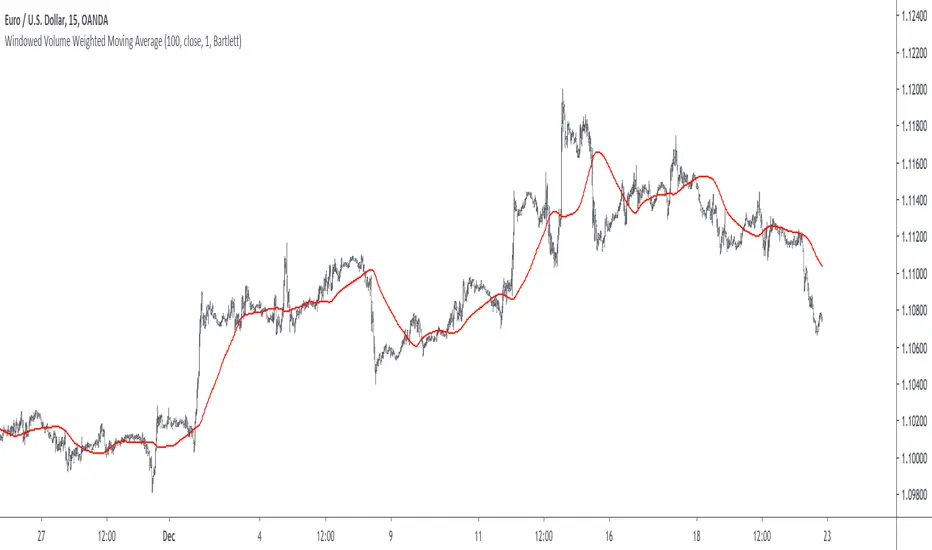
The proposed moving average has a length setting who control the moving average period, and various options that we will describe below. The first option is the type of window, there are many windows, certains more complex than others, here 3 windows are proposed, the famous Blackman window, the Bartlett, and finally the Hanning window, they provide each different level of smoothness. lets compare our moving average with period 100 with a vwma of the same period.
Our moving average in red, and the vwma in blue. As you can see the results are smoother.
The power parameter is used in order to give an even higher weighting to closing prices with high volume, this create a more boxy output. Below is a comparison with a vwma in blue and a powered vwma in red with power = 2 without windowing :
We can then apply a window, here i will choose the Blackman window :
Conclusion
A new moving average based on windowed volume weighting has been proposed. The result are smoother which might therefore reduce whipsaw trades. I wish i could have explained things better, unfortunately windowing isn't something i use much, i wanted to post this moving average earlier this year.
I will be off in France for 1 week, my flight is tomorrow in the morning, therefore i don't think i'll have the possibility to make other posts this year. I want to profit from this occasion to review my year in tradingview.
Many indicators have been posted, some being extremely bad and others really interesting, this year introduced my attempts on estimating the lsma efficiently, the linear channels, an attempt on making lines and remain the first indicator from the v4 i posted if i'am right. Then came the efficient auto-line, who gained some popularity quite fast. Then finally the %G oscillator and the recursive bands where posted, and remain some of the favorites indicators i made. I also wanted to leave this year due to studies, that i totally abandoned, i'am thankful that i chosen to stay.
I also want to express my apologies to any member that i could have offended, i think that i'am not a mean person but i certainly not contest the fact that i'am clumsy, even in my work, however my clumsiness is far greater when it comes to interact with other peoples or a group of peoples, i don't want to hurt anyone, if i made anything that made you feel bad then i'am sincerely sorry, and hope we can start this new year from 0.
Finally i thank the tradingview community for their interest and curiosity, i thank all the great coders who work on making pinescript a better scripting language, i also thank the tradingview staff for their work this year. I wish you all a merry christmas, and an happy new year.
Thanks for reading.
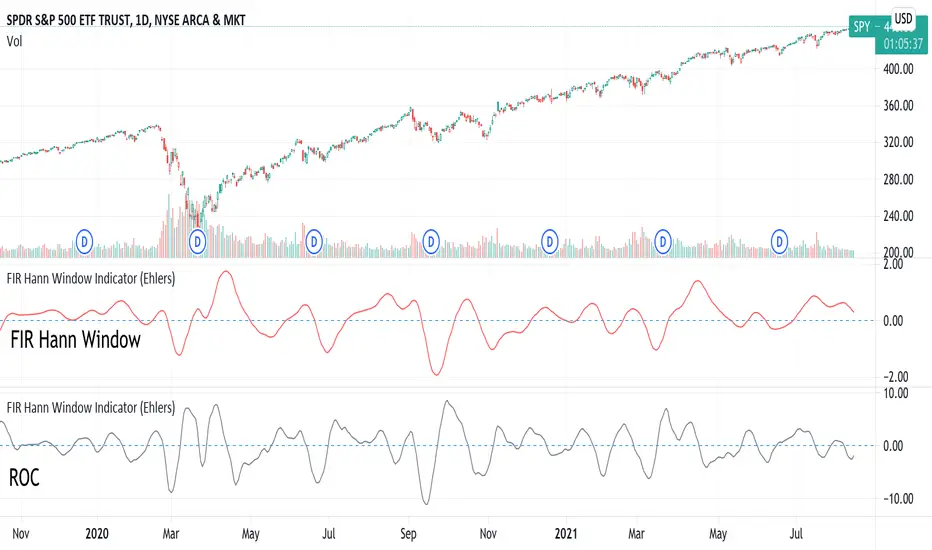
FIR Hann Window Indicator (Ehlers)From Ehlers' Windowing article:
"A still-smoother weighting function that is easy to program is called the Hann window. The Hann window is often described as a “sine squared” distribution, although it is easier to program as a cosine subtracted from unity. The shape of the coefficient outline looks like a sinewave whose valleys are at the ends of the array and whose peak is at the center of the array. This configuration offers a smooth window transition from the smallest coefficient amplitude to the largest coefficient amplitude."
Ported from: { TASC SEP 2021 FIR Hann Window Indicator } (C) 2021 John F. Ehlers
Stocks & Commodities V. 39:09 (8–14, 23): Windowing by John F. Ehlers
Original code found here: traders.com
FIR Chart: traders.com
ROC Chart: traders.com
Ehlers style implementation mostly maintained for easy verification.
Added optional ROC display.
Style and efficiency updates + Hann windowing as a function coming soon.
Indicator added twice to chart show both FIR and ROC.
Kaiser Window MAKaiser Window Moving Average Indicator
The Kaiser Window Moving Average is a technical indicator that implements the Kaiser window function in the context of a moving average. This indicator serves as an example of applying the Kaiser window and the modified Bessel function of the first kind in technical analysis, providing an open-source implementation of these functions in the TradingView Pine Script ecosystem.
Key Components
Kaiser Window Implementation
This indicator incorporates the Kaiser window, a parameterized window function with certain frequency response characteristics. By making this implementation available in Pine Script, it allows for exploration and experimentation with the Kaiser window in the context of financial time series analysis.
Modified Bessel Function of the First Kind
The indicator includes an implementation of the modified Bessel function of the first kind, which is integral to the Kaiser window calculation. This mathematical function is now accessible within TradingView, potentially useful for other custom indicators or studies.
Customizable Alpha Parameter
The indicator features an adjustable alpha parameter, which directly influences the shape of the Kaiser window. This parameter allows for experimentation with the indicator's behavior:
Lower alpha values: The indicator's behavior approaches that of a Simple Moving Average (SMA)
Moderate alpha values: The behavior becomes more similar to a Weighted Moving Average (WMA)
Higher alpha values: Increases the weight of more recent data points
In signal processing terms, the alpha parameter affects the trade-off between main-lobe width and side lobe level in the frequency domain.
Centered and Non-Centered Modes
The indicator offers two operational modes:
Non-Centered (Real-time) Mode: Uses half of the Kaiser window, starting from the peak. This mode operates similarly to traditional moving averages, suitable for real-time analysis.
Centered Mode: Utilizes the full Kaiser window, resulting in a phase-correct filter. This mode introduces a delay equal to half the window size, with the plot automatically offset to align with the correct time points.
Visualization Options
The indicator includes several visualization features to aid in analysis:
Gradient Coloring: Offers three gradient options:
• Three-color gradient: Includes a neutral color
• Two-color gradient: Traditional up/down color scheme
• Solid color: For a uniform appearance
Glow Effect: An optional visual enhancement for the moving average line.
Background Fill: An option to fill the area between the moving average and the price.
Use Cases
The Kaiser Window Moving Average can be applied similarly to other moving averages. Its primary value lies in providing an example implementation of the Kaiser window and modified Bessel function in TradingView. It serves as a starting point for traders and analysts interested in exploring these mathematical concepts in the context of technical analysis.
Conclusion
The Kaiser Window Moving Average indicator demonstrates the application of the Kaiser window function in a moving average calculation. By providing open-source implementations of the Kaiser window and the modified Bessel function of the first kind, this indicator contributes to the expansion of available mathematical tools in the TradingView Pine Script environment, potentially facilitating further experimentation and development in technical analysis.

Ehlers Simple Window Indicator [CC]The Simple Window Indicator was created by John Ehlers (Stocks and Commodities Sep 2021) and this is the last of the 4 new indicators that he published in the latest issue of Stocks & Commodities. Since these are all part of a series, the idea behind each indicator is the exact same. The only difference is of course the calculation for each indicator. This script is different mostly because it is extremely noisy in comparison so I had to smooth it twice to provide clear buy and sell signals. Window functions are used in digital signal processing to filter out noise and the end result is an oscillator that centers around the 0 line. The easy way to understand these indicators that I will be publishing and those are that when they are above 0, it usually means an uptrend and below 0 then a downtrend. For more immediate signals, I have included both normal and strong buy and sell signals so darker colors for strong signals and lighter colors for normal signals. Buy when the line turns green and sell when it turns red.
Let me know if there are any other indicators you would like me to publish!

Ehlers Triangle Window Indicator [CC]The Triangle Window Indicator was created by John Ehlers (Stocks and Commodities Sep 2021) and this is one of 4 new indicators that he published in the latest issue of Stocks & Commodities and I will be publishing the last one tomorrow. Since these are all part of a series, the idea behind each indicator is the exact same. The only difference is of course the calculation for each indicator. Window functions are used in digital signal processing to filter out noise and the end result is an oscillator that centers around the 0 line. The easy way to understand these indicators that I will be publishing and those are that when they are above 0, it usually means an uptrend and below 0 then a downtrend. For more immediate signals, I have included both normal and strong buy and sell signals so darker colors for strong signals and lighter colors for normal signals. Buy when the line turns green and sell when it turns red.
Let me know if there are any other indicators you would like me to publish!

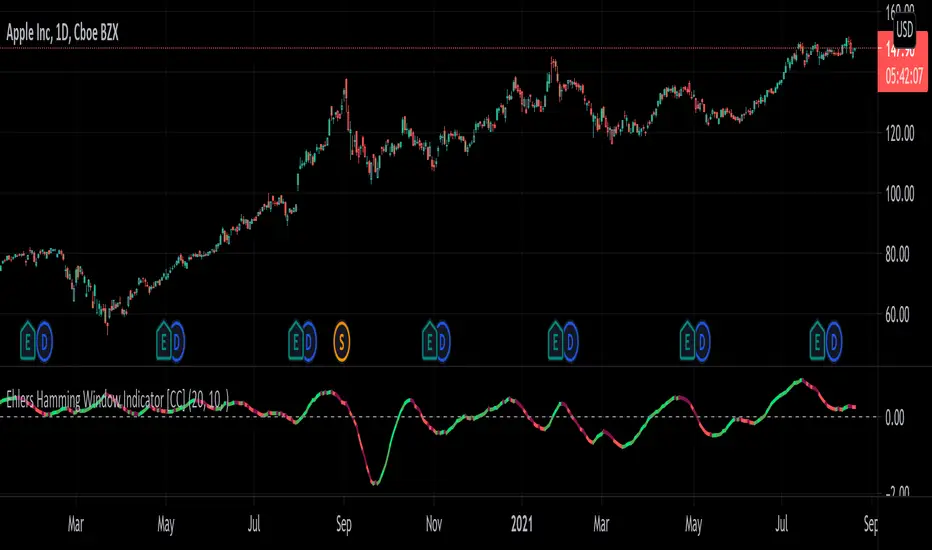
Ehlers Hamming Window Indicator [CC]The Hamming Window Indicator was created by John Ehlers (Stocks and Commodities Sep 2021) and this is one of 4 new indicators that he published in the latest issue of Stocks & Commodities and I will be publishing the other 2 in the next few days. Since these are all part of a series, the idea behind each indicator is the exact same. The only difference is of course the calculation for each indicator. Window functions are used in digital signal processing to filter out noise and the end result is an oscillator that centers around the 0 line. The easy way to understand these indicators that I will be publishing and those are that when they are above 0, it usually means an uptrend and below 0 then a downtrend. For more immediate signals, I have included both normal and strong buy and sell signals so darker colors for strong signals and lighter colors for normal signals. Buy when the line turns green and sell when it turns red.
Let me know if there are any other indicators you would like me to publish!
Ehlers Hann Window Indicator [CC]The Hann Window Indicator was created by John Ehlers (Stocks & Commodities Sep 2021) and this is one of 4 new indicators that he published in the latest issue of Stocks & Commodities and I will be publishing the other 3 in the next few days. Since these are all part of a series, the idea behind each indicator is the exact same. The only difference is of course the calculation for each indicator. Window functions are used in digital signal processing to filter out noise and the end result is an oscillator that centers around the 0 line. The easy way to understand these indicators that I will be publishing and those are that when they are above 0, it usually means an uptrend and below 0 then a downtrend. For more immediate signals, I have included both normal and strong buy and sell signals so darker colors for strong signals and lighter colors for normal signals. Buy when the line turns green and sell when it turns red.
Let me know if there are any other indicators you would like me to publish!

ICT Time Windows by Scuba SteveJust an easy to use time based indicator that allows you to track ICT London Open Killzone, New York Open killzone, AM session Silver Bullet time window & PM Session Silver Bullet Time Window, and last but not least the Last Hour of trading which often has nice moves.

Candlestick Patterns + windows Mod by BoernererMy modifications for the candlestick pattern script by Robert Waddell.
Changelog
- Added window (= gaps) detection
- Added Bear/Bull Sash
- Modified candlestick ID code
- Candlesticks will only be displayed if above or below TLine
Originally created by Robert Waddell with special thanks to repo32 for his candlestick ID code, DavidR for EMA code and Chris Moody for barcolor code.
Enjoy and would love if you improve it further!

window//@version=5
indicator("Smart Money Time Windows (GMT+3:30)", overlay=true)
// ✅ Window 1 — 08:30 to 09:05 Tehran Time
w1 = time(timeframe.period, "0830-0905", "Asia/Tehran")
// ✅ Window 2 — 13:50 to 14:40 Tehran Time
w2 = time(timeframe.period, "1350-1440", "Asia/Tehran")
// ✅ Window 3 — 17:15 to 18:00 Tehran Time
w3 = time(timeframe.period, "1715-1800", "Asia/Tehran")
bgcolor(not na(w1) ? color.new(color.blue, 85) : na)
bgcolor(not na(w2) ? color.new(color.orange, 85) : na)
bgcolor(not na(w3) ? color.new(color.purple, 85) : na)

Window Seasonality IndicatorThis is a time window seasonal returns indicator. That is, it will provide the mean returns for a given time window based on a given number of lookbacks set by the user. The script finds matching time windows, e.g., 1st week of March going back 5 years or 9:00-10:00 window of every day going 50 days, and then calculates an average return for that window close price with respect to the close price in the immediately preceding time window, e.g. last week of February or 8:00-9:00 close price, respectively.
There are 4 input options:
1) Historical Periods to Average: Set the number of matching historical windows with which to calculate an average price. The max is 730 lookback windows. Note: for monthly or weekly windows, setting too large a number will cause the script to error out.
2) Use Open Price: calculates the seasonal returns using the open price rather than close price.
3) Show Bands: select from 1 Gaussian standard deviation or a nonparamateric ranked confidence interval. As a rough heuristic, the Gaussian band requires at least 30 lookback periods, and the ranked confidence interval requires 50 or more.
4) Upper Percentile: set the upper cutoff for ranked confidence interval.
5) Lower Percentile: set the lower cutoff for ranked confidence interval.
Please be aware, this indicator does not use rigorous statistical methodology and does not imply predictive power. You'll notice the range bands are very wide. Do not trade solely based on this indicator! Certain time windows, such as weekly and monthly, will make more sense applied to commodities, where annual cycles play a role in its supply and demand dynamics. Hourly windows are more useful in looking at equities markets. I like to look at equities with 1-hr windows to see if there is some pattern to overnight behavior or for market open and close.

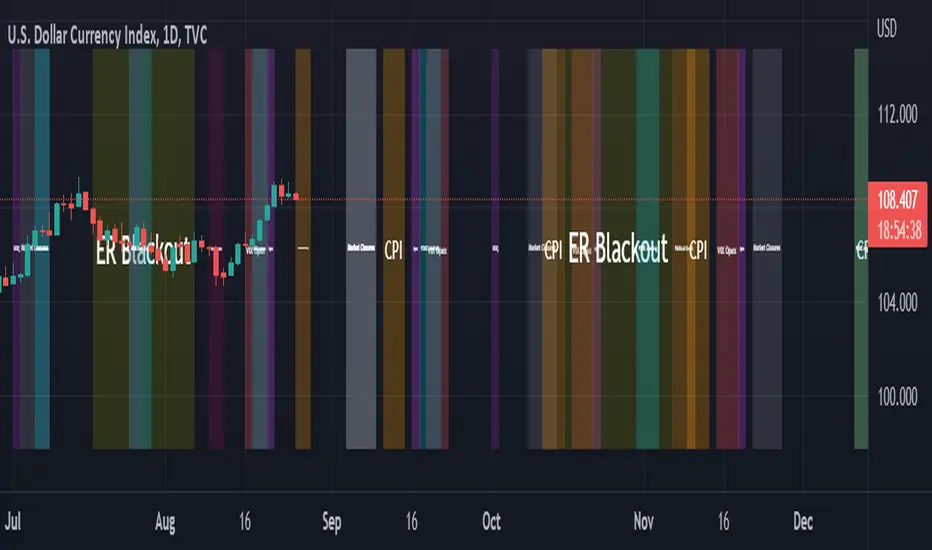
Window Periods// Work in progress.. visualize event windows
// to do:
// - assign sector relevance (add opec events and weight more to commodity typed instruments, whereas revenue forecasts of walmart won't be as relevant to commodities)
// - create weighting onto macro probability valuators
// - create means to store window weight/values in an accessible way so that additional scripts can access this data (post hidden text in window?) or maybe just duplicate arrays elsewhere in additional code (terrible option)
// - correct colors to scale within like types of events (opex the same, rebalancing periods the same, political and financial meeting the same color etc..)
// - find a way to make transfer the timestamps or date strings as const variables usable within functions. v5 sends as series and cannot be converted back making this an overly complicated case instead of a function/library
// - add dates back to 2017 for better referencing
// - convert a number of the variables to inputs so they can be controlled in-chart, such as transparancy, and color of each window period?
Time-based Alerts for Trading Windows🌟 Time-based Alerts for Trading Windows 🌐📈
This is a re-uploaded script as the previous one got hidden.
This Time-based Alerts for Trading Windows script is a highly customizable and reliable tool designed to assist traders in managing automated strategies or manually monitoring specific market conditions. Inspired by CrossTrade's Time-based Alert, this script is tailored for those who rely on precise time windows to trigger actions, such as sending webhook signals or managing Expert Advisors (EAs).
Whether you are a scalper, day trader, or algorithmic trader, this script empowers you to stay on top of your trades with fully customizable time-based alerts.
🛠️ Customizable Time Alerts
This indicator allows you to create up to 12 unique time windows by specifying the exact hour and minute for each alert. Each time window corresponds to an individual alert condition, making it perfect for managing trades during specific market sessions or key time periods.
For example:
Alert 1 can be set at 9:30 AM (market open).
Alert 2 can be set at 3:55 PM (just before market close).
Each alert can be toggled on or off in the indicator settings, allowing you to manage alerts without having to reconfigure your script.
You can adjust the colours to fit any colour scheme you like!
🕒 Odd and Even Time Alerts
The script comes with three built-in alert type categories:
Odd Alerts (marked with a green triangle on the chart): These correspond to odd-numbered inputs like Alert 1, Alert 3, Alert 5, and so on.
Even Alerts (marked with a red triangle on the chart): These correspond to even-numbered inputs like Alert 2, Alert 4, Alert 6, and so on.
You can also customize all 12 alerts individually to include a custom alert message
These alerts serve as a convenient way to differentiate between multiple trading strategies or market conditions. You can customize alert messages for odd and even alerts directly from TradingView’s alert panel.
🔗 Webhook Integration for Automation
This script is fully compatible with webhook-based automation. By configuring your alerts in TradingView, you can send signals to trading bots, EAs, or any third-party system. For example, you can:
Turn off an EA at a specific time (e.g., 3:55 PM EST).
Send buy/sell signals to your bot during predefined trading windows.
Simply use TradingView’s alert message editor to format webhook payloads for your automation system.
🌐 Timezone Flexibility
Trading happens across multiple time zones, and this script accounts for that. You can toggle between:
Eastern Time (New York): Ideal for most US-based markets.
Central Time (Exchange): Useful for futures and commodities traders.
This ensures your alerts are always in sync with your preferred time zone, eliminating confusion.
🎨 Visual Indicators
The script plots visual markers directly on your chart to indicate active alerts:
Up Facing Triangles: Represent odd-numbered alerts, providing a quick reference for these time windows.
Down Facing Triangles: Represent even-numbered alerts, helping you track different strategies or conditions.
These visual markers make it easy to see when alerts are triggered, even at a glance.
📈 Practical Use Case
Let’s say you’re trading the USTEC index on a 1-minute chart. You want to:
Turn off your trading bot at 16:55 EST to avoid after-market volatility.
Trigger a re-entry signal at 17:30 EST to capture moves during the Asian session.
Visually monitor these actions on your chart for easy reference.
This script makes it possible with precision alerts and webhook integration. Simply configure the time windows in the settings and set up your alerts in TradingView.
🚨 How to Set Up Alerts
Enable or Disable Alerts: Use the script’s settings to toggle specific alerts on or off as needed.
Set Custom Time Windows: Define the hour and minute for each alert in the settings panel.
Create Alerts in TradingView:
Go to the TradingView alert panel.
Select the condition (e.g., "Odd Time-based Alert (Green)" or "Even Time-based Alert (Red)").
Customize the alert message for webhook integration or personal notification.
Choose the trigger type: Once Per Bar or Once Per Bar Close to keep the alert active.
Integrate with Webhooks: Use the alert message field to format payloads for automation systems like MT4, MT5, or third-party bots.
📋 Key Notes
Alerts can trigger indefinitely if set to "Once Per Bar" or "Once Per Bar Close".
Always ensure the expiration date is set far in the future to avoid unexpected alert deactivation.
Test webhook messages and alert configurations thoroughly before using them in live trading.
This script is a powerful addition to your trading toolbox, offering precision, flexibility, and automation capabilities. Whether you’re turning off an EA, managing trades during market sessions, or automating strategies via webhooks, this script is here to support you.
Start using the Time-based Alerts for Trading Windows today and trade with confidence! 🚀✨

STD/Clutter-Filtered, Kaiser Window FIR Digital Filter [Loxx]STD/Clutter-Filtered, Kaiser Window FIR Digital Filter is an is FIR digital filter using Kaiser Windowing. I've also included a clutter filter to reduce signal noise.
What is a Kaiser Window?
The Kaiser window, also known as the Kaiser–Bessel window, was developed by James Kaiser at Bell Laboratories. It is a one-parameter family of window functions used in finite impulse response filter design and spectral analysis. The Kaiser window approximates the DPSS window which maximizes the energy concentration in the main lobe but which is difficult to compute. Kaiser windowing strikes a balance among the various conflicting goals of amplitude accuracy, side lobe distance, and side lobe height. Choosing this window will often reveal signals close to the noise floor that other windows may obscure. For this reason, many spectrum analyzers default to this window. For our purposes here, we use a the Kaiser–Bessel-derived (KBD) window, which is designed to be suitable for use with the modified discrete cosine transform (MDCT).
You can read more here: The Io-sinh function, calculation of Kaiser windows and design of FIR filters
Kaiser Window Amplitudes (not the default settings)
What is a Finite Impulse Response Filter?
In signal processing, a finite impulse response (FIR) filter is a filter whose impulse response (or response to any finite length input) is of finite duration, because it settles to zero in finite time. This is in contrast to infinite impulse response (IIR) filters, which may have internal feedback and may continue to respond indefinitely (usually decaying).
The impulse response (that is, the output in response to a Kronecker delta input) of an Nth-order discrete-time FIR filter lasts exactly {\displaystyle N+1}N+1 samples (from first nonzero element through last nonzero element) before it then settles to zero.
FIR filters can be discrete-time or continuous-time, and digital or analog.
A FIR filter is (similar to, or) just a weighted moving average filter, where (unlike a typical equally weighted moving average filter) the weights of each delay tap are not constrained to be identical or even of the same sign. By changing various values in the array of weights (the impulse response, or time shifted and sampled version of the same), the frequency response of a FIR filter can be completely changed.
An FIR filter simply CONVOLVES the input time series (price data) with its IMPULSE RESPONSE. The impulse response is just a set of weights (or "coefficients") that multiply each data point. Then you just add up all the products and divide by the sum of the weights and that is it; e.g., for a 10-bar SMA you just add up 10 bars of price data (each multiplied by 1) and divide by 10. For a weighted-MA you add up the product of the price data with triangular-number weights and divide by the total weight.
Ultra Low Lag Moving Average's weights are designed to have MAXIMUM possible smoothing and MINIMUM possible lag compatible with as-flat-as-possible phase response.
What is a Clutter Filter?
For our purposes here, this is a filter that compares the slope of the trading filter output to a threshold to determine whether to shift trends. If the slope is up but the slope doesn't exceed the threshold, then the color is gray and this indicates a chop zone. If the slope is down but the slope doesn't exceed the threshold, then the color is gray and this indicates a chop zone. Alternatively if either up or down slope exceeds the threshold then the trend turns green for up and red for down. Fro demonstration purposes, an EMA is used as the moving average. This acts to reduce the noise in the signal.
Included
Bar coloring
Loxx's Expanded Source Types
Signals
Alerts
Realed Indicators
STD/Clutter Filtered, One-Sided, N-Sinc-Kernel, EFIR Filt
STD- and Clutter-Filtered, Non-Lag Moving Average
Clutter-Filtered, D-Lag Reducer, Spec. Ops FIR Filter
STD-Filtered, Ultra Low Lag Moving Average

Time Window Optimizer [theUltimator5]The Time Window Optimizer is designed to identify the most profitable 30-minute trading windows during regular market hours (9:30 AM - 4:00 PM EST). This tool helps traders optimize their intraday strategies by automatically discovering time periods with the highest historical performance or allowing manual selection for custom analysis. It also allows you to select manual timeframes for custom time period analysis.
🏆 Automatic Window Discovery
The core feature of this indicator is its intelligent Auto-Find Best 30min Window system that analyzes all 13 possible 30-minute time slots during market hours.
How the Algorithm Works:
Concurrent Analysis: The indicator simultaneously tracks performance across all 13 time windows (9:30-10:00, 10:00-10:30, 10:30-11:00... through 15:30-16:00)
Daily Performance Tracking: For each window, it captures the percentage change from window open to window close on every trading day
Cumulative Compounding: Daily returns are compounded over time to show the true long-term performance of each window, starting from a normalized value of 1.0
Dynamic Optimization: The system continuously identifies the window with the highest cumulative return and highlights it as the optimal choice
Statistical Validation: Performance is validated through multiple metrics including average daily returns, win rates, and total sample size
Visual Representation:
Best Window Line: The top-performing window is displayed as a thick colored line for easy identification
All 13 Lines (optional): Users can view performance lines for all time windows simultaneously to compare relative performance
Smart Coloring: Lines are color-coded (green for gains, red for losses) with the best performer highlighted in a user-selected color
📊 Comprehensive Performance Analysis
The indicator provides detailed statistics in an information table:
Average Daily Return: Mean percentage change per trading session
Cumulative Return: Total compounded performance over the analysis period
Win Rate: Percentage of profitable days (colored green if ≥50%, red if <50%)
Buy & Hold Comparison: Shows outperformance vs. simple buy-and-hold strategy
Sample Size: Number of trading days analyzed for statistical significance
🛠️ User Settings
imgur.com
Auto-Optimization Controls:
Auto-Find Best Window: Toggle to enable/disable automatic optimization
Show All 13 Lines: Display all time window performance lines simultaneously
Best Window Line Color: Customize the color of the top-performing window
Manual Mode:
imgur.com
Custom Time Window: Set any desired time range using session format (HHMM-HHMM)
Crypto Support: Built-in timezone offset adjustment for cryptocurrency markets
Chart Type Options: Switch between candlestick and line chart visualization
Visual Customization:
imgur.com
Background Highlighting: Optional background color during active time windows
Candle Coloring: Custom colors for bullish/bearish candles within the time window
Table Positioning: Flexible placement of the statistics table anywhere on the chart
🔧 Technical Features
Market Compatibility:
Stock Markets: Optimized for traditional market hours (9:30 AM - 4:00 PM EST)
Cryptocurrency: Includes timezone offset adjustment for 24/7 crypto markets
Exchange Detection: Automatically detects crypto exchanges and applies appropriate settings
Performance Optimization:
Efficient Calculation: Uses separate arrays for each time block to minimize computational overhead
Real-time Updates: Dynamically updates the best-performing window as new data becomes available
Memory Management: Optimized data structures to handle large datasets efficiently
💡 Use Cases
Strategy Development: Identify the most profitable trading hours for your specific instruments
Risk Management: Focus trading activity during historically successful time periods
Performance Comparison: Evaluate whether time-specific strategies outperform buy-and-hold
Market Analysis: Understand intraday patterns and market behavior across different time windows
📈 Key Benefits
Data-Driven Decisions: Base trading schedules on historical performance data
Automated Analysis: No manual calculation required - the algorithm does the work
Flexible Implementation: Works in both automated discovery and manual selection modes
Comprehensive Metrics: Multiple performance indicators for thorough analysis
Visual Clarity: Clear, color-coded visualization makes interpretation intuitive
This indicator transforms complex intraday analysis into actionable insights, helping traders optimize their time allocation and improve overall trading performance through systematic, data-driven approach to market timing.

Macro Timing Window Signal ⏱️ Macro Timing Window Signal – Check/X Indicator
This indicator displays a green check mark ✔️ or red X ✖️ in the top-right corner of the chart based on a repeating macro time cycle that divides every hour into active and inactive windows.
How it works:
• ✔️ Green Check (Active Macro Window):
Appears from xx:45 → xx:15 of the next hour (30-minute macro window).
• ✖️ Red X (Inactive Macro Window):
Appears from xx:16 → xx:44 (mid-hour cooldown window).
• Optional flash signal at the exact macro flip points (xx:45, xx:00, xx:15) to highlight transitions.
• Supports sound alerts so you never miss the start or end of a macro window.
This tool is designed for traders who incorporate macro-driven time cycles, liquidity sessions, or algorithmic delivery windows into their strategy.
The display is fixed on-screen, clean, and unobtrusive, ensuring instant recognition of the current macro state without cluttering the chart.

Sinc MAKaiser Windowed Sinc Moving Average Indicator
The Kaiser Windowed Sinc Moving Average is an advanced technical indicator that combines the sinc function with the Kaiser window to create a highly customizable finite impulse response (FIR) filter for financial time series analysis.
Sinc Function: The Ideal Low-Pass Filter
At the core of this indicator is the sinc function, which represents the impulse response of an ideal low-pass filter. In signal processing and technical analysis, the sinc function is crucial because it allows for the creation of filters with precise frequency cutoff characteristics. When applied to financial data, this means the ability to separate long-term trends from short-term fluctuations with remarkable accuracy.
The primary advantage of using a sinc-based filter is the independent control over two critical parameters: the cutoff frequency and the number of samples used. The cutoff frequency, analogous to the "length" in traditional moving averages, determines which price movements are considered significant (low frequency) and which are treated as noise (high frequency). By adjusting the cutoff, analysts can fine-tune the filter to respond to specific market cycles or timeframes of interest.
The number of samples used in the filter doesn't affect the cutoff frequency but instead influences the filter's accuracy and steepness. Increasing the sample size results in a better approximation of the ideal low-pass filter, leading to sharper transitions between passed and attenuated frequencies. This allows for more precise trend identification and noise reduction without changing the fundamental frequency response characteristics.
Kaiser Window: Optimizing the Sinc Filter
While the sinc function provides excellent frequency domain characteristics, it has infinite length in the time domain, which is impractical for real-world applications. This is where the Kaiser window comes into play. By applying the Kaiser window to the sinc function, we create a finite-length filter that approximates the ideal response while minimizing unwanted oscillations (known as the Gibbs phenomenon) in the frequency domain.
The Kaiser window introduces an additional parameter, alpha, which controls the trade-off between the main-lobe width and side-lobe levels in the frequency response. This parameter allows users to fine-tune the filter's behavior, balancing between sharp cutoffs and minimal ripple effects.
Customizable Parameters
The Kaiser Windowed Sinc Moving Average offers several key parameters for customization:
Cutoff: Controls the filter's cutoff frequency, determining the divide between trends and noise.
Length: Sets the number of samples used in the FIR filter calculation, affecting the filter's accuracy and computational complexity.
Alpha: Influences the shape of the Kaiser window, allowing for fine-tuning of the filter's frequency response characteristics.
Centered and Non-Centered Modes
The indicator provides two operational modes:
Non-Centered (Real-time) Mode: Uses half of the windowed sinc function, suitable for real-time analysis and current market conditions.
Centered Mode: Utilizes the full windowed sinc function, resulting in a zero-phase filter. This mode introduces a delay but offers the most accurate trend identification for historical analysis.
Visualization Features
To enhance the analytical value of the indicator, several visualization options are included:
Gradient Coloring: Offers a range of color schemes to represent trend direction and strength.
Glow Effect: An optional visual enhancement for improved line visibility.
Background Fill: Highlights the area between the moving average and price, aiding in trend visualization.
Applications in Technical Analysis
The Kaiser Windowed Sinc Moving Average is particularly useful for precise trend identification, cycle analysis, and noise reduction in financial time series. Its ability to create custom low-pass filters with independent control over cutoff and filter accuracy makes it a powerful tool for analyzing various market conditions and timeframes.
Compared to traditional moving averages, this indicator offers superior frequency response characteristics and reduced lag in trend identification when properly tuned. It provides greater flexibility in filter design, allowing analysts to create moving averages tailored to specific trading strategies or market behaviors.
Conclusion
The Kaiser Windowed Sinc Moving Average represents an advanced approach to price smoothing and trend identification in technical analysis. By making the ideal low-pass filter characteristics of the sinc function practically applicable through Kaiser windowing, this indicator provides traders and analysts with a sophisticated tool for examining price trends and cycles.
Its implementation in Pine Script contributes to the TradingView community by making advanced signal processing techniques accessible for experimentation and further development in technical analysis. This indicator serves not only as a practical tool for market analysis but also as an educational resource for those interested in the intersection of signal processing and financial markets.
Related script:

ICT SIlver Bullet Trading Windows UK times🎯 Purpose of the Indicator
It’s designed to highlight key ICT “macro” and “micro” windows of opportunity, i.e., time ranges where liquidity grabs and algorithmic setups are most likely to occur. The ICT Silver Bullet concept is built on the idea that institutions execute in recurring intraday windows, and these often produce high-probability setups.
🕰️ Windows
London Macro Window
10:00 – 11:00 UK time
This aligns with a major liquidity window after the London equities open settles and London + EU traders reposition.
You’re looking for setups like liquidity sweeps, MSS (market structure shift), and FVG entries here.
New York Macro Window
15:00 – 16:00 UK time (10:00 – 11:00 NY time)
This is right after the NY equities open, a key ICT window for volatility and liquidity grabs.
Power Hour
Usually 20:00 – 21:00 UK time (3pm–4pm NY time), the last trading hour of NY equities.
ICT often refers to this as another manipulation window where setups can form before the daily close.
🔍 What the Indicator Does
Draws session boxes or shading: so you can visually see the London/NY/Power Hour windows directly on your chart.
Macro vs. Micro time frames:
Macro windows → The ones you set (London & NY) are the major daily algo execution windows.
Micro windows → Within those boxes, ICT expects smaller intraday setups (like a Silver Bullet entry from a sweep + FVG).
Guides your trade selection: it tells you when not to hunt trades everywhere, but instead to wait for price action confirmation inside those boxes.
🧩 How This Fits ICT Silver Bullet Trading
The ICT Silver Bullet strategy says:
Wait for one of the macro windows (London or NY).
Look for liquidity sweep → market structure shift → FVG.
Enter with defined risk inside that hour.
This indicator essentially does step 1 for you: it makes those high-probability windows visually obvious, so you don’t waste time trading random hours where algos aren’t active.

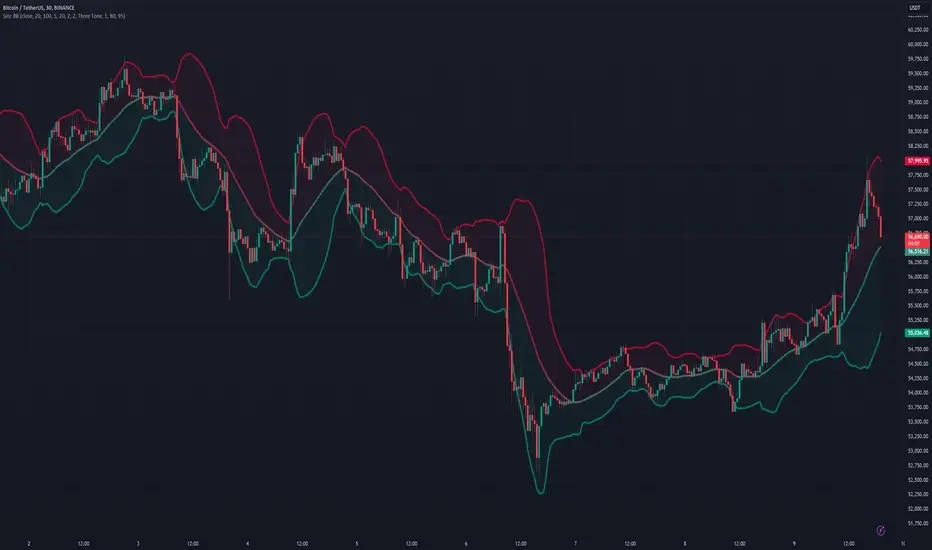
Sinc Bollinger BandsKaiser Windowed Sinc Bollinger Bands Indicator
The Kaiser Windowed Sinc Bollinger Bands indicator combines the advanced filtering capabilities of the Kaiser Windowed Sinc Moving Average with the volatility measurement of Bollinger Bands. This indicator represents a sophisticated approach to trend identification and volatility analysis in financial markets.
Core Components
At the heart of this indicator is the Kaiser Windowed Sinc Moving Average, which utilizes the sinc function as an ideal low-pass filter, windowed by the Kaiser function. This combination allows for precise control over the frequency response of the moving average, effectively separating trend from noise in price data.
The sinc function, representing an ideal low-pass filter, provides the foundation for the moving average calculation. By using the sinc function, analysts can independently control two critical parameters: the cutoff frequency and the number of samples used. The cutoff frequency determines which price movements are considered significant (low frequency) and which are treated as noise (high frequency). The number of samples influences the filter's accuracy and steepness, allowing for a more precise approximation of the ideal low-pass filter without altering its fundamental frequency response characteristics.
The Kaiser window is applied to the sinc function to create a practical, finite-length filter while minimizing unwanted oscillations in the frequency domain. The alpha parameter of the Kaiser window allows users to fine-tune the trade-off between the main-lobe width and side-lobe levels in the frequency response.
Bollinger Bands Implementation
Building upon the Kaiser Windowed Sinc Moving Average, this indicator adds Bollinger Bands to provide a measure of price volatility. The bands are calculated by adding and subtracting a multiple of the standard deviation from the moving average.
Advanced Centered Standard Deviation Calculation
A unique feature of this indicator is its specialized standard deviation calculation for the centered mode. This method employs the Kaiser window to create a smooth deviation that serves as an highly effective envelope, even though it's always based on past data.
The centered standard deviation calculation works as follows:
It determines the effective sample size of the Kaiser window.
The window size is then adjusted to reflect the target sample size.
The source data is offset in the calculation to allow for proper centering.
This approach results in a highly accurate and smooth volatility estimation. The centered standard deviation provides a more refined and responsive measure of price volatility compared to traditional methods, particularly useful for historical analysis and backtesting.
Operational Modes
The indicator offers two operational modes:
Non-Centered (Real-time) Mode: Uses half of the windowed sinc function and a traditional standard deviation calculation. This mode is suitable for real-time analysis and current market conditions.
Centered Mode: Utilizes the full windowed sinc function and the specialized Kaiser window-based standard deviation calculation. While this mode introduces a delay, it offers the most accurate trend and volatility identification for historical analysis.
Customizable Parameters
The Kaiser Windowed Sinc Bollinger Bands indicator provides several key parameters for customization:
Cutoff: Controls the filter's cutoff frequency, determining the divide between trends and noise.
Number of Samples: Sets the number of samples used in the FIR filter calculation, affecting the filter's accuracy and computational complexity.
Alpha: Influences the shape of the Kaiser window, allowing for fine-tuning of the filter's frequency response characteristics.
Standard Deviation Length: Determines the period over which volatility is calculated.
Multiplier: Sets the number of standard deviations used for the Bollinger Bands.
Centered Alpha: Specific to the centered mode, this parameter affects the Kaiser window used in the specialized standard deviation calculation.
Visualization Features
To enhance the analytical value of the indicator, several visualization options are included:
Gradient Coloring: Offers a range of color schemes to represent trend direction and strength for the moving average line.
Glow Effect: An optional visual enhancement for improved line visibility.
Background Fill: Highlights the area between the Bollinger Bands, aiding in volatility visualization.
Applications in Technical Analysis
The Kaiser Windowed Sinc Bollinger Bands indicator is particularly useful for:
Precise trend identification with reduced noise influence
Advanced volatility analysis, especially in the centered mode
Identifying potential overbought and oversold conditions
Recognizing periods of price consolidation and potential breakouts
Compared to traditional Bollinger Bands, this indicator offers superior frequency response characteristics in its moving average and a more refined volatility measurement, especially in centered mode. These features allow for a more nuanced analysis of price trends and volatility patterns across various market conditions and timeframes.
Conclusion
The Kaiser Windowed Sinc Bollinger Bands indicator represents a significant advancement in technical analysis tools. By combining the ideal low-pass filter characteristics of the sinc function, the practical benefits of Kaiser windowing, and an innovative approach to volatility measurement, this indicator provides traders and analysts with a sophisticated instrument for examining price trends and market volatility.
Its implementation in Pine Script contributes to the TradingView community by making advanced signal processing and statistical techniques accessible for experimentation and further development in technical analysis. This indicator serves not only as a practical tool for market analysis but also as an educational resource for those interested in the intersection of signal processing, statistics, and financial markets.
Related:
Trading Macro Windows by BW v2
Trading Macros by BW: Integrating ICT Concepts for Session Analysis
This indicator combines two key Inner Circle Trader (ICT) concepts—Change in State of Delivery (CISD) or Inverted Fair Value Gap (IFVG) signals with Macro Time Windows—to provide a unified tool for analyzing intraday price action, particularly during Pacific Time (PT) sessions. Rather than simply merging existing scripts, this integration creates a cohesive visual framework that highlights how macro consolidation periods interact with potential reversal or continuation signals like CISD or IFVG. By overlaying macro candle styling and borders on the chart alongside selectable signal lines, traders can better contextualize setups within ICT's macro narrative, where price often manipulates liquidity during these windows before displacing toward higher-timeframe objectives.
Core Components and How They Work Together:
Macro Time Windows (Inspired by ICT's Macro Periods):
ICT emphasizes "macro" as 30-minute windows (e.g., 06:45–07:15 PT, 07:45–08:15 PT, up to 11:45–12:15 PT) where price tends to consolidate, sweep liquidity, or form key structures like Fair Value Gaps (FVGs). These periods set the stage for the session's directional bias.
The indicator styles candles within these windows using a user-defined color for wicks, borders, and bodies (translucent for visibility). This visual emphasis helps traders focus on activity inside macros, where reversals or continuations often originate.
Borders are drawn as vertical lines at the start and end of each window (with a +5 minute buffer to capture related activity), using a dotted style by default. This creates a "study zone" that encapsulates macro events, allowing traders to assess if price is respecting or violating these zones in alignment with broader ICT models like the Power of 3 (AMD cycle).
Toggle: "Macro Candles Enabled" (default: true) – Turn off to disable styling and borders if focusing solely on signals.
CISD or IFVG Signals (Selectable Mode):
Mode Selection: Choose between "Change in the State of Delivery" (CISD) or "IFVG" (default: IFVG). Both detect shifts in market delivery during specific 30-minute slices (15–45 or 17–45 minutes past the hour in PT sessions).
CISD Mode: Based on ICT's definition of a sudden directional shift, this identifies aggressive displacements after sweeping recent highs/lows. It uses a rolling reference high/low over 6 bars, checks for sweeps (penetrating by at least 2 ticks in the last 2-3 bars), reclamation (closing beyond the reference with at least 50% body), and displacement (50% of prior range or an immediate FVG of 6+ ticks). Signals plot a horizontal line from the close, extending 24 bars right, labeled "CISD."
IFVG Mode: Focuses on Inverted Fair Value Gaps, where a bullish FVG (low > high by 13+ ticks) forms but is inverted (closed below) in the same slice, signaling bearish intent (or vice versa). This targets violations against opposing liquidity, often leading to raids on external ranges. Signals plot similarly, labeled "IFVG."
Shared Logic: Both modes enforce a 55-bar cooldown to prevent clustering, operate only during PT sessions (06:30–13:00), and use tick-based thresholds for precision across instruments. The integration with macros allows traders to see if signals occur within or at the edges of macro windows, enhancing confirmation—for example, a CISD inside a macro might indicate a manipulated reversal toward the session's true objective.
Toggle: "Signals Enabled" (default: true) – Turn off to hide all signal lines and labels, isolating the macro visualization.
How Components Interact:
Macro windows provide the "narrative context" (consolidation/manipulation), while CISD/IFVG signals detect the "delivery shift" (displacement). Together, they form a mashup that justifies publication: isolated signals can be noisy, but when filtered by macro periods, they align with ICT's session model. For instance, an IFVG inversion during a macro might confirm a liquidity sweep before targeting PD arrays or order blocks.
No external dependencies; all calculations are self-contained using Pine's built-in functions like ta.highest/lowest for references and time-based sessions for windows.
Usage Guidelines:
Apply to intraday charts (e.g., 1-5 min) or stocks during PT hours.
Look for confluence: A bull IFVG signal post-macro low sweep might target the next macro high or daily bias.
Customize colors/styles for signals (solid/dashed/dotted lines) and macros to suit your chart.
Backtest in replay mode to observe how macros frame signals—e.g., price often respects macro borders as S/R.
Limitations: Timezone-fixed to PT (America/Los_Angeles); signals are directional hints, not trade entries. Combine with ICT tools like order blocks or liquidity pools for full setups.
This script draws from community ICT implementations but refines them into a single, purpose-built tool for macro-driven trading, reducing chart clutter while emphasizing interconnected concepts. Feedback welcome!

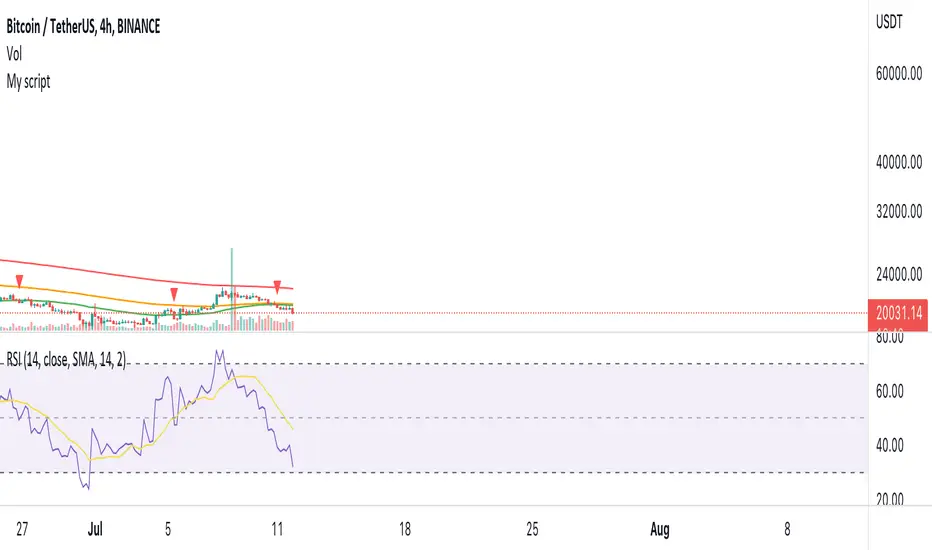
Investment Protector - A Rule of Thumb V1The Flash Crash of September 8 showed once more how many are falling to greed. On top of it one also add leverage to long positions. It's just insane the risk people are taking. Anyhow, for all my noobies and friends here is a very very simple indicator that shows when NOT to buy nor increase positions and when there is window of opportunities.
A few remarks:
This script does NOT provide trading signals
Merely points out windows of opportunities - candles with green background. You still need to find the entry in this area yourself. Apply geomeric Technical Analysis, use indicators or divergences.
Windows of opportunities can still go south, use the stop-loss! (and check for bearish divergence)
The script urges you NOT to trade below ema200 of the 4h timeframe, which is marked with a red background (the most smooh timeframe there is).
Push yourself to take profits. It is marked with on the cancles to support you. Yes, it could always go higher, but try to avoid to be in a crash (and again, use a stop-loss at all time. You can make it a generous one if you want, fine. As long as you have one.).
TA speaking:
The scripts uses EMA and RSI only.
Bearish divergence will be added in V2.
disclaimer: yes, not financial advise. It's educational.
