ST-Stochastic DashboardST-Stochastic Dashboard: User Manual & Functionality
1. Introduction
The ST-Stochastic Dashboard is a comprehensive tool designed for traders who utilize the Stochastic Oscillator. It combines two key features into a single indicator:
A standard, fully customizable Stochastic Oscillator plotted directly on your chart.
A powerful Multi-Timeframe (MTF) Dashboard that shows the status of the Stochastic %K value across three different timeframes of your choice.
This allows you to analyze momentum on your current timeframe while simultaneously monitoring for confluence or divergence on higher or lower timeframes, all without leaving your chart.
Disclaimer: In accordance with TradingView's House Rules, this document describes the technical functionality of the indicator. It is not financial advice. The indicator provides data based on user-defined parameters; all trading decisions are the sole responsibility of the user. Past performance is not indicative of future results.
2. How It Works (Functionality)
The indicator is divided into two main components:
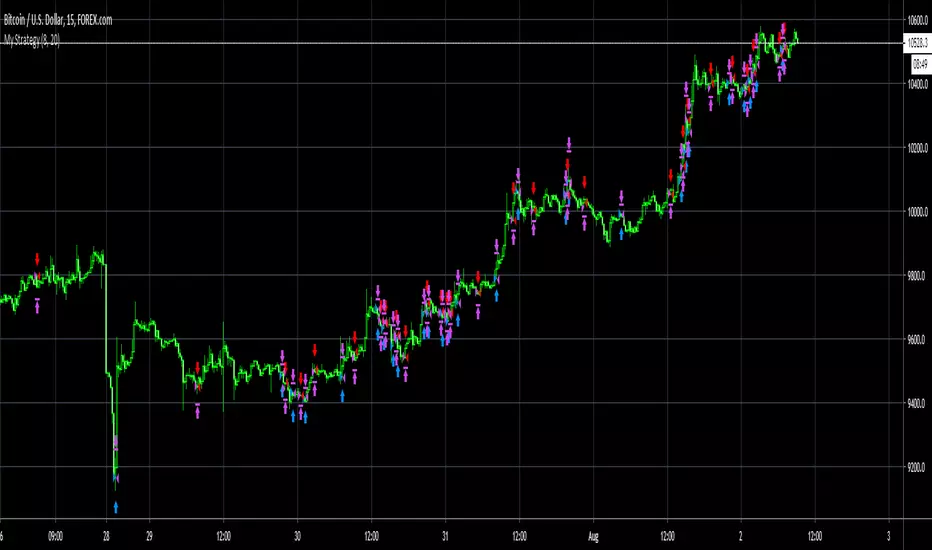
A. The Main Stochastic Indicator (Chart Pane)
This is the visual representation of the Stochastic Oscillator for the chart's current timeframe.
%K Line (Blue): This is the main line of the oscillator. It shows the current closing price in relation to the high-low range over a user-defined period. A high value means the price is closing near the top of its recent range; a low value means it's closing near the bottom.
%D Line (Black): This is the signal line, which is a moving average of the %K line. It is used to smooth out the %K line and generate trading signals.
Overbought Zone (Red Area): By default, this zone is above the 75 level. When the Stochastic lines are in this area, it indicates that the asset may be "overbought," meaning the price is trading near the peak of its recent price range.
Oversold Zone (Blue Area): By default, this zone is below the 25 level. When the Stochastic lines are in this area, it indicates that the asset may be "oversold," meaning the price is trading near the bottom of its recent price range.
Crossover Signals:
Buy Signal (Blue Up Triangle): A blue triangle appears below the candles when the %K line crosses above the Oversold line (e.g., from 24 to 26). This suggests a potential shift from bearish to bullish momentum.
Sell Signal (Red Down Triangle): A red triangle appears above the candles when the %K line crosses below the Overbought line (e.g., from 76 to 74). This suggests a potential shift from bullish to bearish momentum.
B. The Multi-Timeframe Dashboard (Table on Chart)
This is the informational table that appears on your chart. Its purpose is to give you a quick, at-a-glance summary of the Stochastic's condition on other timeframes.
Function: The script uses TradingView's request.security() function to pull the %K value from three other timeframes that you specify in the settings.
Efficiency: The table is designed to update only on the last (most recent) bar (barstate.islast) to ensure the script runs efficiently and does not slow down your chart.
Columns:
Timeframe: Displays the timeframe you have selected (e.g., '5', '15', '60').
Stoch %K: Shows the current numerical value of the %K line for that specific timeframe, rounded to two decimal places.
Status: Interprets the %K value and displays a clear status:
OVERBOUGHT (Red Background): The %K value is above the "Upper Line" setting.
OVERSOLD (Blue Background): The %K value is below the "Lower Line" setting.
NEUTRAL (Black/Dark Background): The %K value is between the Overbought and Oversold levels.
3. Settings / Parameters in Detail
You can access these settings by clicking the "Settings" (cogwheel) icon on the indicator name.
Stochastic Settings
This group controls the behavior and appearance of the main Stochastic indicator plotted in the pane.
Stochastic Period (length)
Description: This is the lookback period used to calculate the Stochastic Oscillator. It defines the number of past bars to consider for the high-low range.
Default: 9
%K Smoothing (smoothK)
Description: This is the moving average period used to smooth the raw Stochastic value, creating the %K line. A higher value results in a smoother, less sensitive line.
Default: 3
%D Smoothing (smoothD)
Description: This is the moving average period applied to the %K line to create the %D (signal) line. A higher value creates a smoother signal line that lags further behind the %K line.
Default: 6
Lower Line (Oversold) (ul)
Description: This sets the threshold for the oversold condition. When the %K line is below this value, the dashboard will show "OVERSOLD". It is also the level the %K line must cross above to trigger a Buy Signal triangle.
Default: 25
Upper Line (Overbought) (ll)
Description: This sets the threshold for the overbought condition. When the %K line is above this value, the dashboard will show "OVERBOUGHT". It is also the level the %K line must cross below to trigger a Sell Signal triangle.
Default: 75
Dashboard Settings
This group controls the data and appearance of the multi-timeframe table.
Timeframe 1 (tf1)
Description: The first timeframe to be displayed in the dashboard.
Default: 5 (5 minutes)
Timeframe 2 (tf2)
Description: The second timeframe to be displayed in the dashboard.
Default: 15 (15 minutes)
Timeframe 3 (tf3)
Description: The third timeframe to be displayed in the dashboard.
Default: 60 (1 hour)
Dashboard Position (table_pos)
Description: Allows you to select where the dashboard table will appear on your chart.
Options: top_right, top_left, bottom_right, bottom_left
Default: bottom_right
4. How to Use & Interpret
Configuration: Adjust the Stochastic Settings to match your trading strategy. The default values (9, 3, 6) are common, but feel free to experiment. Set the Dashboard Settings to the timeframes that are most relevant to your analysis (e.g., your entry timeframe, a medium-term timeframe, and a long-term trend timeframe).
Analysis with the Dashboard: The primary strength of this tool is confluence. Look for situations where multiple timeframes align. For example:
If the dashboard shows OVERSOLD on the 15-minute, 60-minute, and your current 5-minute chart, a subsequent Buy Signal on your 5-minute chart may carry more weight.
Conversely, if your 5-minute chart shows OVERSOLD but the 60-minute chart is strongly OVERBOUGHT, it could indicate that you are looking at a minor pullback in a larger downtrend.
Interpreting States:
Overbought is not an automatic "sell" signal. It simply means momentum has been strong to the upside, and the price is near its recent peak. It could signal a potential reversal, but the price can also remain overbought for extended periods in a strong uptrend.
Oversold is not an automatic "buy" signal. It means momentum has been strong to the downside. While it can signal a potential bounce, prices can remain oversold for a long time in a strong downtrend.
Use the signals and dashboard states as a source of information to complement your overall trading strategy, which should include other forms of analysis such as price action, support/resistance levels, or other indicators.
"主板非ST非次新股中,竞价排名前5的股票列表" için komut dosyalarını ara

ST Fractals With Percentage DifferenceThis indicator identifies Williams Fractals on your price chart, helping traders spot potential reversal points and short-term highs and lows. This changes default value to 1 and adds percentage difference similar to ST Fractals option on MT5
How It Works:
Up Fractals (▲): Plotted above a candle that is higher than its surrounding candles — a potential short-term top.
Down Fractals (▼): Plotted below a candle that is lower than its surrounding candles — a potential short-term bottom.
Fractals are only drawn if the price difference from the next candle exceeds a minimum percentage, to avoid signals caused by small fluctuations.
The script ensures that both up and down fractals never appear on the same candle, keeping your chart clear.
Settings:
Periods (n): Determines how many candles before and after are considered to find a fractal. Default: 2.
Min % Difference: Filters out insignificant fractals by requiring a minimum difference from the next candle. Default: 0.01%.
Usage Tips:
Can be used to identify support and resistance levels.
Often combined with trend indicators or moving averages to confirm reversals.
Works best in markets with clear trends or volatility, rather than very flat markets.
Visuals:
Green triangle ▲ → Up Fractal (potential top)
Red triangle ▼ → Down Fractal (potential bottom)

ST -Dashboard Volume MTF , [Sese04]User Guide: ST - Dashboard Volume MTF
Introduction
This script displays a multi-timeframe (MTF) volume dashboard, tracking buy and sell volumes and the moving averages of volume. It is designed for traders using ICT (Inner Circle Trader) and SMC (Smart Money Concepts) to quickly visualize market dynamics across multiple timeframes.
Settings and Features
📌 User Inputs
Customizable settings allow traders to adjust the dashboard display and volume moving averages.
Volume Display per Timeframe
show_vol_1m: Show volume for 1-minute chart.
show_vol_5m: Show volume for 5-minute chart.
show_vol_15m: Show volume for 15-minute chart.
show_vol_1h: Show volume for 1-hour chart.
show_vol_4h: Show volume for 4-hour chart.
show_vol_1d: Show volume for 1-day chart.
Volume Moving Average Settings
ma_length_short: Length of the short-term moving average (default 5 periods).
ma_length_long: Length of the long-term moving average (default 14 periods).
Dashboard Customization
dashboard_position: Dashboard position (Bottom Right, Bottom Left, Top Right, Top Left).
text_color: Text color for the dashboard.
text_size: Text size (small, normal, large).
How the Script Works
🔹 1. Calculating Buy and Sell Volume
The calculate_buy_sell function separates buy and sell volume based on the candle's open and close price:
If the closing price is higher than the opening price → Buy volume 📈.
If the closing price is lower or equal to the opening price → Sell volume 📉.
🔹 2. Retrieving Volume Data Across Multiple Timeframes
The function get_volumes collects buy and sell volume data for different timeframes using request.security().
The available timeframes are: 1m, 5m, 15m, 1h, 4h, and 1d.
🔹 3. Calculating Volume Moving Averages
The script uses ta.sma() to compute moving averages for volume trends:
ma_vol_short: Short-term moving average (e.g., 5 periods).
ma_vol_long: Long-term moving average (e.g., 14 periods).
🔹 4. Creating and Displaying the Dashboard
A table (table.new()) is generated at the last bar (barstate.islast) to display the volume data:
A title “📊 Volume Dashboard (Buy vs Sell)” in purple.
Column headers:
TIMEFRAME (e.g., 1M, 5M, 15M, 1H, 4H, 1D).
BUY VOLUME (dark blue).
SELL VOLUME (dark red).
Buy and Sell Volume values are displayed in their respective cells for easy reading.
How to Use This Script on TradingView?
Adding the Script
Open TradingView.
Go to Pine Editor and paste the script.
Click "Add to Chart".
Configuring the Settings
Open the indicator settings.
Enable/disable the desired timeframes.
Adjust the moving average lengths if necessary.
Interpreting the Data
Increasing buy volume across timeframes may indicate bullish momentum.
Rising sell volume suggests a bearish reversal.
Crossovers of volume moving averages can help detect market shifts.
Conclusion
This script is a powerful tool for analyzing volume dynamics across multiple timeframes. It provides a quick overview of the balance between buyers and sellers, essential for ICT scalping and liquidity-based trading.
🚀 Pro Tip: Combine this dashboard with other SMC indicators (engulfing candles, pivot points) to refine your trading decisions.

Linear % ST | QuantEdgeB🚀 Introducing Linear Percentile SuperTrend (Linear % ST) by QuantEdgeB
🛠️ Overview
Linear % SuperTrend (Linear % ST) by QuantEdgeB is a hybrid trend-following indicator that combines Linear Regression, Percentile Filters, and Volatility-Based SuperTrend Logic into one dynamic tool. This system is designed to identify trend shifts early while filtering out noise during choppy market conditions.
By utilizing percentile-based median smoothing and customized ATR multipliers, this tool captures both breakout momentum and pullback opportunities with precision.
✨ Key Features
🔹 Percentile-Based Median Filtering
Removes outliers and normalizes price movement for cleaner trend detection using the 50th percentile (median) of recent price action.
🔹 Linear Regression Smoothing
A smoothed baseline is computed with Linear Regression to detect the underlying trend while minimizing lag.
🔹 SuperTrend Structure with Adaptive Bands
The indicator implements an enhanced SuperTrend engine with custom ATR bands that adapt to trend direction. Bands tighten or loosen based on volatility and trend strength.
🔹 Dynamic Long/Short Conditions
Long and short signals are derived from the relationship between price and the SuperTrend threshold zones, clearly showing trend direction with optional "Long"/"Short" labels on the chart.
🔹 Multiple Visual Themes
Select from 6 built-in color palettes including Strategy, Solar, Warm, Cool, Classic, and Magic to match your personal style or strategy layout.
📊 How It Works
1️⃣ Percentile Filtering
The source price (default: close) is filtered using a nearest-rank 50th percentile over a custom lookback. This normalizes data to reflect the central tendency and removes noisy extremes.
2️⃣ Linear Regression Trend Base
A Linear Regression Moving Average (LSMA) is applied to the filtered median, forming the core trend line. This dynamic trendline provides a low-lag yet smooth view of market direction.
3️⃣ SuperTrend Engine
ATR is applied with custom multipliers (different for long and short) to create dynamic bands. The bands react to price movement and only shift direction after confirmation, preventing false flips.
4️⃣ Trend Signal Logic
• When price stays above the dynamic lower band → Bullish trend
• When price breaks below the upper band → Bearish trend
• Trend direction remains stable until violated by price.
⚙️ Custom Settings
• Percentile Length → Lookback for percentile smoothing (default: 35)
• LSMA Length → Determines the base trend via linear regression (default: 24)
• ATR Length → ATR period used in dynamic bands (default: 14)
• Long Multiplier → ATR multiplier for bullish thresholds (default: 0.8)
• Short Multiplier → ATR multiplier for bearish thresholds (default: 1.9)
✅ How to Use
1️⃣ Trend-Following Strategy
✔️ Go Long when price breaks above the lower ATR band, initiating an upward trend
✔️ Go Short when price falls below the upper ATR band, confirming bearish conditions
✔️ Remain in trend direction until the SuperTrend flips
2️⃣ Visual Confirmation
✔️ Use bar coloring and the dynamic bands to stay aligned with trend direction
✔️ Optional Long/Short labels highlight key signal flips
👥 Who Should Use Linear % ST?
✅ Swing & Position Traders → To ride trends confidently
✅ Trend Followers → As a primary directional filter
✅ Breakout Traders → For clean signal generation post-range break
✅ Quant/Systematic Traders → Integrate clean trend logic into algorithmic setups
📌 Conclusion
Linear % ST by QuantEdgeB blends percentile smoothing with linear regression and volatility bands to deliver a powerful, adaptive trend-following engine. Whether you're a discretionary trader seeking cleaner entries or a systems-based trader building logic for automation, Linear % ST offers clarity, adaptability, and precision in trend detection.
🔹 Key Takeaways:
1️⃣ Percentile + Regression = Noise-Reduced Core Trend
2️⃣ ATR-Based SuperTrend = Reliable Breakout Confirmation
3️⃣ Flexible Parameters + Color Modes = Custom Fit for Any Strategy
📈 Use it to spot emerging trends, filter false signals, and stay confidently aligned with market momentum.
📌 Disclaimer: Past performance is not indicative of future results. No trading strategy can guarantee success in financial markets.
📌 Strategic Advice: Always backtest, optimize, and align parameters with your trading objectives and risk tolerance before live trading.

Mutanabby_AI __ OSC+ST+SQZMOMMutanabby_AI OSC+ST+SQZMOM: Multi-Component Trading Analysis Tool
Overview
The Mutanabby_AI OSC+ST+SQZMOM indicator combines three proven technical analysis components into a unified trading system, providing comprehensive market analysis through integrated oscillator signals, trend identification, and volatility assessment.
Core Components
Wave Trend Oscillator (OSC): Identifies overbought and oversold market conditions using exponential moving average calculations. Key threshold levels include overbought zones at 60 and 53, with oversold areas marked at -60 and -53. Crossover signals between the two oscillator lines generate entry opportunities, displayed as colored circles on the chart for easy identification.
Supertrend Indicator (ST): Determines overall market direction using Average True Range calculations with a 2.5 factor and 10-period ATR configuration. Green lines indicate confirmed uptrends while red lines signal downtrend conditions. The indicator automatically adapts to market volatility changes, providing reliable trend identification across different market environments.
Squeeze Momentum (SQZMOM): Compares Bollinger Bands with Keltner Channels to identify consolidation periods and potential breakout scenarios. Black squares indicate squeeze conditions representing low volatility periods, green triangles signal confirmed upward breakouts, and red triangles mark downward breakout confirmations.
Signal Generation Logic
Long Entry Conditions:
Green triangles from Squeeze Momentum component
Supertrend line transitioning to green
Bullish crossovers in Wave Trend Oscillator from oversold territory
Short Entry Conditions:
Red triangles from Squeeze Momentum component
Supertrend line transitioning to red
Bearish crossovers in Wave Trend Oscillator from overbought territory
Automated Risk Management
The indicator incorporates comprehensive risk management through ATR-based calculations. Stop losses are automatically positioned at 3x ATR distance from entry points, while three progressive take profit targets are established at 1x, 2x, and 3x ATR multiples respectively. All risk management levels are clearly displayed on the chart using colored lines and informative labels.
When trend direction changes, the system automatically clears previous risk levels and generates new calculations, ensuring all risk parameters remain current and relevant to existing market conditions.
Alert and Notification System
Comprehensive alert framework includes trend change notifications with complete trade setup details, squeeze release alerts for breakout opportunity identification, and trend weakness warnings for active position management. Alert messages contain specific trading pair information, timeframe specifications, and all relevant entry and exit level data.
Implementation Guidelines
Timeframe Selection: Higher timeframes including 4-hour and daily charts provide the most reliable signals for position trading strategies. One-hour charts demonstrate good performance for day trading applications, while 15-30 minute timeframes enable scalping approaches with enhanced risk management requirements.
Risk Management Integration: Limit individual trade risk to 1-2% of total capital using the automatically calculated stop loss levels for precise position sizing. Implement systematic profit-taking at each target level while adjusting stop loss positions to protect accumulated gains.
Market Volatility Adaptation: The indicator's ATR-based calculations automatically adjust to changing market volatility conditions. During high volatility periods, risk management levels appropriately widen, while low volatility conditions result in tighter risk parameters.
Optimization Techniques
Combine indicator signals with fundamental support and resistance level analysis for enhanced signal validation. Monitor volume patterns to confirm breakout strength, particularly when Squeeze Momentum signals develop. Maintain awareness of scheduled economic events that may influence market behavior independent of technical indicator signals.
The multi-component design provides internal signal confirmation through multiple alignment requirements, significantly reducing false signal occurrence while maintaining reasonable trade frequency for active trading strategies.
Technical Specifications
The Wave Trend Oscillator utilizes customizable channel length (default 10) and average length (default 21) parameters for optimal market sensitivity. Supertrend calculations employ ATR period of 10 with factor multiplier of 2.5 for balanced signal quality. Squeeze Momentum analysis uses Bollinger Band length of 20 periods with 2.0 multiplication factor, combined with Keltner Channel length of 20 periods and 1.5 multiplication factor.
Conclusion
The Mutanabby_AI OSC+ST+SQZMOM indicator provides a systematic approach to technical market analysis through the integration of proven oscillator, trend, and momentum components. Success requires thorough understanding of each element's functionality and disciplined implementation of proper risk management principles.
Practice with demo trading accounts before live implementation to develop familiarity with signal interpretation and trade management procedures. The indicator's systematic approach effectively reduces emotional decision-making while providing clear, objective guidelines for trade entry, management, and exit strategies across various market conditions.

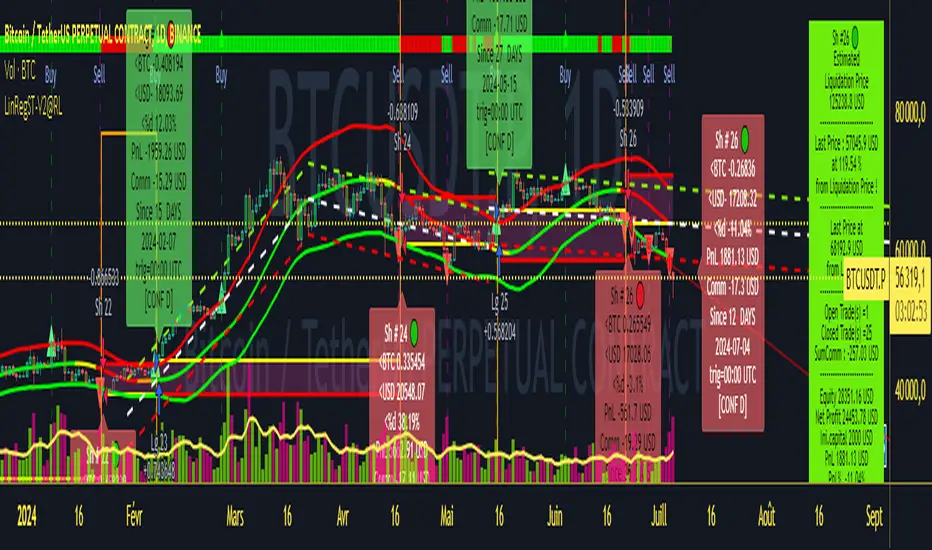
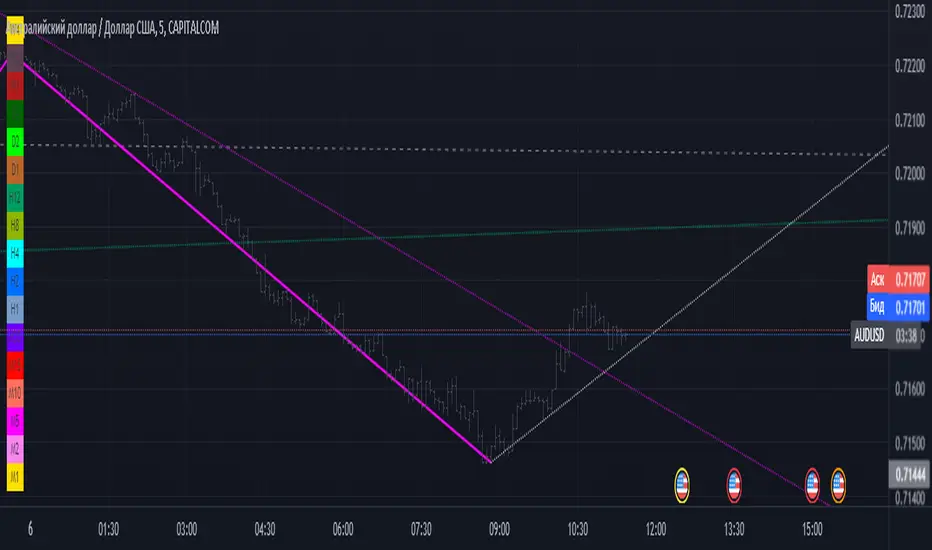
Strategy LinReg ST@RLStrategy LinReg ST@RL
Strategy LinReg ST@RL is a visual trend following indicator.
It is compiled in PINE Script Version V5 language.
This indicator/strategy, based on Linear Regression Calculation, is intended to help beginners (and also the more experienced ones) to trade in the right direction of the market trend and test strategy. It allows you to avoid the mistakes of always trading against the trend.
Strategy based on an original idea of @KivancOzbilgic (SuperTrend) and DevLucem (@LucemAnb) (Lin Reg ++)
A special credit goes to - KivancOzbilgic and @LucemAnb which inspired me a lot to improve this indicator/Strategy.
This indicator can be configured to your liking,according to your needs or your tastes.
The indicator/Strategy works in multi time frame.
The settings (length, offset, deviation, smoothing) are identical for all time frames if “Conf Auto” is not checked.
In this case the default settings (time frame=H1 settings) apply for all time frames.
The choice of source setting is common for all time frames.
If “Auto Conf” is checked,
then the settings will be optimized for each selected time frame (1m-3m H2 H3 H1 H4 & Daily). Time frames, other than 1m-3m H2 H3 H1 H4 & Daily will be affected with the default settings corresponding to the H1 time frame and will therefore not be optimized! The default setting values of each time frame (1m-3m H2 H3 H1 H4 & Daily) can be configured differently and optimized by you.
REVERSAL mode: Signal Buy=Sell and Signal Sell=Buy.
This option may be better than the regular strategy. Default mode is Reversal option.
Note that only for 1m (1 minute) Time frame, the option REVERSAL is opposite as default choice in configuration. (If reversal option is checked, then option for time frame 1m is not reversal!)
Trend indications (potential sell or buy areas) are displayed as a background color (bullish: green or bearish: red), assume that the market is moving in one direction.
You can tune the input, style and visibility settings to match your own preferences or habits.
Label Info (Simple or Full) gives trend info for each Exit (or current trade)
The choice of indicator colors is suitable for a graph with a "dark" theme, which you will probably need to modify for visual comfort, if you are using a "Light" mode or a custom mode.
This script is an indicator that you can run on standard chart types. It also works on non-standard chart types but the results will be skewed and different.
Non-standard charts are:
• Heikin Ashi (HA)
• Renko
• Kagi
• Point & Figure
• Range
As a reminder: No indicator is capable of providing accurate signals 100% of the time. Every now and then, even the best will fail, leaving you with a losing deal. Whichever indicator you base yourself on, remember to follow the basic rules of risk management and capital allocation.
BINANCE:BTCUSDT
! Français !
Strategy LinReg ST@RL
Stratégie LinReg ST@RL est un indicateur visuel de suivi de tendance.
Il est compilé en langage PINE Script Version V5.
Stratégie basée sur une idée originale de @KivancOzbilgic (SuperTrend) et DevLucem (@LucemAnb) (Lin Reg ++) Un crédit spécial va à - KivancOzbilgic et @LucemAnb qui m'ont beaucoup inspiré pour améliorer cet indicateur/stratégie.
Cet indicateur/strategie, basé sur le calcul de régression linéaire, est destiné à aider les débutants (et aussi les plus expérimentés) à trader dans le bon sens de la tendance du marché et à tester la stratégie. Cela vous permet d'éviter les erreurs de toujours négocier à contre-courant.
Cet indicateur peut être configuré à votre guise, selon vos besoins ou vos goûts.
L'indicateur/Stratégie fonctionne sur plusieurs bases de temps.
Les réglages (longueur, décalage, déviation, lissage) sont identiques pour toutes les bases de temps si
« Conf Auto » n'est pas coché. Dans ce cas, les paramètres par défaut (intervalle de temps=paramètres H1) s'appliquent à toutes les bases de temps.
Le choix du réglage de la source est commun à toutes les bases de temps.
Si "Auto Conf" est coché, alors les paramètres seront optimisés pour chaque base de temps sélectionnée (1m-3m H2 H3 H1 H4 & Daily). Les bases de temps, autres que 1m-3m H2 H3 H1 H4 & Daily seront affectées par les paramètres par défaut correspondant à la base de temps H1 et ne seront donc pas optimisées ! Les valeurs de réglage par défaut de chaque période (1m-3m H2 H3 H1 H4 & Daily) peuvent être configurées différemment et optimisées par vous.
Mode REVERSAL : Signal Achat=Vente et Signal Vente=Achat. Cette option peut être meilleure que la stratégie habituelle. Le mode par défaut est l'option REVERSAL.
Notez que seulement pour la base de temps de 1m (1 minute), l'option REVERSAL est l’opposée du choix par défaut dans la configuration. (Si l'option REVERSAL est cochée, alors l'option pour la base de temps 1 m n'est pas REVERSAL !)
Les indications de tendance (zones potentielles de vente ou d'achat) sont affichées en couleur de fond (haussier : vert ou baissier : rouge), supposons que le marché évolue dans une direction. Vous pouvez ajuster les paramètres d'entrée, de style et de visibilité en fonction de vos propres préférences ou habitudes.
Les informations sur l'étiquette (simples ou complètes) donnent des informations sur de chaque clôture (ou position en cours)
Le choix des couleurs des indicateurs est adapté à un graphique avec un thème "sombre", qu'il vous faudra probablement modifier pour le confort visuel, si vous utilisez un mode "Clair" ou un mode personnalisé.
Ce script est un indicateur que vous pouvez exécuter sur des types de graphiques standard. Cela fonctionne également sur les types de graphiques non standard, mais les résultats seront faussés et différents.
Les graphiques non standard sont :
• Heikin Ashi (HA)
• Renko
• Kagi
• Point & Figure
• Range
Pour rappel : Aucun indicateur n'est capable de fournir des signaux précis 100% du temps. De temps en temps, même les meilleurs échoueront, vous laissant avec une affaire perdante. Quel que soit l'indicateur sur lequel vous vous basez, rappelez-vous de suivre les règles de base de la gestion des risques et de l'allocation du capital.
ICT Structure Levels (ST/IT/LT) - v7 (by Jonas E)ICT Structure Levels (ST/IT/LT) – Neighbor-Wick Pivots
This indicator is designed for traders following ICT-style market structure analysis. It identifies Short-Term (ST), Intermediary (IT), and Long-Term (LT) swing highs and lows, but with a stricter filter that reduces false signals.
Unlike standard pivot indicators, this script requires not only that a bar makes a structural high/low, but also that the neighboring bars’ extremes are formed by wicks rather than flat-bodied candles. This wick condition helps confirm that the level is a true liquidity sweep and not just random price action.
How it works (conceptual):
Detects pivots based on user-defined left/right bars.
Validates that extremes on both sides of the pivot are wick-driven (high > body for highs, low < body for lows).
Marks valid STH/STL, ITH/ITL, and LTH/LTL directly on the chart with optional price labels.
Uses ATR offset for better label readability.
Alerts can be enabled to notify when a new structural level is confirmed.
How to use it:
Map market structure across multiple layers (ST/IT/LT).
Identify true liquidity grabs and avoid false highs/lows.
Integrate with Break of Structure (BOS) and Change of Character (CHoCH) strategies.
Combine with other ICT concepts (Order Blocks, Fair Value Gaps, Liquidity Pools).
What makes it unique:
Most pivot indicators mark every high/low indiscriminately. This script filters pivots using wick validation, which significantly reduces noise and focuses only on the levels most relevant to liquidity-based trading strategies.

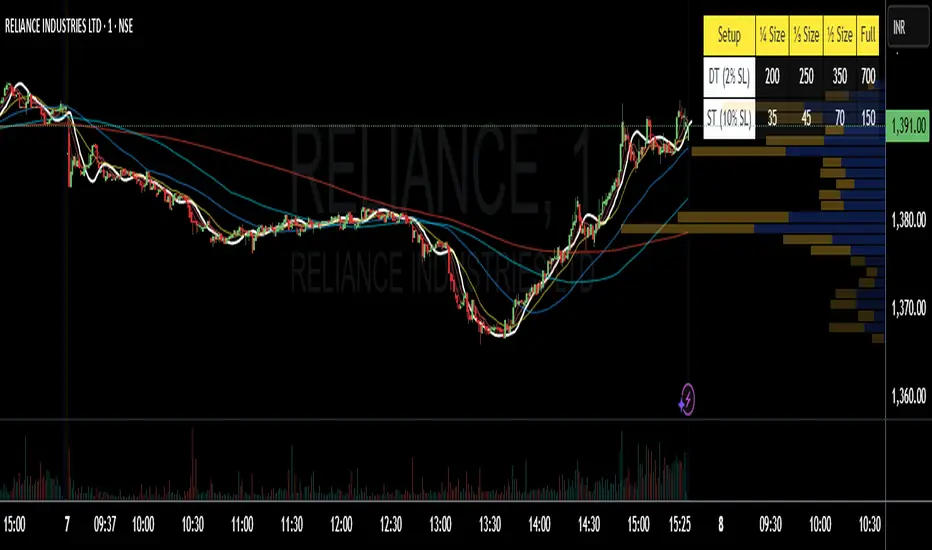
Position Size 📐 DT/ST (Today's Open)💡 Purpose:
This indicator automatically calculates intraday (DT) and swing trading (ST) position sizes based on your account capital, risk per trade, and stop-loss percentage, using today’s daily open price as the entry price reference.
⚙️ Main Functionalities:
Dynamic Position Sizing
Calculates Full size position based on the maximum risk you allow per trade.
Breaks it down into ¼ Size, ⅓ Size, and ½ Size positions for flexible scaling.
Two Distinct Trading Styles:
DT (Day Trading) – Uses your specified intraday stop-loss % (default: 2%).
ST (Swing Trading) – Uses your specified swing stop-loss % (default: 10%).
Lot Size Rounding
Automatically rounds quantities to a chosen lot size (e.g., 1 for cash equity or futures lot size for derivatives).
Customizable Table Position
Display the table anywhere on your chart: Top Right, Top Left, Bottom Right, or Bottom Left.
Optimized for Dark or Light Themes
Yellow header with black text for visibility.
Blue row labels for strategy type.
Grey background with white text for calculated values.
Live Market Adaptation
All values update in real-time as today’s daily open price changes (on new daily candles).
Works for any symbol, asset class, or time frame.
🧮 Formula:
Position Size (Full) = Max Risk ₹ / (Price × StopLoss%)
¼, ⅓, and ½ Sizes = Scaled from Full size
📌 Ideal For:
Traders who want quick, ready-to-use position sizes right on their chart.
Those who follow fixed risk-per-trade and need fast decision-making without manual calculations.
DMI & ST DEV zone intersection [LM]Hello Traders,
This indicator uses two indicators st dev extremes and DMI extremes and visualize intersection of both indicators extreme zones using crosses. It means where cross is rendered intersection of extremes has occurred.
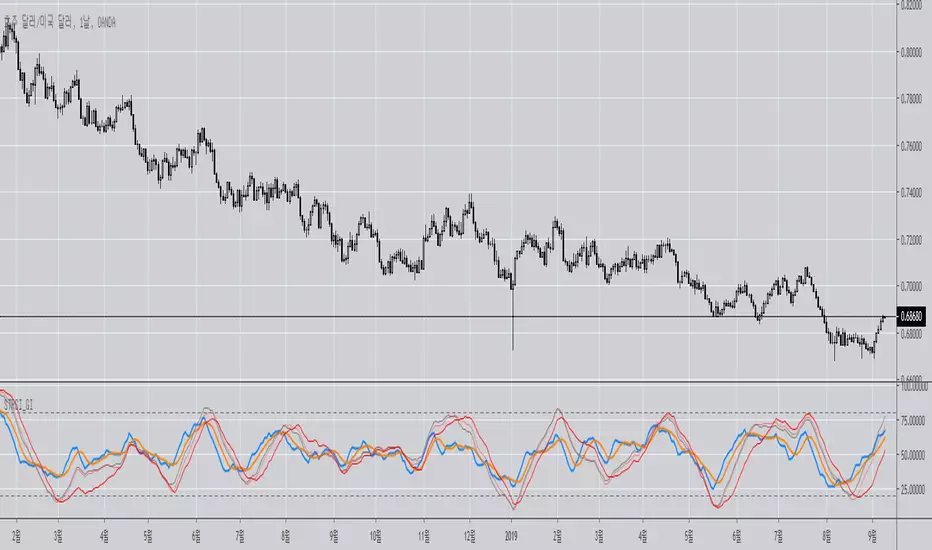
The standard deviation uses the same calculation as my Standard deviation zones Support & Resistance indicator, DMI indicator measures both the strength and direction of a price movement. I am using both indicators to find the intersection of extreme zones between them.
ST DEV settings:
source
tops setting
bottom setting
DMI settings:
length settings
extreme zone setting
Enjoy,
Lukas

KAMA Cloud STIndicator:
Description:
The KAMA Cloud indicator is a sophisticated trading tool designed to provide traders with insights into market trends and their intensity. This indicator is built on the Kaufman Adaptive Moving Average (KAMA), which dynamically adjusts its sensitivity to filter out market noise and respond to significant price movements. The KAMA Cloud leverages multiple KAMAs to gauge trend direction and strength, offering a visual representation that is easy to interpret.
How It Works:
The KAMA Cloud uses twenty different KAMA calculations, each set to a distinct lookback period ranging from 5 to 100. These KAMAs are calculated using the average of the open, high, low, and close prices (OHLC4), ensuring a balanced view of price action. The relative positioning of these KAMAs helps determine the direction of the market trend and its momentum.
By measuring the cumulative relative distance between these KAMAs, the indicator effectively assesses the overall trend strength, akin to how the Average True Range (ATR) measures market volatility. This cumulative measure helps in identifying the trend’s robustness and potential sustainability.
The visualization component of the KAMA Cloud is particularly insightful. It plots a 'cloud' formed between the base KAMA (set at a 100-period lookback) and an adjusted KAMA that incorporates the cumulative relative distance scaled up. This cloud changes color based on the trend direction — green for upward trends and red for downward trends, providing a clear, visual representation of market conditions.
How the Strategy Works:
The KAMA Cloud ST strategy employs multiple KAMA calculations with varying lengths to capture the nuances of market trends. It measures the relative distances between these KAMAs to determine the trend's direction and strength, much like the original indicator. The strategy enhances decision-making by plotting a 'cloud' formed between the base KAMA (set to a 100-period lookback) and an adjusted KAMA that scales according to the cumulative relative distance of all KAMAs.
Key Components of the Strategy:
Multiple KAMA Layers: The strategy calculates KAMAs for periods ranging from 5 to 100 to analyze short to long-term market trends.
Dynamic Cloud: The cloud visually represents the trend’s strength and direction, updating in real-time as the market evolves.
Signal Generation: Trade signals are generated based on the orientation of the cloud relative to a smoothed version of the upper KAMA boundary. Long positions are initiated when the market trend is upward, and the current cloud value is above its smoothed average. Conversely, positions are closed when the trend reverses, indicated by the cloud falling below the smoothed average.
Suggested Usage:
Market: Stocks, not cryptocurrency
Timeframe: 1 Hour
Indicator:

st 47Усредненный Ишимоку (Custom: 9/48/96) [V6]st47 — Volume in Clouds
This indicator is a custom Ichimoku Cloud modification that dynamically reacts to market volume.
The color intensity of the Kumo (cloud) changes depending on the current trading volume — brighter clouds indicate stronger activity, while dimmer ones reflect low participation.
Key Features:
• Based on the Ichimoku Cloud system (8/48/96 settings)
• Volume-sensitive cloud visualization
• Works on any timeframe and pair
• Supports multi-ticker averaging (BTCUSDT, BTCUSDT.P, etc.)
• Displays additional volume histogram below the chart
Purpose:
Helps visualize both trend structure and the strength behind it by combining Ichimoku logic with real-time volume dynamics.

Relative Momentum Index- Fatih Küst alt 80-20 ayarlanmış momentum
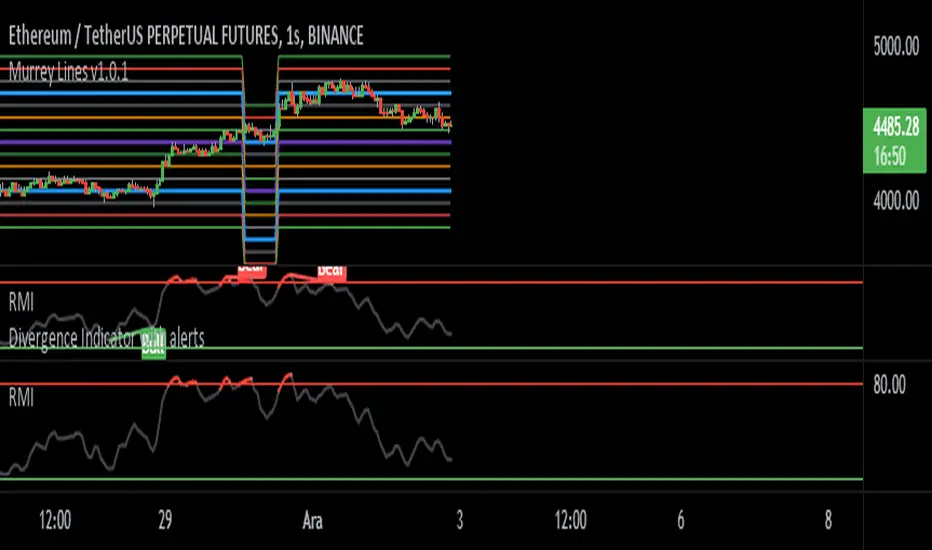
Usage:
Add your favorite oscillator, RSI , Klinger , TSI, CMF , or anything else to a chart.
Click the little ... (More) on the oscillator.
Then add this indicator "Divergence Indicator (any oscillator)" on your oscillator of choice.
Click the settings on this indicator and make sure the source is set to the right plot from your oscillator.
Watch for it to plot divergences...
Add this indicator a second time on the price chart (and select the same oscillator plot), but check the box "plot on price (rather than on indicator)""
See you divergence plotted on price (as well as on the oscillator)
[ST] S/R density study v3This algorithm draws supports/resistance levels automatically based on historic candle density at each height. The basic idea is the levels where price is rejected quickly is likely to have fewer candles in the past than the levels above and below. This does not take volume into account. The lookback and number of levels has to be kept low to prevent too many calculations. I haven't looked if there's new pinescript features to let me do this more efficiently yet.
It checks for candle density to decrease once or twice and then increase once or twice before it draws a line at that lowest level. There's an option to draw more lines by only checking for a single decrease and increase.
It likely won't catch all the levels but it seems to get a good amount to help me position stops on other side of S/R or exits on the trade side of S/R.
I've been meaning to share more scripts but keep forgetting. Keeping my scripts free but feel free to like or tip haha.

#ST Quarters Theory LQPLarge Quarter Point Theory Information on the strategy is freely available on the web

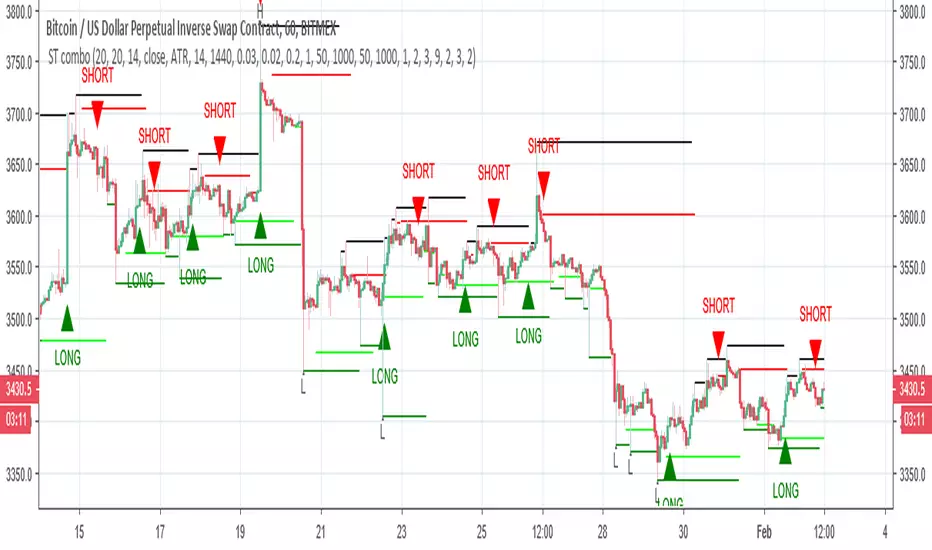
ST comboThis model try to combine super trend with Psars and pivots high and lows
the buy is buy the super trend , the sell is either pivots high points, Psar or supertrend
there is another option for buy and sell by Psar and pivots (buy again or sell again)
both have stop loss and take profit
The Psar is calculated different from regular Psar but it will give the signals the same

[ST] Volume Flow v6Latest update to the volume flow indicator. It calculates volume fraction up and down based on candle shape: body counts twice one way, wicks count both ways. Total volume (positive + negative) is the regular volume. Additionally, I added breakout detection, oscillator, colored candles for easy trend following, reversal warnings, high and low volume alarms. Every aspect uses volume for calculations.
What some parts mean : i.imgur.com
Hope this helps someone, I use it myself as signals for confirmations. Tips are cool, but saying thanks is plenty as well :)

[ST] obv adl combination v4modified equation using sum of volume*hlc3*(close-open)/(high-low) to give more accuracy of distribution within a single candle unlike regular obv.
