LBR 3-10 OscillatorThis is a variation of MACD popularised by Linda Bradford Raschke. Instead of the regular MACD settings, the this indicator uses simple moving averages, not exponential moving averages, and a setting of 3 for the fast MA, 10 for the slow MA and 16 for the signal line.
The signal line (red) acts as a trend indicator, with crossings of the zero line indicating trend changes, while the MACD line (blue) acts as a short term momentum indicator.
Setups:
- First cross: This is basically selling or buying at the first pullback after a trend change. Buy or sell after the signal line has crossed the zero line and the MACD crosses the signal line for the first time after the trend change. Use price action to time the entry after the pullback — you don't need to wait for the MACD to cross the signal line again.
- Pullback in a trend: The MACD crosses the signal line in the opposite direction of the trend irregardless of when the trend change occurred. Use price action to time the entry.
- Divergence: The MACD line shows a pattern diverging form price (e.g. makes higher lows whereas price makes lower lows). This can be an indication of trend reversal or waning.
In the indicator's input panel there is an option for showing standard deviation bands (turned off by default). MACD line crossing the standard deviation bands can indicate oversold and overbought conditions.
The indicator comes with the following alerts:
- First cross downtrend
- First cross uptrend
- Pullback in downtrend
- Pullback in uptrend
- Trend change down
- Trend change up
Sources:
lindaraschke.net
www.netpicks.com
"中海油+10年股价涨幅" için komut dosyalarını ara


10 Simple Moving Averages With Colors10 Simple Moving Averages With Colors change When It's below or above the price

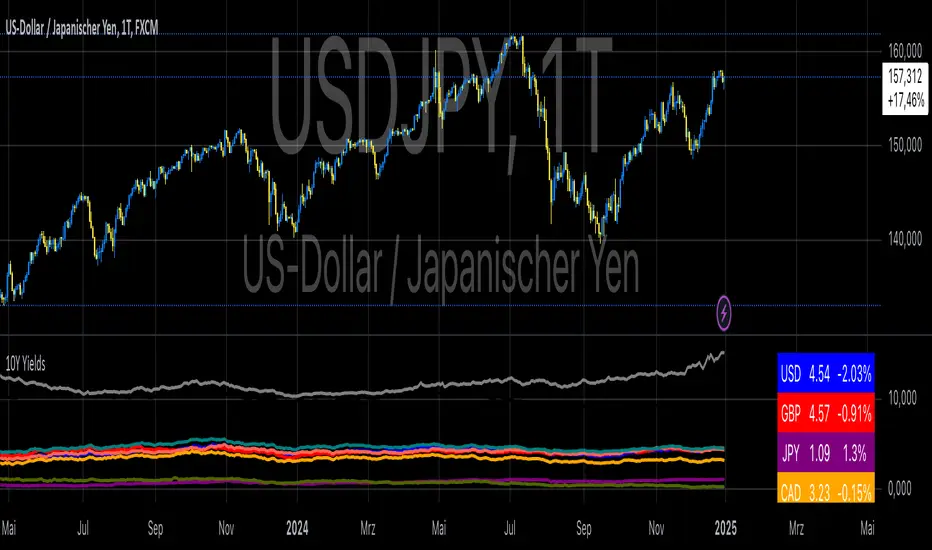
10-Year Yields Table for Major CurrenciesThe "10-Year Yields Table for Major Currencies" indicator provides a visual representation of the 10-year government bond yields for several major global economies, alongside their corresponding Rate of Change (ROC) values. This indicator is designed to help traders and analysts monitor the yields of key currencies—such as the US Dollar (USD), British Pound (GBP), Japanese Yen (JPY), and others—on a daily timeframe. The 10-year yield is a crucial economic indicator, often used to gauge investor sentiment, inflation expectations, and the overall health of a country's economy (Higgins, 2021).
Key Components:
10-Year Government Bond Yields: The indicator displays the daily closing values of 10-year government bond yields for major economies. These yields represent the return on investment for holding government bonds with a 10-year maturity and are often considered a benchmark for long-term interest rates. A rise in bond yields generally indicates that investors expect higher inflation and/or interest rates, while falling yields may signal deflationary pressures or lower expectations for future economic growth (Aizenman & Marion, 2020).
Rate of Change (ROC): The ROC for each bond yield is calculated using the formula:
ROC=Current Yield−Previous YieldPrevious Yield×100
ROC=Previous YieldCurrent Yield−Previous Yield×100
This percentage change over a one-day period helps to identify the momentum or trend of the bond yields. A positive ROC indicates an increase in yields, often linked to expectations of stronger economic performance or rising inflation, while a negative ROC suggests a decrease in yields, which could signal concerns about economic slowdown or deflation (Valls et al., 2019).
Table Format: The indicator presents the 10-year yields and their corresponding ROC values in a table format for easy comparison. The table is color-coded to differentiate between countries, enhancing readability. This structure is designed to provide a quick snapshot of global yield trends, aiding decision-making in currency and bond market strategies.
Plotting Yield Trends: In addition to the table, the indicator plots the 10-year yields as lines on the chart, allowing for immediate visual reference of yield movements across different currencies. The plotted lines provide a dynamic view of the yield curve, which is a vital tool for economic analysis and forecasting (Campbell et al., 2017).
Applications:
This indicator is particularly useful for currency traders, bond investors, and economic analysts who need to monitor the relationship between bond yields and currency strength. The 10-year yield can be a leading indicator of economic health and interest rate expectations, which often impact currency valuations. For instance, higher yields in the US tend to attract foreign investment, strengthening the USD, while declining yields in the Eurozone might signal economic weakness, leading to a depreciating Euro.
Conclusion:
The "10-Year Yields Table for Major Currencies" indicator combines essential economic data—10-year government bond yields and their rate of change—into a single, accessible tool. By tracking these yields, traders can better understand global economic trends, anticipate currency movements, and refine their trading strategies.
References:
Aizenman, J., & Marion, N. (2020). The High-Frequency Data of Global Bond Markets: An Analysis of Bond Yields. Journal of International Economics, 115, 26-45.
Campbell, J. Y., Lo, A. W., & MacKinlay, A. C. (2017). The Econometrics of Financial Markets. Princeton University Press.
Higgins, M. (2021). Macroeconomic Analysis: Bond Markets and Inflation. Harvard Business Review, 99(5), 45-60.
Valls, A., Ferreira, M., & Lopes, M. (2019). Understanding Yield Curves and Economic Indicators. Financial Markets Review, 32(4), 72-91.
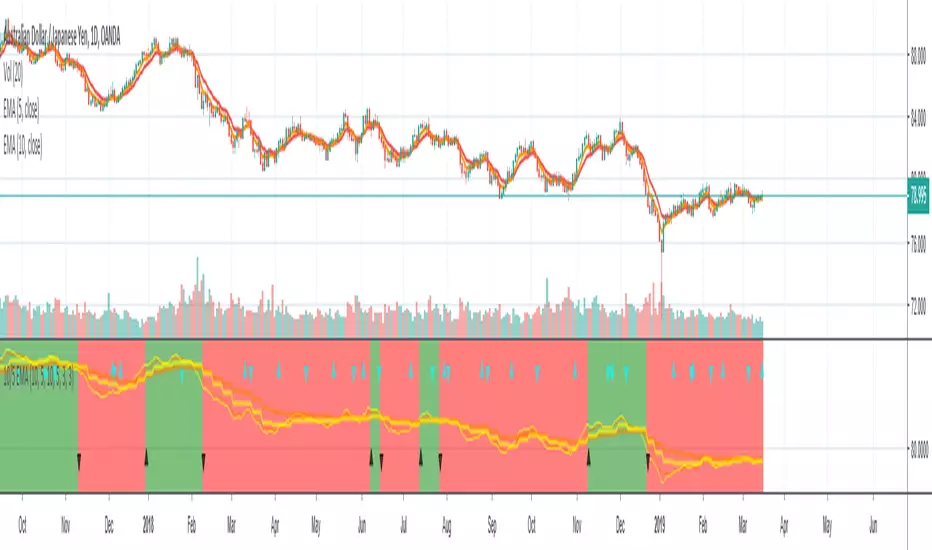
10/5 Weekly/Daily EMAs with ConfirmationsPlots Daily and Weekly 10 & 5 EMAs (but fully customizable to your own).
In addition to plotting the EMAs it color coordinates trend bias and has cross confirmation signals.
Philosophy and how to read:
I use this indicator when trading strictly on the daily timeframe. I have not tested it on other timeframes.
In my trade system I start with both the monthly and weekly charts to define overall bias.
Here’s the general rule of thumb.
10 EMA is direction (bias) and 5 EMA is price.
If 5EMA is below 10EMA there is a bear bias. If 5EMA is above 10EMA there is a bull bias.
This indicator will plot both the daily and weekly 10 & 5 EMAs.
It will also color code the background based on how these EMAs relate to each other.
Light red typically is just the daily is confirmed bear (typically because it could be either or)
Dark red, both daily and weekly in confirmed bear.
Light green, typically just daily is confirmed bull (typically because it could be either or)
Dark green, both daily and weekly in confirmed bull.
In addition to background highlight there is confirmation crosses.
The daily confirmation cross is default yellow triangle.
Down triangle is 5 crossing the 10 downward.
Up triangle is the 5 crossing the 10 upward.
The weekly confirmation is the same only is aqua color.
Generally, on a color change you want to see one or both confirmation in the direction of the bias change.
If you only want to plot the daily bias in the options unclick the setting: Include Weekly Background Plotting. Unclicking this will remove the background coloring for the weekly bias. This might be helpful if you only want to see the strength of what the weekly timeframe is telling you.
Also, I’m primarily a trend trader but I also do have a reversal system I trade with lower R:R parameters.
A good reversal confirmation signal I’ve noticed is the instrument that you are trading should go through a cycle of light color to dark color.
You could also create alerts with this indicator based on just signals. When the signal fires the value will be 1.
Future Updates:
I want to find some way to correlate the distance between these EMAs to enhance the signal. Also to include a velocity component. Plus a few more things.
If you like this indicator please like and leave a comment down below.
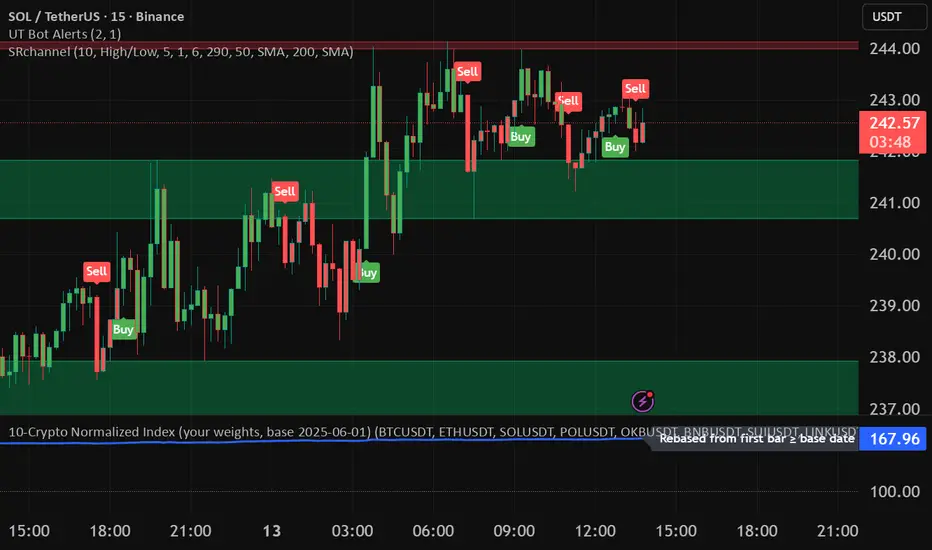
10-Crypto Normalized IndexOverview
This indicator builds a custom index for up to 10 cryptocurrencies and plots their combined trend as a single line. Each coin is normalized to 100 at a user-selected base date (or at its first available bar), then averaged (equally or by your custom weights). The result lets you see the market direction of your basket at a glance.
How it works
For each symbol, the script finds a base price (first bar ≥ the chosen base date; or the first bar in history if base-date normalization is off).
It converts the current price to a normalized value: price / base × 100.
It then computes a weighted average of those normalized values to form the index.
A dotted baseline at 100 marks the starting point; values above/below 100 represent % performance vs. the base.
Key inputs
Symbols (10 max): Default set: BTC, ETH, SOL, POL, OKB, BNB, SUI, LINK, 1INCH, TRX (USDT pairs). You can change exchange/quote (keep all the same quote, e.g., all USDT).
Weights: Toggle equal weights or enter custom weights. Custom weights are auto-normalized internally, so they don’t need to sum to 1.
Base date: Year/Month/Day (default: 2025-06-01). Turning normalization off uses each symbol’s first available bar as its base.
Smoothing: Optional SMA to reduce noise.
Show baseline: Toggle the horizontal line at 100.
Interpretation
Index > 100 and rising → your basket is up since the base date.
Index < 100 and falling → down since the base date.
Use shorter timeframes for intraday sentiment, higher timeframes for swing/trend context.
Default basket & weights (editable)
Order: BTC, ETH, SOL, POL, OKB, BNB, SUI, LINK, 1INCH, TRX.
Default custom weight factors: 30, 30, 20, 10, 10, 5, 5, 5, 5, 5 (auto-normalized).
Base date: 2025-06-01.
10 Monday's 1H Avg Range + 30-Day Daily RangeWhat This Script Does
This indicator is designed for traders who want to monitor volatility and range behavior at the start of the trading week . It focuses specifically on the first four 15-minute candles of each Monday and tracks their combined high-low range over time.
How It Works
Monday 1H Range Detection:
Each week, it automatically detects and highlights the first 4 candles of Monday on a 15-minute chart (1 hour total). It calculates the range between the highest high and lowest low of these candles.
10-Week Average of Monday 1H Ranges:
It stores and averages the last 10 such ranges, displaying this average in a table for weekly comparison.
30-Day Daily Range Average:
Separately, it calculates the average daily range (high – low) of the last 30 daily candles. This value helps put the Monday 1H range into broader context and can guide Stop Loss or TP planning.
Dynamic Labeling & Visual Highlights:
The script visually highlights the first 4 candles of Monday and places a label showing the pip range once the 4 candles have completed. It also updates a small table with the two averages described above.
How to Use It
Use it on the 15-minute timeframe to activate the Monday 1H logic.
Compare the current week’s Monday range to the 10-week average to see if volatility is increasing or decreasing.
Use the 30-day daily range to determine if the Monday opening movement is unusually large or small.
Consider adjusting trade entries, stops, or targets if the Monday range is disproportionately large compared to recent historical behavior.
What Makes It Original?
This is not a typical volatility indicator like ATR or standard deviation. Instead, it’s a purpose-built tool combining:
Time-specific behavior (first hour of the week),
Historical contextualization (10-week average tracking),
A dual-timeframe analysis (15-min + daily),
A user-friendly table and visual interface.
This script helps intraday or swing traders spot abnormal volatility early in the week and adjust their strategies accordingly—especially in fast-moving Forex or Index markets.

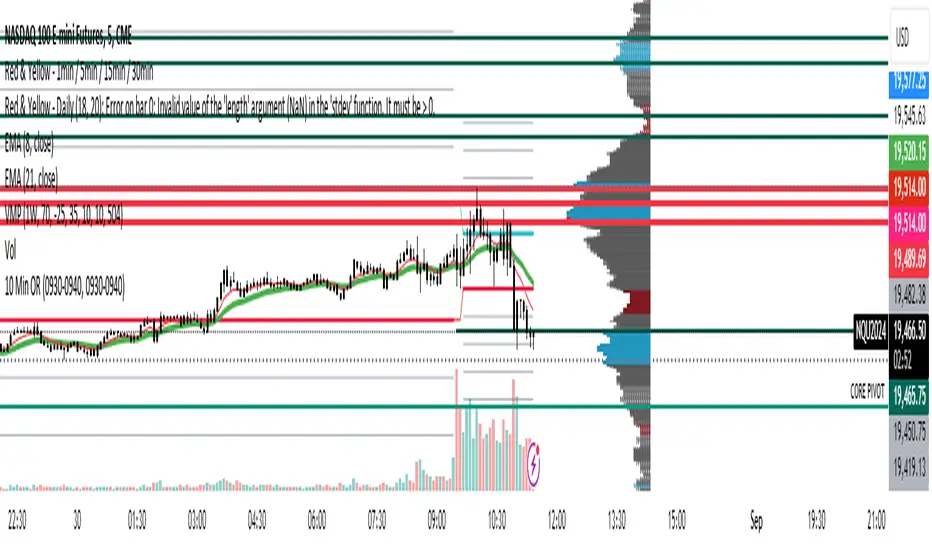
10 Minute Futures Session Open RangeInspired by SamRecio's 30sec OR script.
The 10 minute Opening Range (OR) dynamically identifies and visualizes the opening range of a trading session within the first 10 minutes after the market opens at 9:30 AM EST, concluding at 4:00 PM EST, reflecting the typical trading hours for U.S. stock exchanges. This indicator is particularly useful for strategies that rely on the initial market momentum and direction established during the early moments of the trading session.
Upon activation, the indicator calculates the highest (orHigh) and lowest (orLow) price levels reached during the first 10 minutes of the trading session, marking these levels with green (for the high) and red (for the low) lines directly on the chart overlay. Additionally, it computes and plots a midpoint (midPoint) between these high and low levels, displayed as a blue line, offering a visual reference for the median of the opening range.
The calculations are reset daily to ensure the indicator accurately reflects the opening range for each new trading session. By doing so, it avoids carrying over data from previous days, maintaining relevance and precision for day traders and those utilizing short-term trading strategies. The indicator also incorporates timezone adjustments to align with the America/New_York timezone, ensuring that the opening range is accurately captured regardless of the user's local timezone.
This tool is invaluable for traders looking to capitalize on breakout or reversion strategies around the opening range, providing clear visual cues for significant price levels established at the start of the trading session. By focusing on the first 10 minutes of trading, it caters to a specific segment of the market that believes the initial movements can set the tone for the rest of the day's trading activity.
10 EMA StrategyThis indicator shows you:
- The first bullish candle to close below EMA 10
- The first bearish candle to close above EMA 10.
Optional:
You can enable the exit signals in the setting. This will show you:
- If you are long (bullish), it will signal when the first bullish candle closes below EMA 10
- If you are short (bearish), it will signal when the first bearish candle closes above EMA 10
You can also change the EMA 10, to another length, if you want to try something else.

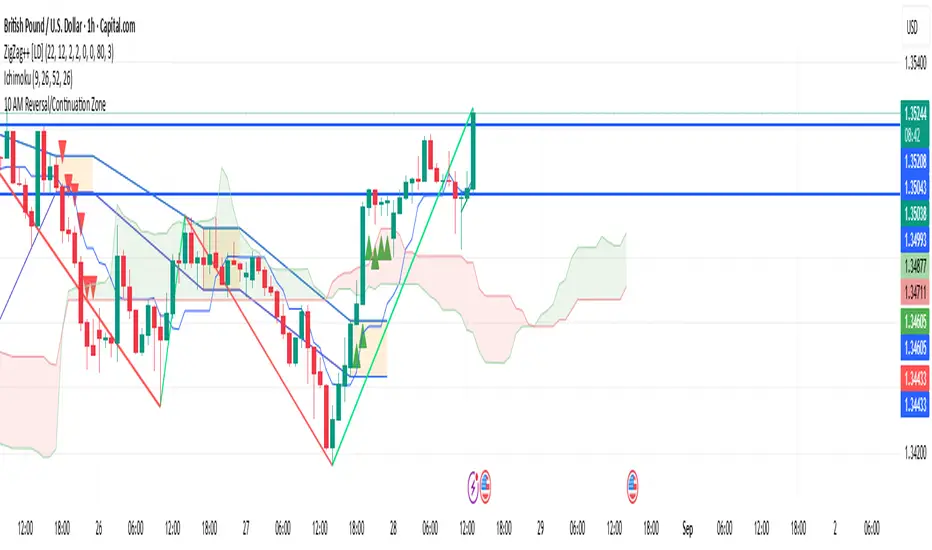
10 AM Reversal/Continuation Zone BY DAN GESPlots the high and low between 9.30 - 10:00am ET
Colours the zone between those two levels.
Highlights when price breaks above or below that zone after 10:00am
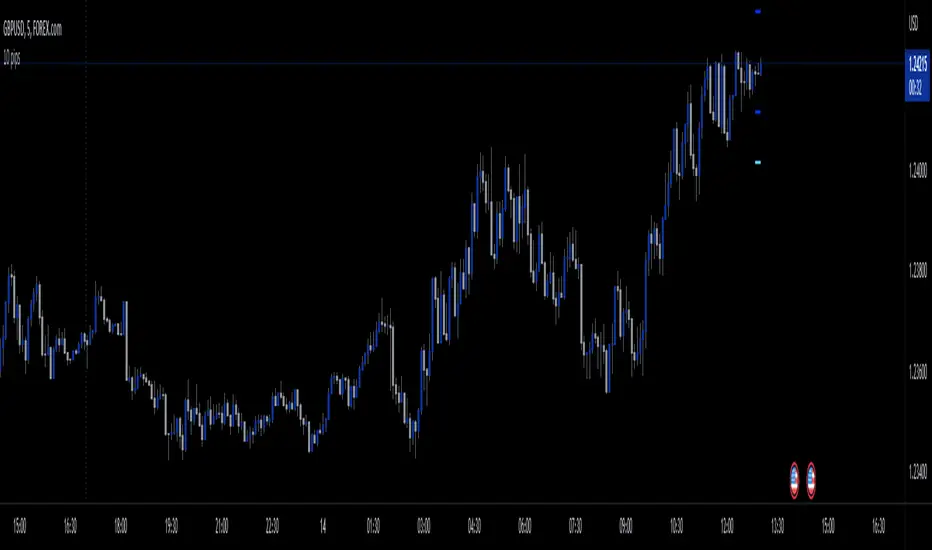
10 pips█ OVERVIEW
If you are a scalper who typically takes positions within a certain range, this indicator can help you quickly and easily determine whether your target is within that range.
It displays a specified number of pips above and below the current price, allowing you to quickly and easily see whether your target falls within the desired area.
This eliminates the need to manually measure and calculate.
10 pips indicator can save you time and improve the accuracy of your trading decisions.
█ FEATURES
This indicator can display up to 4 lines - 2 above and 2 below the current price. The list of inputs is:
How many pips to offset? -- By default is set to 10 pips
Color for range 1 -- By default is set to darker blue
Show second range? -- You can choose to display second set of lines with different range
How many pips to offset? -- By default is set to 20 pips
Color for range 2 -- By default is set to blue
Length of the lines -- By default is set to 2
Width of the lines -- By default is set to 2
═════════════════════════════════════════════════════════════════════════
This script is not intended to provide specific trading signals, but rather to offer ideas and insights that traders can use to inform their own decision-making.
As such, it is important to note that any trades that are made using this script are the sole responsibility of the trader
10/20 MA Cross-Over with Heikin-Ashi Signals by SchobbejakThe 10/20 MA Heikin-Ashi Strategy is the best I know. It's easy, it's elegant, it's effective.
It's particularly effective in markets that trend on the daily. You may lose some money when markets are choppy, but your loss will be more than compensated when you're aboard during the big moves at the beginning of a trend or after retraces. There's that, and you nearly eliminate the risk of losing your profit in the long run.
The results are good throughout most assets, and at their best when an asset is making new all-time highs.
It uses two simple moving averages: the 10 MA (blue), and the 20 MA (red), together with heikin-ashi candles. Now here's the great thing. This script does not change your regular candles into heikin-ashi ones, which would have been annoying; instead, it subtly prints either a blue dot or a red square around your normal candles, indicating a heikin-ashi change from red to green, or from green to red, respectively. This way, you get both regular and heikin ashi "candles" on your chart.
Here's how to use it.
Go LONG in case of ALL of the below:
1) A blue dot appeared under the last daily candle (meaning the heikin-ashi is now "green").
2) The blue MA-line is above the red MA-line.
3) Price has recently breached the blue MA-line upwards, and is now above.
COVER when one or more of the above is no longer the case. This is very important. You want to keep your profit.
Go SHORT in case of ALL of the below:
1) A red square appeared above the last daily candle (meaning the heikin-ashi is now "red").
2) The red MA-line is above the blue MA-line.
3) Price has recently breached the blue MA-line downwards, and is now below.
Again, COVER when one or more of the above is no longer the case. This is what gives you your edge.
It's that easy.
Now, why did I make the signal blue, and not green? Because blue looks much better with red than green does. It's my firm believe one does not become rich using ugly charts.
Good luck trading.
--You may tip me using bitcoin: bc1q9pc95v4kxh6rdxl737jg0j02dcxu23n5z78hq9 . Much appreciated!--

10 Moving Average + devИндикатор рисует до 10 SMA с индивидуальными настройками и линии стандартного отклонения цены от SMA (не болинджер, но похоже), настраиваемые по потребностям (на скрине часть линий выключено) .
The indicator draws up to 10 SMA with individual settings and the standard price deviation from SMA (not bolinger, but it looks like), customizable according to need (in the screenshot of the lines off).

10/20 EMA 50/100/200 SMA — by mijoomoCreated by mijoomo.
This indicator combines EMA 10 & EMA 20 with SMA 50/100/200 in one clean package.
Each moving average is toggleable, fully labeled, and alert-compatible.
Designed for traders who want a simple and effective multi-MA trend tool.

10/20 EMA 50/100/200 SMA — by mijoomoCreated by mijoomo.
This indicator combines EMA 10 & EMA 20 with SMA 50/100/200 in one clean package.
Each moving average is toggleable, fully labeled, and alert-compatible.
Designed for traders who want a simple and effective multi-MA trend tool.

10 Moving Average ExponentialHaving the possibility to add multiple Moving Average Exponential up to 10 with one indicator
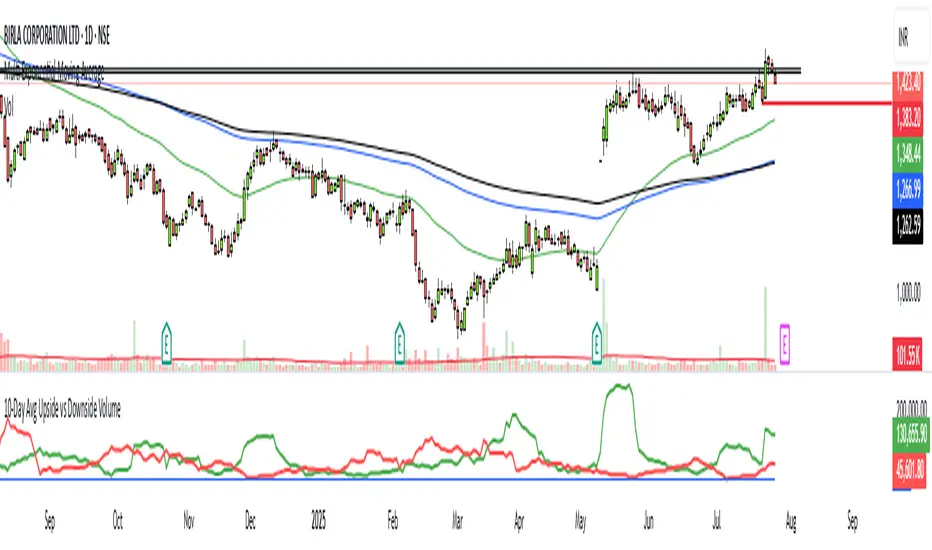
10-Day Avg Upside vs Downside VolumeUpside Volume: The total volume on days when the stock closes higher than the previous day.
Downside Volume: The total volume on days when the stock closes lower than the previous day.
It calculates the 10-day simple moving average of both upside and downside volumes.
An optional ratio line is included to visualize relative buying vs selling pressure.
10/20 MA Coil: Progressive Colors & Multi-Day BreakoutThis indicator detects price “coil” setups and highlights potential breakout or breakdown opportunities using moving average alignment and volatility compression.
Features:
• Coil Detection:
• Identifies consolidation when:
• The 10 and 20 MAs are tightly aligned (within user-defined tolerance)
• Price is above both MAs and within 1.5x ADR of them
• The 50 MA is rising
• Progressive Coil Coloring:
• Coil candles are colored in progressively darker orange as the streak continues
• Bullish Breakout Signal:
• Triggers when a green candle follows a coiled bar
• The candle’s body must be greater than or equal to 1 ATR
• Colored lime green
• Bearish Breakdown Signal:
• Triggers when a red candle follows a coiled bar
• The candle’s body must be greater than or equal to 1 ATR to the downside
• Colored black
• Custom Candle Rendering:
• Candle body color represents coil or breakout state
• Wick and border are red or green to reflect price direction
• Optional Debug Tools:
• Coil streak, ATR, and distance from MAs can be plotted for deeper analysis
This script is designed for traders looking to spot price compression and prepare for high-probability moves following low-volatility setups.

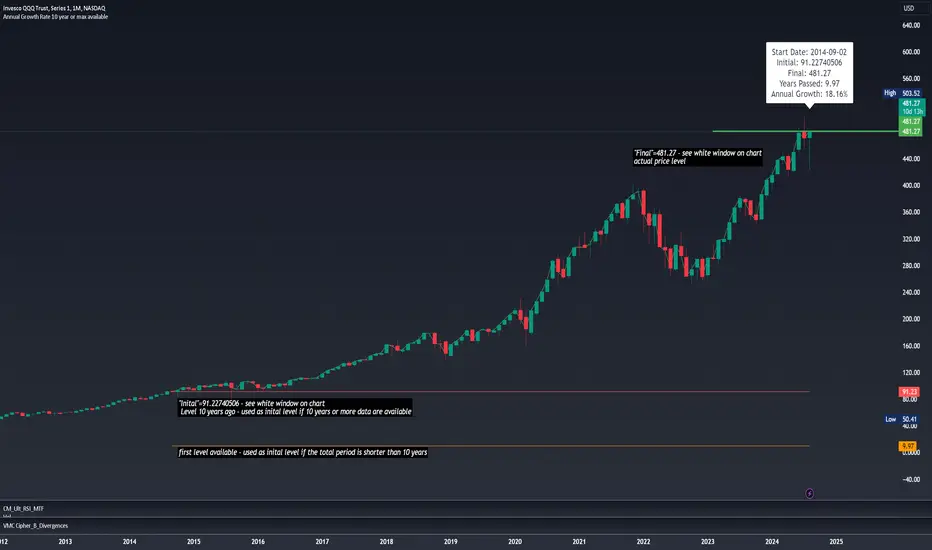
10-Year CAGR Calculator: Uncover Long-Term Growth TrendsThis script calculates the Compound Annual Growth Rate (CAGR) over a 10-year period or the maximum available historical data for any asset. The calculated growth rate is displayed as a label on the last bar of the chart.
Ideal for investors and analysts, this tool helps you easily visualize and assess the long-term growth potential of your investments, providing valuable insights into the historical performance of any asset over an extended period.
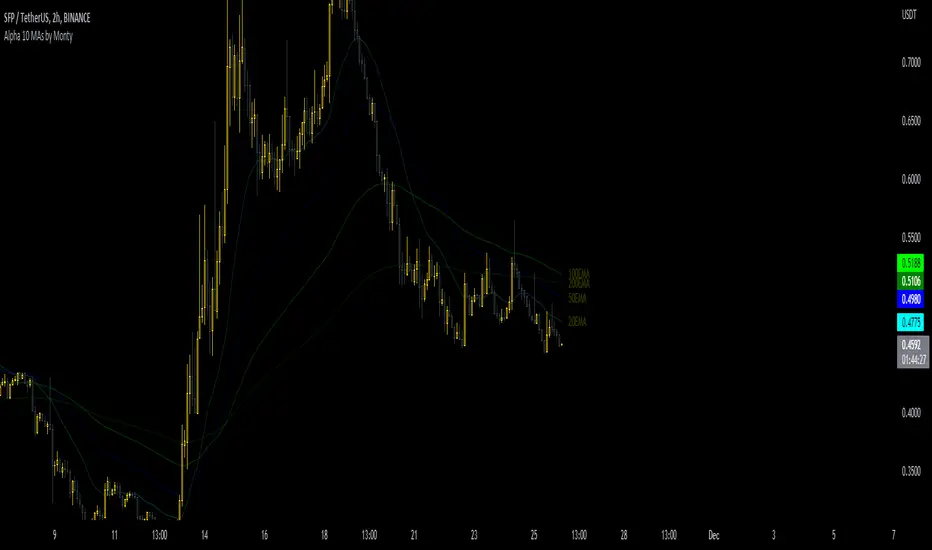
10 MAs Alpha Indicator by MontyThis indicator is a part of the script I coded earlier this month.
The name is to surprise one of our discord member.
I will publish that indicator in a few days as well, but publishing this as a gesture of giving back to the community.
Indicator has:
10 Moving Averages
Adjustable Color, Opacity and Size etc
Shows Labels for each of the MA.
Can be shifted between EMA or SMA
Can be fixed to show a specific TF MA on current Timeframe.