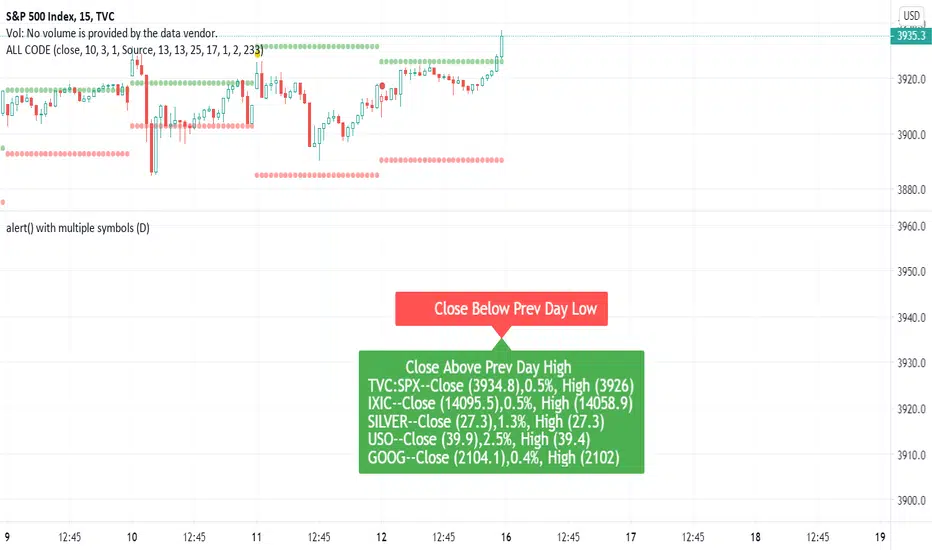
SuperTrend - Custom Screener and Dynamic AlertsTrading View today published a desktop Bad Internet connection indicator ?! which set me thinking…
Despite recently introduced Dynamic Alerts many scripts do not leverage the information available for active traders and traders on the GO!
So decided to share this script totally ALERT focused on one of the most popular DAY trading indicators.
Of course no more BAD internet problem as long your TV APP is configured , you will have enough data for a mental picture of the chart..
The Alerts give you the BAR Close , %percent gain or loss over previous day CLOSE ++ Previous Day High and Low to effectively plan your trade without a chart!(just in case)
2 additions in the way Alerts are delivered over the last script :
1. You get SUMMARY alerts or concatenated alerts by default , however if you uncomment or activate code lines 48 and 55 you will get individual Stock alerts Too!
2. Summary Alerts will come only if there is some Buy or Sell signal NO more empty Alerts!
Few useful EXTRAS in the code :
1. Flexible code can convert any indicator to screener or Alert function.
2. You will NOT get Mutable Variable error while converting any indicator to screener as long as the function is in "GLOBAL" scope..
3. Many Custom Screeners are available but few give OHLC data in output so easily…and very difficult for traders to MODIFY hundreds of lines of code..
4. For UP or DOWN on SCREEN Stock monitoring copy /paste functions in line 41 and 42 in lieu of CROSS functions in 44 and 51 respectively..
5. You can also uncomment/activate lines 66 and 67 for labels in monitoring.
6. The default mode of the scripts is set to Alerts!
Max Stocks only 20!
Finally idea is to help traders to use the great features that TV works so hard to create and constantly improvise.
Enjoy Profitable Trading on the Fly !!
Screener

Custom Multi-Timeframe Screener with AlertsThis is a multi-timeframe screener with alerts. Use this way you can create a screener on indicators using 2 or more timeframes.
In TradingView there is a limit of 40 security function calls. Every timeframe requires another security call so you can screen fewer symbols with any additional timeframe.
In this example, I use 2 timeframes, so the maximum amount of symbols you can scan is 40/2 = 20.
For 3 timeframes - 13, 4tfs - 10, 5tfs - 8 symbols and so on.
In this simplistic example, I require a cross of EMAs on the current timeframe and confirmation that one EMA above/below another from the second timeframe.
Of course, you can create much more complicated functions for this screener.
Params
- higher timeframe
- ema params
- 20 symbol inputs for instruments you want to use in this screener
Alerts
You can create an alert from it easily by selecting the screener name from the list and then selecting "Any alert() function call".
No additional configuration is required, message and alert on close is generated in the code.
You should better change the default name for your alert. Sometimes because of big amount of inputs you might receive an error.
Disclaimer
Please remember that past performance may not be indicative of future results.
Due to various factors, including changing market conditions, the strategy may no longer perform as good as in historical backtesting.
This post and the script don’t provide any financial advice.

VPF ScreenerThis script is inspired by @midtownsk8rguy and created at my request with the pine mastery of @DonovanWall. All the credits go to them.
Basically, this script will screen for the long-only condition of the Voss Predictive Filter in maximum 40 securities at your choice.
I personally find the signals quite reliable for scalping indices and swing trading momentum stocks.
Hope you guys find it useful

Screener: Alpha & BetaThis is a Live Screener for my previous Alpha & Beta indicator, which filters stocks lively based on the given values.
Use 5min timeframe for Live Intraday.
The default stocks in the screener is selected based on high beta value from F&O listed stocks. It may include other stocks also.
User can input stocks of your choice either through the menu or through the Pine editor.
The maximum number of stocks inputs is only 40. The indicator includes only 20 stocks by default.
More number of stocks can be added but it makes the screener slower to load.
Open the indicator in a sperate tab or window to avoided the loading lag.
It is recommended to choose only 10 to 20 stocks based on the weightage from each sectors.
Beta values are dynamic. It changes from day to day based on the trend and sector.
Update the sock list weekly or twice a week or monthly.
Use investing.com screener(preferably) or TradingView screener for shortlisting beta stocks.
Remember that majority of indicators fails in a sideways market, also every indicator is not 100% accurate.
Multiple Screeners with AlertsI already published few version of my custom screeners. Unfortunately, because of TradingView's security function call limit you can't use more than 40 stocks in 1 screener.
Fortunately, you can compute multiple values in your function and screen few indicators at once.
In this script I show how you can compute 5 indicators at the same time for 40 instruments. I display then in different labels.
Every label consist of list of instruments satisfying current indicator conditions and a value for it. It can be absolute value as for RSI or -1/1 representing Bullish/Bearish event.
Also you can create 1 alert with result of all screeners inside.
In this example I took 5 indicators with following conditions:
RSI - "RSI < 30" or "RSI > 70"
TSI - "TSI < -30" or "RSI >30"
ADX - "ADX > 40"
MACD - "MACD Bullish Cross" or "MACD Bearish Cross" (1 and -1 in screener)
AO - "AO Crosses 0 UP" or "AO Crosses 0 DOWN" (1 and -1 in screener)
Params
- bars_apart - this parameter define how may bars apart you labels are on your chart. If you see labels overlapping, increase this number.
- Parameters for all used indicators
- 40 symbol inputs for instruments you want to use in this screener
Alerts
You can create an alert from it easily by selecting screener name from the list and then selecting "Any alert() function call".
No additional configuration is required, message and alert on close is generated in the code.
You should better change default name for your alert. Sometimes because of big amount of inputs you might receive an error.
Disclaimer
Please remember that past performance may not be indicative of future results.
Due to various factors, including changing market conditions, the strategy may no longer perform as good as in historical backtesting.
This post and the script don’t provide any financial advice.

Ultimate Screener TemplateHello Traders
With the Ultimate Strategy Template , I shared a template to connect any indicator to this template and get backtesting results in less than a few minutes
Now sharing another template ... many traders ask me to develop for them a screener/scanner based on a custom indicator on TradingView.
The current TradingView screeners are great but don't allow for much customization; as we can only select pre-defined filters
I don't know when we'll be able to natively screen among hundreds of assets with a custom indicator... then.... I created this template for the time being.... which should
A whole new world
The Ultimate Screener Template screens over 38 securities.
What's very cool is that you'll only need to create 1 alert to scan over 38 securities: Explanation with this image here
I totally understand that not all TradingView accounts have a lot of alarms; with this template, you can multiply the number of custom alerts you're initially allowed to.
What if I need to set alerts on more than 38 securities?
Pretty straightforward... you can create alerts only if the indicator is added to your chart first.
So if you need let's say 100 securities, add this indicator 3 times on your chart (38*3 > 100) and then... edit the securities for your 3 indicators
How to update your Screener settings
Alert mode
As per Pinescript reference , this template allows setting the alert frequency
Possible values are:
- alert.freq_all (all function calls trigger the alert)
- alert.freq_once_per_bar (the first function call during the bar triggers the alert)
- alert.freq_once_per_bar_close (the function call triggers the alert only when it occurs during the last script iteration of the real-time bar when it closes).
All-time-high and All-time-low
This template shows how to capture ATH and ATL alerts across many securities
I used the functions from Quantnomad:
Whenever a new ATH or ATL is made, the screener will send a personalized alarm with a personalized text based on the security triggering this alarm
The code is pretty straightforward and shows you the part you'll need to update to transform your favorite custom indicator into a powerful screener.
If anything is unclear in the code, please leave a comment and I'll respond as soon as possible
All the best
Dave
Custom Screener with Alerts V2 [QuantNomad]TradingView just recently announced the alert() function that allows you to create dynamic alerts from both strategies and studies.
So I decided to update custom screener I published before. It was based on alerts from orders in strategies, that was the only way to create dynamic alerts in PineScript at that point.
With the alert() function code become cleaner and more readable.
It works for up to 40 symbols at the same time.
You can create an alert from it easily by selecting screener name from the list and then selecting "Any alert() function call".
No additional configuration is required, message and alert on close I set up in the code.
I created as an example a screener that tracks both overbought (RSI > 70) and oversold stocks (RSI < 30).
To create your own screener you have to change only screenerFunc().
By design it should output 2 values:
cond - True/False Boolean variable. Should this instrument be displayed in the screener?
value - Additional numeric value you can display in your screener. I display RSI level for selected stocks for example.
Link to the old screener:
Disclaimer
Please remember that past performance may not be indicative of future results.
Due to various factors, including changing market conditions, the strategy may no longer perform as good as in historical backtesting.
This post and the script don’t provide any financial advice.
Dynamic Messages & Easy Screener1. Dynamic Message alerts with a Screener function
2. labels are generated using array strings making it easier to customize
3. Alert messages have well defined output with data variables
4. Traders with limited Pine knowledge can also plugin their functions
5. Closely track the alerts with Easy Screener
6. Attach it to the desired chart for alert periodicity and set resolution to the indicator setup
7. OHLC values for scanned securities also extracted for ready use in any indicator or study
Happy Trading and rest your sore eyes with Easy Screener!!
Enjoy TV on the GO!
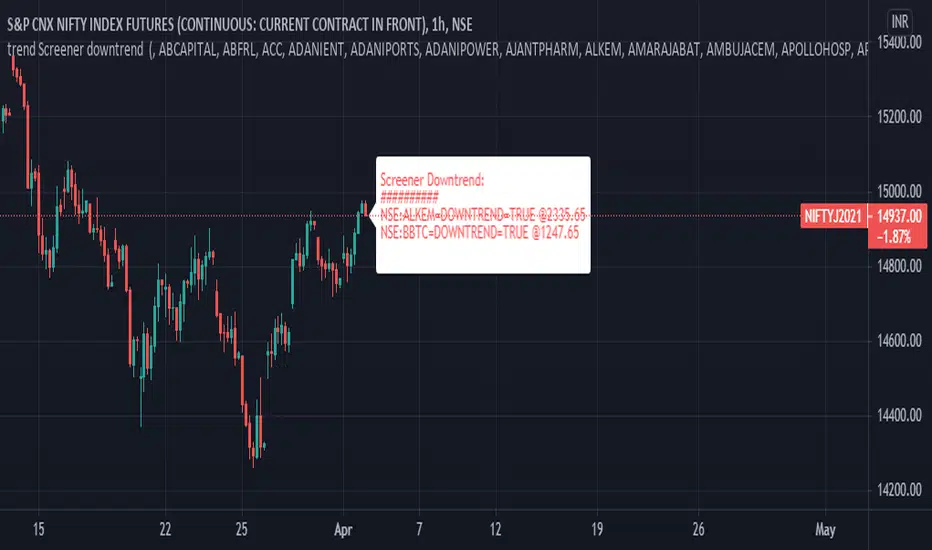
trend Screener downtrendthis is in continuation with - previous trend screener i have published, In this code only downtrend screener is there ,This is type of custom screener I searched and made to screen bulk stocks any one can modify it, other may get help out of it.
you can change or add new symbol in input section.
in my code i have made defined and printed last close price when downtrend was true.
1. downtrend = ema (close,55)< ema (close,144) and ema (close,144)< ema (close,388) and ema (close,388)<ema(close,576) and close<ema(close,388)
if the indicator is printing DOWNTREND=TRUE or UPTREND=TRUE then the corresponding stock is in currently in that trend out of the stocks listed in the code
in one code only 40 (max) stocks can be called.
to add more stocks I copied same code and changed the stocks in the code, now you can screen 80 stocks at a time.
This code runs on each bar and checks if the stocks is in uptrend or down trend.
you can customize this screener according to your requirement.
Indices Sector SigmaSpikes█ OVERVIEW
“The benchmark Dow Jones Industrial Average is off nearly 300 points as of midday today...”
“So what? Is that a lot or a little? Should we care?”
-Adam H Grimes-
This screener aims to provide Bird-Eye view across sector indices, to find which sector is having significant or 'out-of-norm' move in either direction.
The significance of the move is measured based on Sigma Spikes, a method proposed by Adam H. Grimes, where Standard Deviation of returns used as a baseline.
*You can google his blog or read his book, got some gold in there, especially on how he use indicators for trading
█ Understanding Sigma Spikes
As described by Grimes, moves in markets are only meaningful when we consider what “normal” is for that market.
Without that baseline, the daily change number, and even the percent change on the day doesn’t really mean much.
To overcome that problem, Sigma Spikes, as a measure of volatility, attempt to put todays change in price (aka return) in context of the standard deviation of 20 days daily's return.
Refer chart below:
1. The blue bars refer to each days return
2. The orange line is 1 time standard deviation of past 20days daily's return (today not included)
3. The red line is 2 time standard deviation of past 20days daily's return (today not included)
Using the ratio of today's return over the Std Deviation, determining your threshold (1,2,3,etc) will be the key that tells if today's move is significant or not.
*Threshold referring to times standard deviation, and different market may require different threshold.
*20 Days period are based on the Lookback Period, adjustable from user input window.
█ Features
- Scan up to 13 symbols at a time (Bursa (MYX) indices are defaulted, but you may change to any symbols/index from the user input setting)
█ Limitation
- Due to multiple use of security() function required to call other symbols, expect the screener to be slow at certain times
- Custom Timeframe currently accept only Daily and Weekly. I'll try to include lower timeframe in the next update
█ Disclaimer
Past performance is not an indicator of future results.
My opinions and research are my own and do not constitute financial advice in any way whatsoever.
Nothing published by me constitutes an investment recommendation, nor should any data or Content published by me be relied upon for any investment/trading activities.
I strongly recommends that you perform your own independent research and/or speak with a qualified investment professional before making any financial decisions.
Any ideas to further improve this indicator are welcome :)

Screener - Mean Reversion Channel█ OVERVIEW
This is Screener script for Mean Reversion Channel Indicator
█ Description & How To Use
The screener works by scanning through up to 40 symbols and list down symbols that are currently within Overbought/Oversold Zone as defined by Mean Reversion Channel indicator.
The Overbought/Oversold Zone are further categorized and sorted by:
Strong : Indicated by "(Strong)" next to the symbol name
Normal : Indicated by the absence of "(Strong)" or "(Weak)" next to the symbol name
Weak : Indicated by "(Weak)" next to the symbol name
Notes: Refer to chart above to see how the Zone are categorized.
Notes: If the screener displays "Nothing Interesting". It simply means none of the screened assets are within the Overbought/Oversold Zone.
█ Features
- Scan up to 40 symbols at a time (By default, no asset is define. Once configured all the symbols you required, remember to save as default to save you from pain of configuring it again in the future)
- Options to scan by zones
- Custom Timeframe
█ Limitation
Due to multiple use of security() function required to call other symbols, expect the screener to be slow at certain times
█ Disclaimer
Past performance is not an indicator of future results.
My opinions and research are my own and do not constitute financial advice in any way whatsoever.
Nothing published by me constitutes an investment recommendation, nor should any data or Content published by me be relied upon for any investment/trading activities.
I strongly recommends that you perform your own independent research and/or speak with a qualified investment professional before making any financial decisions.
Any ideas to further improve this indicator are welcome :)
Credit: QuantNomad for his script idea on custom screener

[Zekis]ScreenerA simple screener that scan thru multiple pairs for a setup.
The screener have as example an EMA 50 cross, so you have to change it with your indicator/strategy.
You can use a maximum of 40 security() function, right now there are 20, so you can have a total of 40 pairs.

SuperTrendRange by DGTSuperTrendRange study attempts to determine the state of the market
• whether a well-established bull/bear trend is present
• whether the market is trading in a range
SuperTrendRange (STR) takes into account the volatility of the market - further details regarding volatility can be found in the description of “Volatility Bands by DGT” study
Due to its similarities to SupertTrend (ST) and Parabolic SAR (SAR), I will try to explain by stating differences between them
SuperTrendRange uses both the ATR (Average True Range) and STDEV (Standard Deviation) as part of its calculations - unlike ST and SAR where they use only ATR
Sensitivity of the indicator is adjusted using the multiplier setting of both ATR and STDEV
Additionally, unlike ST, the source of the basis of SuperTrendRange can be selected among the assets price value or its moving average
Source and Length are adjustable too
The SuperTrendRange, like Parabolic SAR indicator, appears on a chart as a series of dots, either above, below or unlike Parabolic SAR both above and below of the asset's price
A dot placed
- below the price when the market is trending upward
- above the price when it is trending downward
- both above and below when the price starts moving sideways – this is a feature that both SuperTrend and Parabolic SAR misses, where they are known to produce false signals and losing trades, whereas SuperTrendRange emphasis the zones of the ranges occurring and in most cases are considered no trade recommended zones. Please note that the range width may vary depending on how the market is volatile. It is up to the users to trade if it fits their trading strategies
Dots plotted above and below can be assumed as Support and Resistance levels
Example usages – with trading opportunities
Gold Monthly Chart
Bitcoin Daily Chart
Disclaimer:
Trading success is all about following your trading strategy and the indicators should fit within your trading strategy, and not to be traded upon solely
The script is for informational and educational purposes only. Use of the script does not constitute professional and/or financial advice. You alone have the sole responsibility of evaluating the script output and risks associated with the use of the script. In exchange for using the script, you agree not to hold dgtrd TradingView user liable for any possible claim for damages arising from any decision you make based on use of the script

Supertrend Screener PanelScript to display Supertrend trend state of 8 different securities in a panel. Timeframe & Tickers which are to be displayed can be configured from settings.
Part of code is from the ADX DI Monitoring Panel script by u/wugamlo with his permission. Thanks to him for that and do please check out his work also.

[SCREENER] TAD SYSTEM (Shariah MYX)TAD SYSTEM
TAD stands for TURTLE, ATOM and DUCK
With the three BUY arrows aligned accordingly with the TURTLE, ATOM and DUCK indicators, this triggers BUY signal
With the three SELL arrows aligned accordingly with the TURTLE, ATOM and DUCK indicators, this triggers SELL signal
F1 TURTLE
F1 ATOM
F1 DUCK

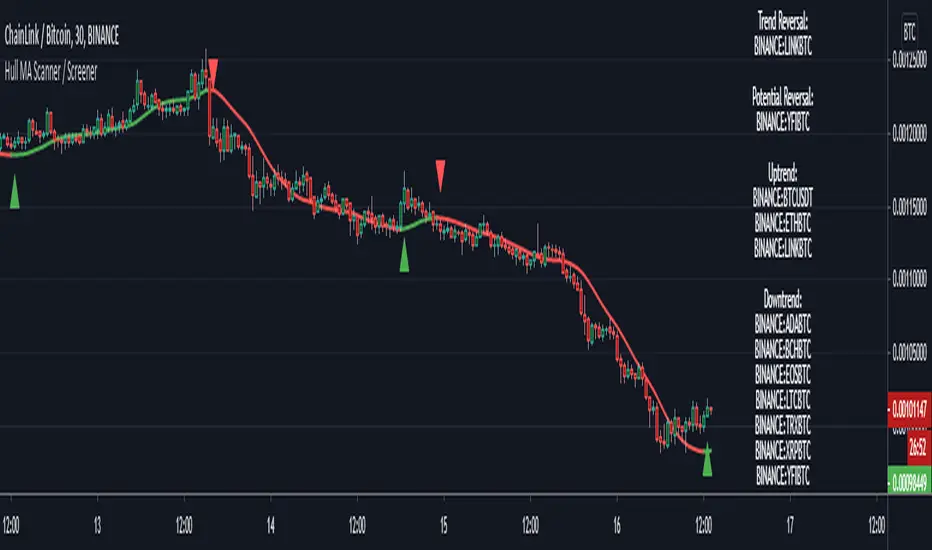
Hull MA Scanner / Screener LabelThis screens for Hull MA trend reversal's in 10 different securities. If the label color is not visible due to the text in it being white colored, then choose a different color from settings. Also added a simple HullMA to it. If want can increase it upto 40 securities in the code which is upto user to decide.
This was requested by soderstromkenan in comments and looked like a nice idea so decided to make it.
The Hull MA logic is from "Hull50" by u/RafaelZioni with his permission. Screener logic from u/Quantnomad with his permission.
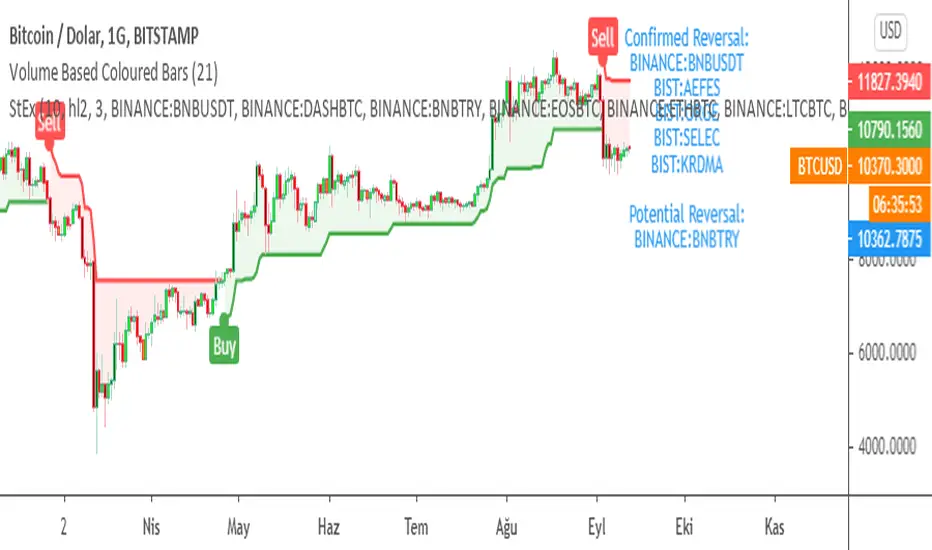
SuperTrend EXPLORER / SCREENERSUPERTREND EXPLORER / SCREENER screens the BUY and SELL signals (trend reversals) for 38 user defined different tickers in Tradingview charts.
Simply input the short name of the ticker in Tradingview that you want to screen.
Script is derived from zzzcrypto123 's work. Thanks for the permission letting me to use his logic.
Terminology explanation:
Confirmed Reversal: Supertrend reversal that happened in the last bar and cannot be repainted.
Potential Reversal: Supertrend reversal that might happen in the current bar but can also not happen depending upon the timeframe closing price.
Screener has also got a built in SuperTrend indicator which users can confirm the reversals on graphs.
Screener explores the 38 tickers in current graph's time frame and also in desired parameters of the SuperTrend indicator.
SUPERTREND INDICATOR:
STRATEGY version of SuperTrend Indicator:
SuperTrend is one of the most common ATR based trailing stop indicators.
In this version you can change the ATR calculation method from the settings. Default method is RMA, when the alternative method is SMA .
The indicator is easy to use and gives an accurate reading about an ongoing trend. It is constructed with two parameters, namely period and multiplier. The default values used while constructing a superindicator are 10 for average true range or trading period and three for its multiplier.
The average true range (ATR) plays an important role in 'Supertrend' as the indicator uses ATR to calculate its value. The ATR indicator signals the degree of price volatility .
The buy and sell signals are generated when the indicator starts plotting either on top of the closing price or below the closing price. A buy signal is generated when the ‘Supertrend’ closes above the price and a sell signal is generated when it closes below the closing price.
It also suggests that the trend is shifting from descending mode to ascending mode. Contrary to this, when a ‘Supertrend’ closes above the price, it generates a sell signal as the colour of the indicator changes into red.
A ‘Supertrend’ indicator can be used on equities, futures or forex, or even crypto markets and also on daily, weekly and hourly charts as well, but generally, it fails in a sideways-moving market.
Source function added to use the indicator as the ATR Trailing Stop indicator.
Just change source type hl2 to close.
different variations might be useful.
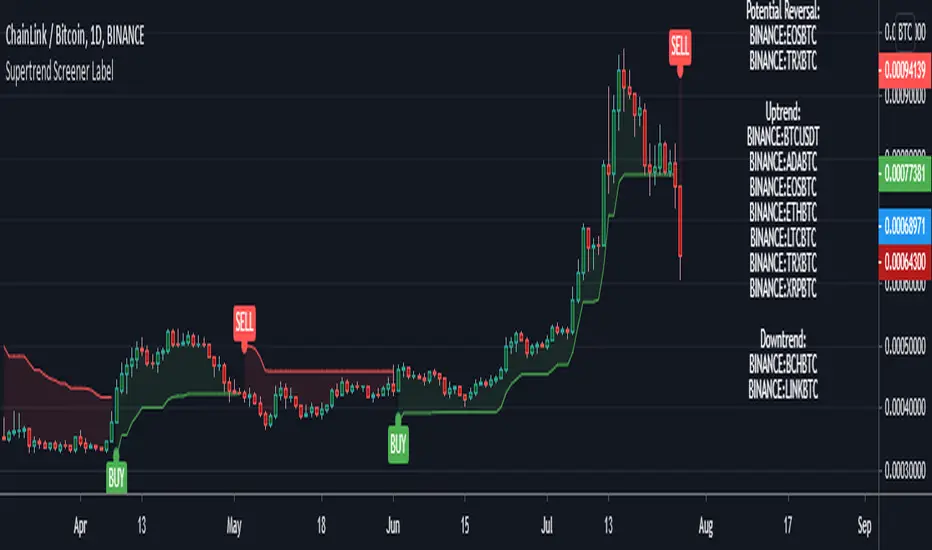
Supertrend Screener LABELThis screens for Supertrend reversal's in 10 different securities. The main logic for the screener is taken from "Simple Custom Screener in Pinescript" by QuantNomad with his permission. If the label color is not visible due to the text in it being white colored, then choose a different color from settings. Also added a simple supertrend to it.
Terminology explanation:
Confirmed Reversal: Supertrend reversal that happened in the last bar and cannot be repainted.
Potential Reversal: Supertrend reversal that might happen in the current bar but can also not happen depending upon the timeframe closing price.
Uptrend/Downtrend : Shows all the tickers that are either currently in uptrend or downtrend.
MTF Stoch RSI ScreenerDisplays when multiple timeframes of Stochastic RSI are overbought/oversold. Multiple consecutive timeframes being overbought/oversold can signify a short term top or bottom.
Thanks to Micse in Pinescripters telegram who helped remove a few errors from this.

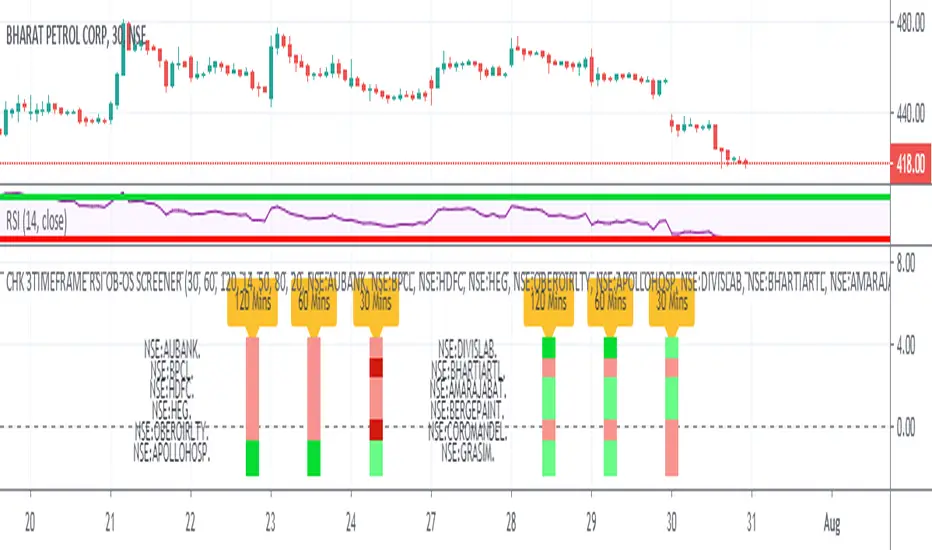
CHK 3TIMEFRAME RSI OB-OS SCREENER Sharing RSI Screener. It shows RSI Situation for 12 Stocks.
User can replace the stocks as per their respective exchange
User can select 3 Time Frames of his/her choice
User can change the OverBought / OverSold Values to 70/30. This indicator uses 80/20.
RSI BELOW 50 = PINK COLOR
OVERSOLD = MAROON COLOR
RSI ABOVE 50 = LIGHT GREEN COLOR
OVERBOUGHT = DARK GREEN COLOR
For Example : This Chart and the Indicator snapshot shows, the stock BPCL is Oversold for the 30 Min TimeFrame
For Example : The indicator snapshot shows, the stocks HDFC and AUBANK have their RSI's below 50 across the 30 Min / 60 Min / 120 Min
TimeFrames
Please give it some time to load, and every time you change Resolution.
Add another one, to have a screener screening 24 stocks :)
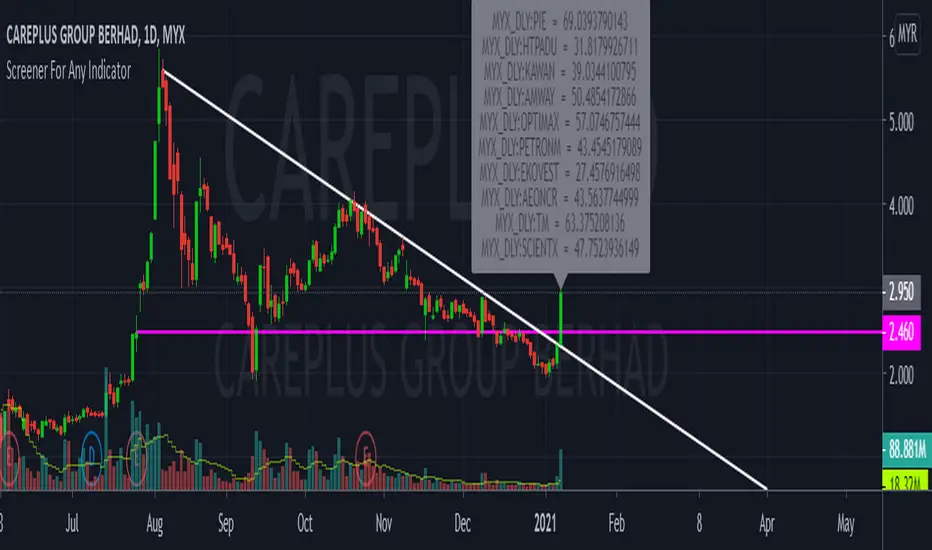
CustomScreenerTo apply your indicator with screener , please modify the section which i mention "Start your indicator pine script" & "End your indicator pine script"
At the pinescript section you will able to change the ticket symbol .
I only able to show screener result with 10 item in 1 times . To view more result, please go to setting and change stock list "1-10">"11,20">"21-30".....
Able to screener 100 items with this indicator.
Kindly change the exchange and stock in the pinescript according your watchlist.
As examples, my indicator is to determine the stock in which trend, i want to find out all stock with aqua color trend
The screener result show only 9 of 10 are in aqua color trend.
Custom Screener with Alerts [QuantNomad]Some time ago I published an example of simple custom screener in PineScript:
The only thing this screener did is created a dynamic label with screener output.
Recently TradingView announced alerts from the strategy with the possibility to add custom messages to alerts.
So using it I was able to create a bit more advanced screener which sends results as alert messages. With tools like Alertatron, you can easily redirect them to Telegram if you want.
It works for 40 symbols (limitation of the number of security calls).
To create your own screener you need to change only screenerFunc. The logic of this function is very simple, it outputs value you want to display in screener and condition based on which your screener should filter your stocks.
To create alerts for this screener create an alert from strategy and use {{strategy.order.alert_message}} as alert message.
Do you know now how to make this screener better? Let me know.
Disclaimer
Please remember that past performance may not be indicative of future results.
Due to various factors, including changing market conditions, the strategy may no longer perform as good as in historical backtesting.
This post and the script don’t provide any financial advice.

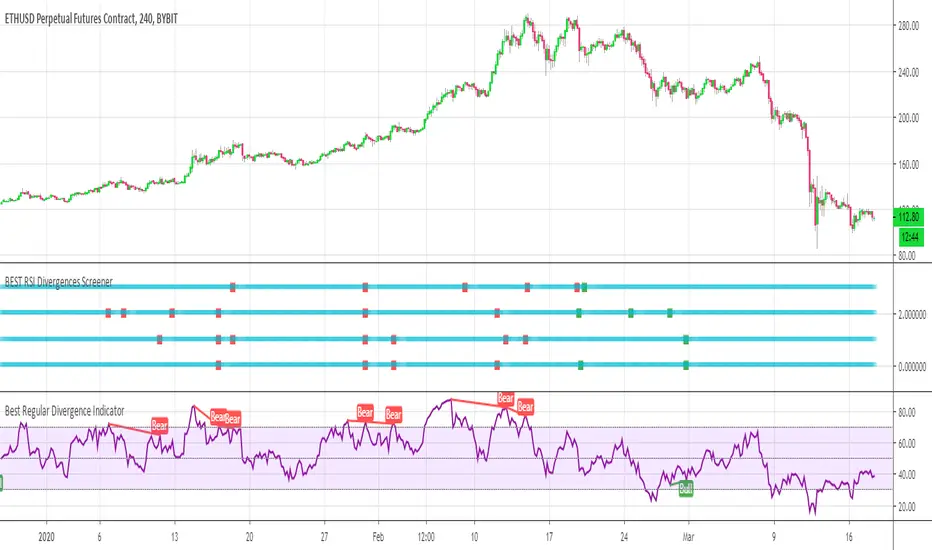
BEST RSI Divergences ScreenerHello traders
I hope you're all hanging on at home with what's going on these days...
The good news is.... it gives us more time to trade ^^.... #positive #attitude
I - Concept
This screener detects whether the regular RSI divergences based on the TradingView Divergence built-in indicator (made by the gentleman @everget I believe)
With this screener, you can see in 1 view which of your favorite cryptos/stocks/forex pairs/etc. showing strong divergences
The gentlemen (and demoiselles) traders can play with the lookback/ranges inputs to adjust the divergences based on what they think is best of their trading/timeframe/instrument/life
On that script screenshot, I'm showing the BYBIT:BTCUSD part of the screener matching with the divergences on the chart
II - How did I set the screener
The visual signals are as follow:
- square: whenever a divergence is detected
Then the colors are:
- green when there is bullish regular divergence
- red when there is bearish regular divergence
Best regards
Dave