Time-Price Velocity [QuantAlgo]🟢 Overview
The Time-Price Velocity indicator uses advanced velocity-based analysis to measure the rate of price change normalized against typical market movement, creating a dynamic momentum oscillator that identifies market acceleration patterns and momentum shifts. Unlike traditional momentum indicators that focus solely on price change magnitude, this indicator incorporates time-weighted displacement calculations and ATR normalization to create a sophisticated velocity measurement system that adapts to varying market volatility conditions.
This indicator displays a velocity signal line that oscillates around zero, with positive values indicating upward price velocity and negative values indicating downward price velocity. The signal incorporates acceleration background columns and statistical normalization to help traders identify momentum shifts and potential reversal or continuation opportunities across different timeframes and asset classes.
🟢 How It Works
The indicator's key insight lies in its time-price velocity calculation system, where velocity is measured using the fundamental physics formula:
velocity = priceChange / timeWeight
The system normalizes this raw velocity against typical price movement using Average True Range (ATR) to create market-adjusted readings:
normalizedVelocity = typicalMove > 0 ? velocity / typicalMove : 0
where "typicalMove = ta.atr(lookback)" provides the baseline for normal price movement over the specified lookback period.
The Time-Price Velocity indicator calculation combines multiple sophisticated components. First, it calculates acceleration as the change in velocity over time:
acceleration = normalizedVelocity - normalizedVelocity
Then, the signal generation applies EMA smoothing to reduce noise while preserving responsiveness:
signal = ta.ema(normalizedVelocity, smooth)
This creates a velocity-based momentum indicator that combines price displacement analysis with statistical normalization, providing traders with both directional signals and acceleration insights for enhanced market timing.
🟢 How to Use
1. Signal Interpretation and Threshold Zones
Positive Values (Above Zero): Time-price velocity indicating bullish momentum with upward price displacement relative to normalized baseline
Negative Values (Below Zero): Time-price velocity indicating bearish momentum with downward price displacement relative to normalized baseline
Zero Line Crosses: Velocity transitions between bullish and bearish regimes, indicating potential trend changes or momentum shifts
Upper Threshold Zone: Area above positive threshold (default 1.0) indicating strong bullish velocity and potential reversal point
Lower Threshold Zone: Area below negative threshold (default -1.0) indicating strong bearish velocity and potential reversal point
2. Acceleration Analysis and Visual Features
Acceleration Columns: Background histogram showing velocity acceleration (the rate of change of velocity), with green columns indicating accelerating velocity and red columns indicating decelerating velocity. The interpretation depends on trend context: red columns in downtrends indicate strengthening bearish momentum, while red columns in uptrends indicate weakening bullish momentum
Acceleration Column Height: The height of each column represents the magnitude of acceleration, with taller columns indicating stronger acceleration or deceleration forces
Bar Coloring: Optional price bar coloring matches velocity direction for immediate visual trend confirmation
Info Table: Real-time display of current velocity and acceleration values with trend arrows and change indicators
3. Additional Features:
Confirmed vs Live Data: Toggle between confirmed (closed) bar analysis for stable signals or current bar inclusion for real-time updates
Multi-timeframe Adaptability: Velocity normalization ensures consistent readings across different chart timeframes and asset volatilities
Alert System: Built-in alerts for threshold crossovers and direction changes
🟢 Examples with Preconfigured Settings
Default : Balanced configuration suitable for most timeframes and general trading applications, providing optimal balance between sensitivity and noise filtering for medium-term analysis.
Scalping : High sensitivity setup with shorter lookback period and reduced smoothing for ultra-short-term trades on 1-15 minute charts, optimized for capturing rapid momentum shifts and frequent trading opportunities.
Swing Trading : Extended lookback period with enhanced smoothing and higher threshold for multi-day positions, designed to filter market noise while capturing significant momentum moves on 1-4 hour and daily timeframes.
Scalping

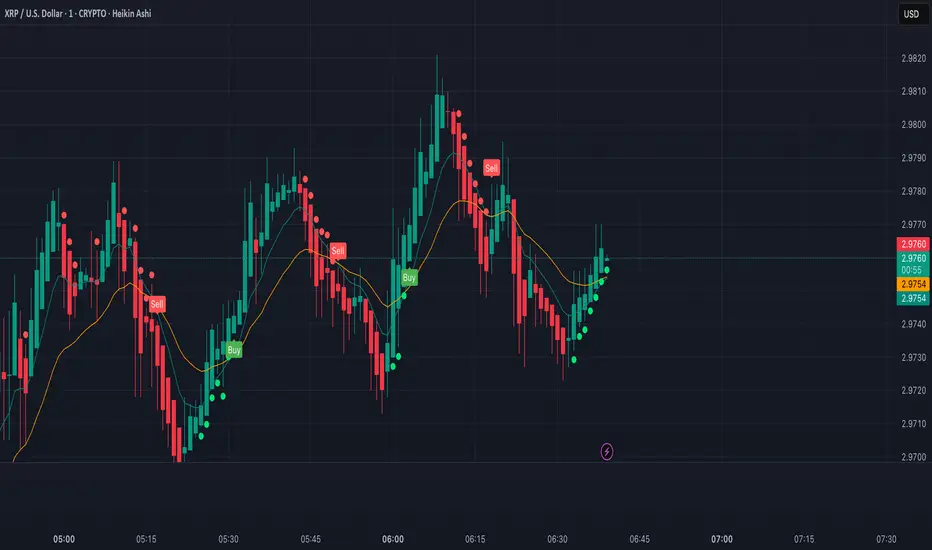
XRP Scalping with EMA Crossover Anticipation This script is designed to detect scalping opportunities on XRP by anticipating EMA crossovers, reinforced with technical confirmation filters.
Methodology
- The core signal is based on the crossover between a fast EMA (9) and a slow EMA (21).
- RSI (14) conditions are applied to avoid weak setups: RSI must be above 40 for buy signals and below 70 for sell signals.
- Before any crossover is validated, the script requires at least two consecutive “pre-crossover” signals. These indicate favorable momentum and convergence conditions before the crossover occurs.
- Final signals are only displayed if this minimum number of preconditions is met.
Application
This system is optimized for scalping on the 1-minute to 5-minute timeframes but can be adapted for longer-term setups by adjusting parameters. The anticipation logic helps reduce lagging entries and improves signal selectivity during volatile conditions.
Both pre-crossover and confirmed crossover conditions include alert options. The code is fully editable and customizable.
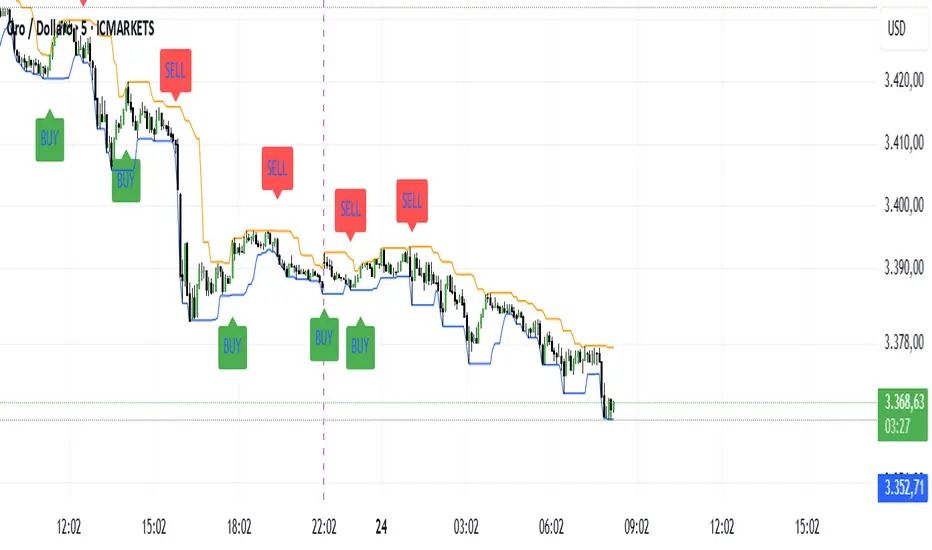
Quality Buy/Sell Indicator with Scalping Mode + SL OnlyQuality Buy/Sell Indicator with Scalping Mode + SL Only is designed for traders who want clean and reliable signals for both swing and scalping strategies.
✅ Features:
Buy & Sell signals based on EMA and MACD logic
Scalping Mode (switch ON for faster, more frequent signals)
SL (Stop Loss) line displayed for every trade for easy risk management
Clean chart – no TP1, TP2, TP3 clutter
Option to show only the latest signal or the entire signal history
✅ How it works:
In normal mode you get fewer, more reliable signals – perfect for intraday or swing trading.
In scalping mode the indicator generates more signals for short-term trades (1–15m charts).
The Show All Signals switch allows you to keep the entire history visible, or only the latest trade setup for maximum clarity.
✅ Best suited for:
Traders who want clean charts without TP lines
Intraday and scalping traders looking for multiple setups per session
Swing traders who prefer clear Buy/Sell with risk control

R Manager PRO++ – Multi-Setup Risk/Reward ToolDescription
The R Manager PRO++ V1.3d is an advanced risk/reward management tool designed for traders who want to visually plan, track, and manage multiple trade setups directly on their charts.
This script allows you to plot up to three independent setups (A, B, and C) simultaneously. For each setup, you can manually input your Entry and Stop Loss levels, and the tool will automatically calculate and display R-multiple levels (1R to 5R), providing a clear overview of your potential profit targets.
Key Features
Multi-Setup Management (A, B, C)
Track up to three separate trades at the same time, each with individual colors and controls.
Manual Entry & Stop Loss Input
Enter your trade levels manually for flexible usage across any market or strategy.
Automatic R-Multiple Calculation (1R to 5R)
The indicator automatically draws lines and labels for 1R to 5R targets based on your risk distance.
Live R Display
Real-time calculation of your current R multiple, updating with every price move.
Custom Symbol Selection
Link each setup to a specific symbol (e.g., EURUSD, XAUUSD, NAS100) to manage multiple markets without clutter.
Reset Function
One-click reset button to quickly clear individual setups.
Alerts for Reached R-Levels
Receive alerts when price reaches each R level (1R to 5R) to monitor trades without constant chart-watching.
How to Use
- Select Entry and Stop Loss levels manually in the input panel.
- Choose the symbol for each setup (supports Forex, Indices, Gold).
- Enable or disable setups individually with the Activate checkbox.
- Optional: Use the Reset button to clear a setup quickly.
- Monitor R-multiples visually and via alerts as price evolves.
Suitable For
- Swing traders
- Day traders
- Risk-based trading strategies (R-multiples)
- Multi-market portfolio management
Price Exhaustion Envelope [BackQuant]Price Exhaustion Envelope
Visual preview of the bands:
What it is
The Price Exhaustion Envelope (PEE) is a multi‑factor overextension detector wrapped inside a dynamic envelope framework. It measures how “tired” a move is by blending price stretch, volume surges, momentum and acceleration, plus optional RSI divergence. The result is a composite exhaustion score that drives both on‑chart signals and the adaptive width of three optional envelope bands around a smoothed baseline. When the score spikes above or below your chosen threshold, the script can flag exhaustion, paint candles, tint the background and fire alerts.
How it works under the hood
Exhaustion score
Price component: distance of close from its mean in standard deviation units.
Volume component: normalized volume pressure that highlights unusual participation.
Momentum component: rate of change and acceleration of price, scaled by their own volatility.
RSI divergence (optional): bullish and bearish divergences gently push the score lower or higher.
Mode control: choose Price, Volume, Momentum or Composite. Composite averages the main pieces for a balanced view.
Energy scale (0 to 100)
The composite score is pushed through a logistic transform to create an “energy” value. High energy (above 70 to 80) signals a move that may be running hot, while very low energy (below 20 to 30) points to exhaustion on the downside.
Envelope engine
Baseline: EMA of price over the main lookback length.
Width: base width is standard deviation times a multiplier.
Type selector:
• Static keeps the width fixed.
• Dynamic expands width in proportion to the absolute exhaustion score.
• Adaptive links width to the energy reading so bands breathe with market “heat.”
Smoothing: a short EMA on the width reduces jitter and keeps bands pleasant to trade around.
Band architecture
You can toggle up to three symmetric bands on each side of the baseline. They default to 1.0, 1.6 and 2.2 multiples of the smoothed width. Soft transparent fills create a layered thermograph of extension. The outermost band often maps to true blow‑off extremes.
On‑chart elements
Baseline line that flips color in real time depending on where price sits.
Up to three upper and lower bands with progressive opacity.
Triangle markers at fresh exhaustion triggers.
Tiny warning glyphs at extreme upper or lower breaches.
Optional bar coloring to visually tag exhausted candles.
Background halo when energy > 80 or < 20 for instant context.
A compact info table showing State, Score, Energy, Momentum score and where price sits inside the envelope (percent).
How to use it in trading
Mean reversion plays
When price pierces the outer band and an exhaustion marker prints, look for reversal candles or lower‑timeframe confirmation to fade the move back toward the baseline.
For conservative entries, wait for the composite score to roll back under the threshold or for energy to drop from extreme to neutral.
Set stops just beyond the extreme levels (use extreme_upper and extreme_lower as natural invalidation points). Targets can be the baseline or the opposite inner band.
Trend continuation with smart pullbacks
In strong trends, the first tag of Band 1 or Band 2 against the dominant direction often offers low‑risk continuation entries. Use energy readings: if energy is low on a pullback during an uptrend, a bounce is more likely.
Combine with RSI divergence: hidden bullish divergence near a lower band in an uptrend can be a powerful confirmation.
Breakout filtering
A breakout that occurs while the composite score is still moderate (not exhausted) has a higher chance of follow‑through. Skip signals when energy is already above 80 and price is punching the outer band, as the move may be late.
Watch env_position (Envelope %) in the table. Breakouts near 40 to 60 percent of the envelope are “healthy,” while those at 95 percent are stretched.
Scaling out and risk control
Use exhaustion alerts to trim positions into strength or weakness.
Trail stops just outside Band 2 or Band 3 to stay in trends while letting the envelope expand in volatile phases.
Multi‑timeframe confluence
Run the script on a higher timeframe to locate exhaustion context, then drill down to a lower timeframe for entries.
Opposite signals across timeframes (daily exhaustion vs. 5‑minute breakout) warn you to reduce size or tighten management.
Key inputs to experiment with
Lookback Period: larger values smooth the score and envelope, ideal for swing trading. Shorter values make it reactive for scalps.
Exhaustion Threshold: raise above 2.0 in choppy assets to cut noise, drop to 1.5 for smooth FX pairs.
Envelope Type: Dynamic is great for crypto spikes, Adaptive shines in stocks where volume and volatility wave together.
RSI Divergence: turn off if you prefer a pure price/volume model or if divergence floods the score in your asset.
Alert set included
Fresh upper exhaustion
Fresh lower exhaustion
Extreme upper breach
Extreme lower breach
RSI bearish divergence
RSI bullish divergence
Hook these to TradingView notifications so you get pinged the moment a move hits exhaustion.
Best practices
Always pair exhaustion signals with structure. Support and resistance, liquidity pools and session opens matter.
Avoid blindly shorting every upper signal in a roaring bull market. Let the envelope type help you filter.
Use the table to sanity‑check: a very high score but mid‑range env_position means the band may still be wide enough to absorb more movement.
Backtest threshold combinations on your instrument. Different tickers carry different volatility fingerprints.
Final note
Price Exhaustion Envelope is a flexible framework, not a turnkey system. It excels as a context layer that tells you when the crowd is pressing too hard or when a move still has fuel. Combine it with sound execution tactics, risk limits and market awareness. Trade safe and let the envelope breathe with the market.

The Scalper System XAUUnlock powerful breakout opportunities with this precision tool designed for professional traders.
This indicator combines breakout logic with a smart VWAP filter anchored to the New York session, ensuring only high-quality, directional trades are highlighted, I suggest to use only on GOLD timeframe 5 min.
📈 Features:
Breakout Signals: Detects price breakouts above/below key range levels based on a customizable lookback period.
Session-Aware VWAP Filter: Filters out low-probability trades by validating signal direction against the anchored VWAP starting from the New York open (9:30 AM EST).
Smart Signal Management: Prevents repeated signals in the same direction until a reversal is detected.
Visual Alerts: Clear BUY and SELL labels on the chart, no repainting, no ambiguity.
Multi-Timeframe Friendly: Optimized for scalping and intraday strategies (ideal on 3m or 5m timeframes).
🎯 Why use it?
This indicator is designed to keep you aligned with the institutional flow by using the VWAP as a dynamic support/resistance filter. It eliminates noise and focuses only on breakout setups that occur in the direction of session momentum, increasing your probability of success.
🛠 Settings:
Lookback Period: Define how many candles to scan for the range breakout.
VWAP Session Start: Fixed to New York session open to track real institutional volume-weighted average price.
💡 Ideal for:
Futures Traders (GC, NQ, ES)
Forex & Metals (XAUUSD)
Scalpers and Day Traders
Breakout and VWAP Strategy Followers
----------------------------------------------------------------------------
Sblocca opportunità di breakout ad alta precisione con questo strumento pensato per trader professionisti.
L’indicatore combina la logica di breakout con un intelligente filtro VWAP ancorato all’apertura della sessione di New York, mostrando solo segnali di trading di alta qualità e direzionali, il mio consiglio è di usarlo solo sul GOLD indicativamente sui 5 minuti.
📈 Caratteristiche principali:
Segnali di Breakout: Rileva rotture al rialzo/ribasso sopra o sotto i livelli chiave, calcolati su un periodo di analisi personalizzabile.
Filtro VWAP basato sulla sessione: Esclude i trade a bassa probabilità, validando i segnali solo se in linea con la direzione del VWAP della sessione di New York (apertura 15:30 ora italiana).
Gestione Intelligente dei Segnali: Evita segnali ripetuti nella stessa direzione finché non si verifica un’inversione.
Avvisi Visivi: Etichette chiare di BUY e SELL sul grafico, senza repaint, zero ambiguità.
Ottimizzato per Multi-Timeframe: Funziona perfettamente per scalping e intraday (ideale su timeframe 3m o 5m).
🎯 Perché usarlo?
Questo indicatore ti mantiene allineato con il flusso istituzionale utilizzando il VWAP come supporto/resistenza dinamico. Elimina il rumore di fondo e si concentra solo su configurazioni di breakout che avvengono nella direzione della forza della sessione, aumentando la probabilità di successo.
🛠 Impostazioni personalizzabili:
Periodo di analisi: Imposta il numero di candele da analizzare per calcolare i livelli di breakout.
Inizio sessione VWAP: Fissato all'apertura della sessione di New York per tracciare il vero prezzo medio ponderato per volume istituzionale.
💡 Ideale per:
Trader su Futures (GC, NQ, ES)
Forex & Metalli (es. XAUUSD)
Scalper e Day Trader
Strategie basate su Breakout e VWAP
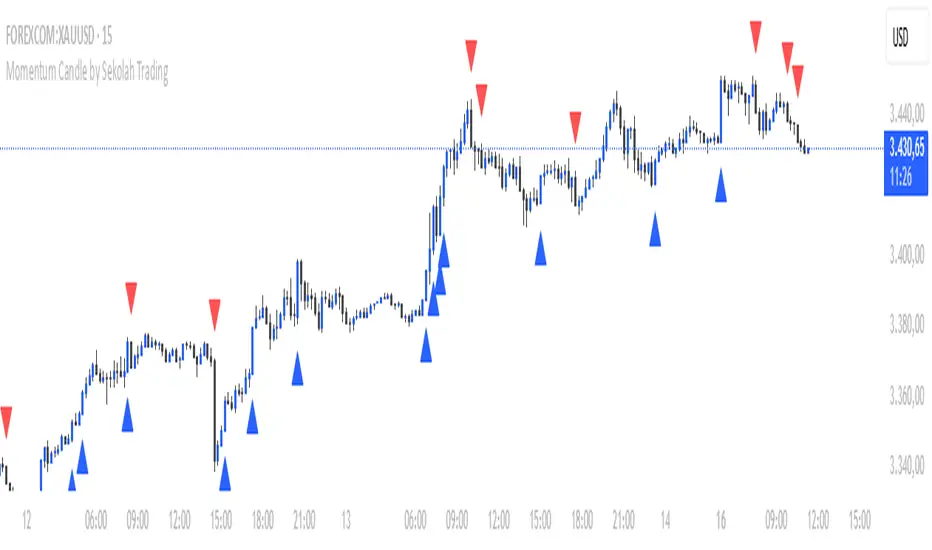
Momentum Candle V2 by Sekolah Trading📌 Momentum Candle V2 by Sekolah Trading – Pair-Based Volatility & Wick Ratio Filter
This script provides a structured and adaptive approach to detecting high-probability momentum candles in intraday markets. It dynamically adjusts pip thresholds and wick filtering conditions based on the selected symbol and timeframe, making it highly practical for real-time trading.
🔍 Concept and Originality
Momentum Candle V2 by Sekolah Trading implements a custom-built methodology combining:
Dynamic Pip Calibration
For each supported instrument (e.g., XAUUSD, USDJPY, GBPUSD, AUDUSD, EURUSD, BTCUSD), the user can define a pip threshold that determines the minimum valid body size for momentum candles. These thresholds are tailored for each pair and timeframe (M5, M15, H1), ensuring the logic adjusts to different volatility profiles.
Wick-to-Body Ratio Filtering
The script filters out candles with large wicks by requiring that total wick length (upper + lower) be no more than 30% of the full candle range. This helps identify decisive candles with minimal rejection.
Directional Validation
Bullish momentum is defined as: Close > Open with a shorter upper wick.
Bearish momentum is: Close < Open with a shorter lower wick.
Real-Time Timing Filter
Alerts are only triggered when the current candle is between 20 and 90 seconds from closing, which reduces noise and encourages confirmation-based entry.
Non-Repainting Logic
All calculations run in real-time with confirmed candles only — no lookahead or future leak.
📊 Visual Output – How to Read the Chart
When the conditions above are met, the script displays triangle markers on the chart:
🔺 Red downward triangle above the candle: valid bearish momentum signal
🔻 Blue upward triangle below the candle: valid bullish momentum signal
These shapes appear on live bars during the final moments of the candle to alert traders to potential confirmed momentum.
🔔 Alert Conditions
Two alert types are provided:
Momentum Bullish: Large bullish candle with small upper wick, during last 20–90s of bar
Momentum Bearish: Large bearish candle with small lower wick, same timing window
Alerts are designed for precision entries at candle close.
🧭 How to Use
Apply the script to a 5m, 15m, or 1h chart.
Configure pip thresholds for your preferred pairs from the input settings.
Watch for triangle markers near the close of each candle:
Blue = potential bullish momentum
Red = potential bearish momentum
Set alerts:
Go to Alerts → Select Momentum Bullish or Momentum Bearish
Frequency: Once Per Bar
Customize message: e.g. “Momentum Bullish on XAUUSD M15”
Combine signals with:
EMA, S/R, or trend filters
Volume/Order Flow
Liquidity zone or breakout context
🛡️ Why This Script Is Closed-Source
This script uses proprietary logic developed by Sekolah Trading, including:
Custom pip calibration engine
Adaptive wick filtering
Real-time entry validation with triangle plots
While the code is protected, the methodology has been explained transparently here in accordance with TradingView publishing rules.
⚠️ Disclaimer
This script is provided for educational and technical analysis purposes only.
It does not guarantee results or provide financial advice. Always verify trades with your own strategy and risk controls.
Author: Sekolah Trading
Version: Momentum Candle V2
Built with Pine Script v6

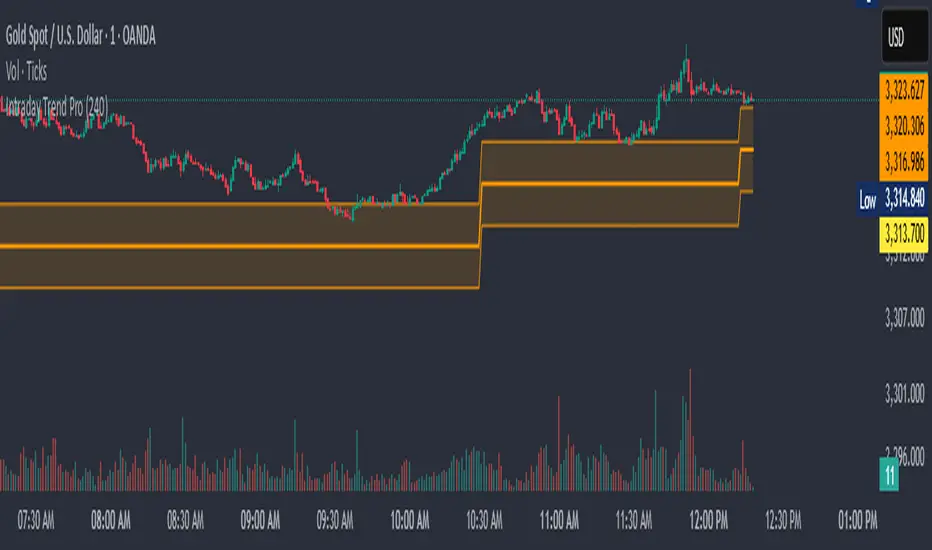
Intraday Trend Pro📈 Intraday Trend Pro — Multi-Timeframe Smart Indicator
Unlock precision in your intraday trading with Intraday Trend Pro, a powerful and versatile indicator built for serious traders. This tool is designed to:
✅ Identify the True Intraday Trend
Quickly and clearly spot bullish or bearish trends using a refined algorithm that filters out noise and false signals.
✅ Smart Entry & Stop Loss Suggestions
The script dynamically suggests optimal entry points and protective stop-loss levels, helping you manage risk and improve trade timing.
✅ Multi-Timeframe Analysis (MTF)
Enable the optional MTF mode to blend higher timeframes with the current chart for a more reliable signal confirmation, enhancing your confidence before entering a trade.
✅ Works Seamlessly Across Assets
Whether you’re trading indices like BankNifty, commodities like XAU/USD, or high-volume stocks, this indicator adjusts to deliver actionable insights.
✅ Customization Made Easy
Input controls allow you to fine-tune the trend settings, select timeframes, and adapt to your unique strategy—whether scalping or holding through the day.
Use Cases:
Confirming trend strength before entering trades
Determining accurate support/resistance for SL placement
Avoiding sideways markets and false breakouts
Aligning trades with higher timeframe momentum
Ideal For:
Intraday traders and scalpers looking for a clean, accurate, and multi-timeframe-aware tool to improve consistency.
Automated Scalping Signals with TP/SL Indicator [QuantAlgo]🟢 Overview
The Automated Scalping Signals with Take Profit & Stop Loss Indicator is a multi-timeframe trading system that combines market structure analysis with directional bias filtering to identify potential scalping opportunities. It detects Points of Interest (POI) including Fair Value Gaps (FVG) and Order Blocks (OB) while cross-referencing entries with higher timeframe exponential moving average positioning to create systematic entry conditions.
The indicator features adaptive timeframe calculations that automatically scale analysis periods based on your chart timeframe, maintaining consistent analytical relationships across different trading sessions. It provides integrated trade management with stop loss calculation methods, configurable risk-reward ratios, and real-time performance tracking through dashboard displays showing trade statistics, bias direction, and active position status.
This advanced system is designed for low timeframe trading, typically performing optimally on 1 to 15-minute charts across popular instruments such as OANDA:XAUUSD , CME_MINI:MES1! , CME_MINI:ES1! , CME_MINI:MNQ1! , CBOT_MINI:YM1! , CBOT_MINI:MYM1! , BYBIT:BTCUSDT.P , BYBIT:ETHUSDT.P , or any asset and timeframe of your preference.
🟢 How It Works
The indicator operates using a dual-timeframe mathematical framework where higher timeframe exponential moving averages establish directional bias through cross-over analysis, while simultaneously scanning for specific market structure patterns on the POI timeframe. The timeframe calculation engine uses multiplication factors to determine analysis periods, ensuring the bias timeframe provides trend context while the POI timeframe captures structural formations.
The structural analysis begins with FVG detection, which systematically scans price action to identify imbalances where gaps exist between consecutive candle ranges with no overlapping wicks. When such gaps are detected, the algorithm measures their size against minimum thresholds to filter out insignificant formations. Concurrently, OB recognition analyzes three-candle sequences, examining specific open/close relationships that indicate potential institutional accumulation zones. Once these structural patterns are identified, the algorithm cross-references them against the higher timeframe bias direction, creating a validation filter that only permits entries aligned with the prevailing EMA cross-over state. When price subsequently intersects these validated POI zones, entry signals generate with the system calculating entry levels at zone midpoints, then applying the selected stop loss methodology combined with the configured risk-reward ratio to determine take profit placement.
To mirror realistic trading conditions, the indicator incorporates configurable slippage calculations that account for execution differences between intended and actual fill prices. When trades reach their take profit or stop loss levels, the algorithm applies slippage adjustments that worsen the exit prices in a conservative manner - reducing take profit fills and increasing stop loss impact. This approach ensures backtesting results reflect more realistic performance expectations by accounting for spread costs, market volatility during execution, and liquidity constraints that occur in live trading environments.
It also has a performance dashboard that continuously tracks and displays comprehensive trading metrics:
1/ Bias TF / POI TF: Displays the calculated timeframes used for bias analysis and POI detection, showing the actual periods (e.g., "15m / 5m") that result from the multiplier settings to confirm proper adaptive timeframe selection
2/ Bias Direction: Shows current market trend assessment (Bullish, Bearish, or Sideways) derived from EMA cross-over analysis to indicate which trade directions align with prevailing momentum
3/ Data Processing: Indicates how many price bars have been analyzed by the system, helping users verify if complete historical data has been processed for comprehensive strategy validation
4/ Total Trades: Displays the cumulative number of completed trades plus any active positions, providing volume assessment for statistical significance of other metrics
5/ Wins/Losses: Shows the raw count of profitable versus unprofitable trades, offering immediate insight into strategy effectiveness frequency
6/ Win Rate: Reveals the percentage of successful trades, where values above 50% generally indicate effective entry timing and values below suggest strategy refinement needs
7/ Total R-Multiple: Displays cumulative risk-reward performance across all trades, with positive values demonstrating profitable system operation and negative values indicating net losses requiring analysis
8/ Average R Win/Loss: Shows average risk-reward ratios for winning and losing trades separately, where winning averages approaching the configured take profit ratio indicate minimal slippage impact while losing averages near -1.0 suggest effective stop loss execution
9/ TP Ratio / Slippage: Displays the configured take profit ratio and slippage settings with calculated performance impact, showing how execution costs affect actual versus theoretical returns
10/ Profit Factor: Calculates the ratio of total winning amounts to total losing amounts, where values above 1.5 suggest robust profitability, values between 1.0-1.5 indicate modest success, and values below 1.0 show net losses
11/ Maximum Drawdown: Tracks the largest peak-to-trough decline in R-multiple terms, with smaller negative values indicating better capital preservation and risk control during losing streaks
🟢 How to Use
Start by applying the indicator to your chart and observe its performance across different market conditions to understand how it identifies bias direction and POI formations. Then navigate to the settings panel to configure the Bias Timeframe Multiplier for trend context sensitivity and POI Timeframe Multiplier for structural analysis frequency according to your trading preference and objectives.
Next, fine-tune the EMA periods in Bias Settings to control trend detection sensitivity and select your preferred POI types based on your analytical preference. Proceed to configure your Risk Management approach by selecting from the available stop loss calculation methods and setting the Take Profit ratio that aligns with your risk tolerance and profit objectives. Complete the setup by customizing Display Settings to control table visibility and trade visualization elements, adjusting UI positioning and colors for optimal chart readability, then activate Alert Conditions for automated notifications on trade entries, exits, and bias direction changes to support systematic trade management.
🟢 Examples
OANDA:XAUUSD
CME_MINI:MES1!
CME_MINI:ES1!
CME_MINI:MNQ1!
CBOT_MINI:YM1!
BYBIT:BTCUSDT.P
BINANCE:SOLUSD
*Disclaimer: Past performance is not indicative of future results. None of our statements, claims, or signals from our indicators are intended to be financial advice. All trading involves substantial risk of loss, not just upside potential. Users are highly recommended to carefully consider their financial situation and risk tolerance before trading.

Logarithmic Moving Average (LMA) [QuantAlgo]🟢 Overview
The Logarithmic Moving Average (LMA) uses advanced logarithmic weighting to create a dynamic trend-following indicator that prioritizes recent price action while maintaining statistical significance. Unlike traditional moving averages that use linear or exponential weights, this indicator employs logarithmic decay functions to create a more sophisticated price averaging system that adapts to market volatility and momentum conditions.
The indicator displays a smoothed signal line that oscillates around zero, with positive values indicating bullish momentum and negative values indicating bearish momentum. The signal incorporates trend quality assessment, momentum confirmation, and multiple filtering mechanisms to help traders and investors identify trend continuation and reversal opportunities across different timeframes and asset classes.
🟢 How It Works
The indicator's core innovation lies in its logarithmic weighting system, where weights are calculated using the formula: w = 1.0 / math.pow(math.log(i + steepness), 2) The steepness parameter controls how aggressively recent data is prioritized over historical data, creating a dynamic weight decay that can be fine-tuned for different trading styles. This logarithmic approach provides more nuanced weight distribution compared to exponential moving averages, offering better responsiveness while maintaining stability.
The LMA calculation combines multiple sophisticated components. First, it calculates the logarithmic weighted average of closing prices. Then it measures the slope of this average over a 10-period lookback: lmaSlope = (lma - lma ) / lma * 100 The system also incorporates trend quality assessment using R-squared correlation analysis of log-transformed prices, measuring how well the price data fits a linear trend model over the specified period.
The final signal generation uses the formula: signal = lmaSlope * (0.5 + rSquared * 0.5) which combines the LMA slope with trend quality weighting. When momentum confirmation is enabled, the indicator calculates annualized log-return momentum and applies a multiplier when the momentum direction aligns with the signal direction, strengthening confirmed signals while filtering out weak or counter-trend movements.
🟢 How to Use
1. Signal Interpretation and Threshold Zones
Positive Values (Above Zero): LMA slope indicating bullish momentum with upward price trajectory relative to logarithmic baseline
Negative Values (Below Zero): LMA slope indicating bearish momentum with downward price trajectory relative to logarithmic baseline
Zero Line Crosses: Signal transitions between bullish and bearish regimes, indicating potential trend changes
Long Entry Threshold Zone: Area above positive threshold (default 0.5) indicating confirmed bullish signals suitable for long positions
Short Entry Threshold Zone: Area below negative threshold (default -0.5) indicating confirmed bearish signals suitable for short positions
Extreme Values: Signals exceeding ±1.0 represent strong momentum conditions with higher probability of continuation
2. Momentum Confirmation and Visual Analysis
Signal Color Intensity: Gradient coloring shows signal strength, with brighter colors indicating stronger momentum
Bar Coloring: Optional price bar coloring matches signal direction for quick visual trend identification
Position Labels: Real-time position classification (Bullish/Bearish/Neutral) displayed on the latest bar
Momentum Weight Factor: When short-term log-return momentum aligns with LMA signal direction, the signal receives additional weight confirmation
Trend Quality Component: R-squared values weight the signal strength, with higher correlation indicating more reliable trend conditions
3. Examples: Preconfigured Settings
Default: Universally applicable configuration balanced for medium-term investing and general trading across multiple timeframes and asset classes.
Scalping: Highly responsive setup with shorter period and higher steepness for ultra-short-term trades on 1-15 minute charts, optimized for quick momentum shifts.
Swing Trading: Extended period with moderate steepness and increased smoothing for multi-day positions, designed to filter noise while capturing larger price swings on 1-4 hour and daily charts.
Trend Following: Maximum smoothing with lower steepness for established trend identification, generating fewer but more reliable signals optimal for daily and weekly timeframes.
Mean Reversion: Shorter period with high steepness for counter-trend strategies, more sensitive to extreme moves and reversal opportunities in ranging market conditions.

Intraday BUY/SELL & AUTO SL (5-min timeframe only) by chaitu50c)Intraday BUY/SELL & AUTO SL (5-min timeframe only) by chaitu50c
This indicator provides intraday traders with BUY/SELL reversal signals and automated SL (Stoploss) tracking, based on a 3-candle reversal block logic — designed to work exclusively on the 5-min timeframe.
Key Features:
• 3-Candle Reversal Logic — Signals are generated when a defined 3-candle reversal pattern is detected (body-close breakout).
• Current Session Only — All signals and SL lines are valid only for the current session and automatically reset at session start.
• BUY/SELL Signal Labels — Visual ▲ and ▼ labels mark valid reversal signals on the chart.
• Dynamic Auto SL Lines — Plots dashed SL lines based on the reversal block's low/high.
• SL HIT Tracking — If SL is broken, the line stops extending and a ‘SL HIT’ label is displayed at the midpoint of the SL line.
• Adjustable Visual Settings — Customize signal label size, SL line width, colors, and more.
• Clean & Lightweight — Optimized for intraday use without cluttering the chart.
How to Use:
You can trade this indicator in two ways:
1. Direct Signal Entry — Take a BUY or SELL trade when a valid ▲/▼ reversal signal forms.
2. SL HIT Re-entry — If an existing SL line is broken and ‘SL HIT’ appears, you can optionally take an opposite side trade in the direction of the SL HIT.
Example:
A BUY signal is generated and an SL line is plotted below.
If price breaks the SL (SL HIT appears), you may consider entering a SELL trade at that point — as it indicates weakness.
Important Notes:
• Works only on 5-min timeframe — Set your chart to 5-min for correct behavior.
• Designed for intraday trading — all signals and SL levels reset at session start.
• Does not carry signals between sessions.
• SL lines and HIT labels provide a clear and simple visual aid for trade management.
---

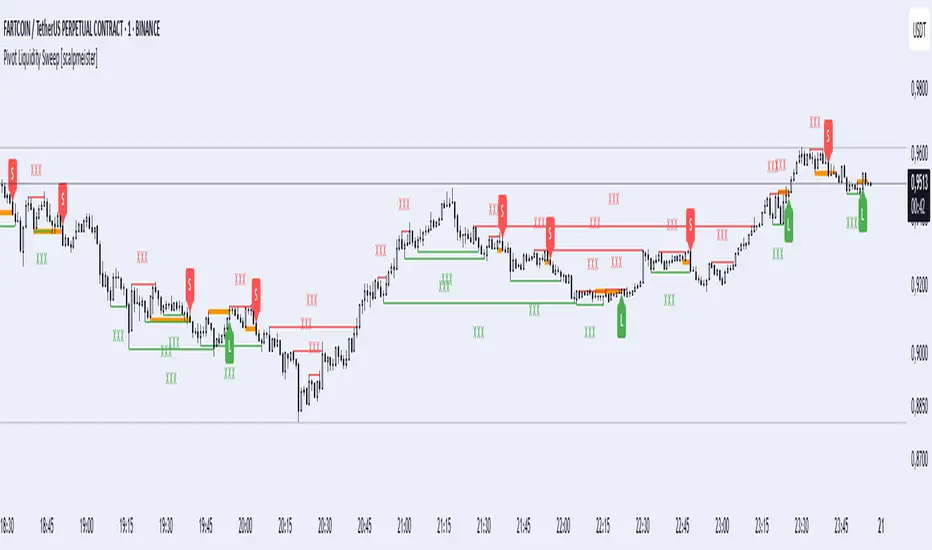
Pivot Liquidity Sweep [scalpmeister]📌 Pivot Liquidity Sweep
Scalp-oriented, liquidity sweep-based advanced signal and strategy indicator.
This indicator analyzes the price's sweeping of significant pivot levels and the subsequent breakouts to generate long/short signals based on different logics. It is sensitive to both classic sweep logic and strong reversal candles. Additionally, it visually marks liquidity gathering zones, offering excellent opportunities especially for scalp and intraday traders.
⚙️ Features and Strategy Types
🟢 Automatic Pivot Detection:
Pivot high/low levels are detected and stored based on the number of left and right bars.
🔴 Sweep Detection (Stop Hunt):
If the price violates a pivot level with a wick and closes inside, it is considered a sweep (liquidity cleaning). Strategies activate after this sweep.
🧠 5 Different Signal Styles:
SweepBreak:
It is expected that the extreme (high/low) level of the sweeping candle is broken with a close.
PivotBreak:
After the sweep, the first newly formed pivot in the trend direction is expected to break. (It is dynamically determined and drawn on the chart.)
StrongSweep:
It is sufficient if the candle following the sweep surpasses the previous candle with a single candle. No additional breakout is expected.
StrongCandle:
Strong momentum candles measured with a special RSI calculation are taken into account. It considers strong opposite-direction candles formed shortly after a pivot sweep.
ReversalCandleSweep:
Reversal candles that close in the opposite direction after a sweep (e.g., a red close on a sweep candle formed at the top or a green close at the bottom) are directly considered as signals.
📐 Technical Details:
Signals are triggered only once (triggered control).
Sweep lines (green/red), Long and Short lines (Orange)
Strong candles are filtered using an RSI-momentum-based measurement system (StrongCandle).
Sweep and breakout zones are dynamically invalidated. That is, if the zones are violated by the price, the signals and lines are automatically canceled.
🎯 Who Should Use It?
Professional traders working with liquidity zones
Scalp and intraday strategy practitioners
Those focused on stop hunts, sweeps, and reversal zones
🔔 Alert Support:
Sweep High / Low Alert
Long / Short Signal Alert
Trend Gauge [BullByte]Trend Gauge
Summary
A multi-factor trend detection indicator that aggregates EMA alignment, VWMA momentum scaling, volume spikes, ATR breakout strength, higher-timeframe confirmation, ADX-based regime filtering, and RSI pivot-divergence penalty into one normalized trend score. It also provides a confidence meter, a Δ Score momentum histogram, divergence highlights, and a compact, scalable dashboard for at-a-glance status.
________________________________________
## 1. Purpose of the Indicator
Why this was built
Traders often monitor several indicators in parallel - EMAs, volume signals, volatility breakouts, higher-timeframe trends, ADX readings, divergence alerts, etc., which can be cumbersome and sometimes contradictory. The “Trend Gauge” indicator was created to consolidate these complementary checks into a single, normalized score that reflects the prevailing market bias (bullish, bearish, or neutral) and its strength. By combining multiple inputs with an adaptive regime filter, scaling contributions by magnitude, and penalizing weakening signals (divergence), this tool aims to reduce noise, highlight genuine trend opportunities, and warn when momentum fades.
Key Design Goals
Signal Aggregation
Merged trend-following signals (EMA crossover, ATR breakout, higher-timeframe confirmation) and momentum signals (VWMA thrust, volume spikes) into a unified score that reflects directional bias more holistically.
Market Regime Awareness
Implemented an ADX-style filter to distinguish between trending and ranging markets, reducing the influence of trend signals during sideways phases to avoid false breakouts.
Magnitude-Based Scaling
Replaced binary contributions with scaled inputs: VWMA thrust and ATR breakout are weighted relative to recent averages, allowing for more nuanced score adjustments based on signal strength.
Momentum Divergence Penalty
Integrated pivot-based RSI divergence detection to slightly reduce the overall score when early signs of momentum weakening are detected, improving risk-awareness in entries.
Confidence Transparency
Added a live confidence metric that shows what percentage of enabled sub-indicators currently agree with the overall bias, making the scoring system more interpretable.
Momentum Acceleration Visualization
Plotted the change in score (Δ Score) as a histogram bar-to-bar, highlighting whether momentum is increasing, flattening, or reversing, aiding in more timely decision-making.
Compact Informational Dashboard
Presented a clean, scalable dashboard that displays each component’s status, the final score, confidence %, detected regime (Trending/Ranging), and a labeled strength gauge for quick visual assessment.
________________________________________
## 2. Why a Trader Should Use It
Main benefits and use cases
1. Unified View: Rather than juggling multiple windows or panels, this indicator delivers a single score synthesizing diverse signals.
2. Regime Filtering: In ranging markets, trend signals often generate false entries. The ADX-based regime filter automatically down-weights trend-following components, helping you avoid chasing false breakouts.
3. Nuanced Momentum & Volatility: VWMA and ATR breakout contributions are normalized by recent averages, so strong moves register strongly while smaller fluctuations are de-emphasized.
4. Early Warning of Weakening: Pivot-based RSI divergence is detected and used to slightly reduce the score when price/momentum diverges, giving a cautionary signal before a full reversal.
5. Confidence Meter: See at a glance how many sub-indicators align with the aggregated bias (e.g., “80% confidence” means 4 out of 5 components agree ). This transparency avoids black-box decisions.
6. Trend Acceleration/Deceleration View: The Δ Score histogram visualizes whether the aggregated score is rising (accelerating trend) or falling (momentum fading), supplementing the main oscillator.
7. Compact Dashboard: A corner table lists each check’s status (“Bull”, “Bear”, “Flat” or “Disabled”), plus overall Score, Confidence %, Regime, Trend Strength label, and a gauge bar. Users can scale text size (Normal, Small, Tiny) without removing elements, so the full picture remains visible even in compact layouts.
8. Customizable & Transparent: All components can be enabled/disabled and parameterized (lengths, thresholds, weights). The full Pine code is open and well-commented, letting users inspect or adapt the logic.
9. Alert-ready: Built-in alert conditions fire when the score crosses weak thresholds to bullish/bearish or returns to neutral, enabling timely notifications.
________________________________________
## 3. Component Rationale (“Why These Specific Indicators?”)
Each sub-component was chosen because it adds complementary information about trend or momentum:
1. EMA Cross
o Basic trend measure: compares a faster EMA vs. a slower EMA. Quickly reflects trend shifts but by itself can whipsaw in sideways markets.
2. VWMA Momentum
o Volume-weighted moving average change indicates momentum with volume context. By normalizing (dividing by a recent average absolute change), we capture the strength of momentum relative to recent history. This scaling prevents tiny moves from dominating and highlights genuinely strong momentum.
3. Volume Spikes
o Sudden jumps in volume combined with price movement often accompany stronger moves or reversals. A binary detection (+1 for bullish spike, -1 for bearish spike) flags high-conviction bars.
4. ATR Breakout
o Detects price breaking beyond recent highs/lows by a multiple of ATR. Measures breakout strength by how far beyond the threshold price moves relative to ATR, capped to avoid extreme outliers. This gives a volatility-contextual trend signal.
5. Higher-Timeframe EMA Alignment
o Confirms whether the shorter-term trend aligns with a higher timeframe trend. Uses request.security with lookahead_off to avoid future data. When multiple timeframes agree, confidence in direction increases.
6. ADX Regime Filter (Manual Calculation)
o Computes directional movement (+DM/–DM), smoothes via RMA, computes DI+ and DI–, then a DX and ADX-like value. If ADX ≥ threshold, market is “Trending” and trend components carry full weight; if ADX < threshold, “Ranging” mode applies a configurable weight multiplier (e.g., 0.5) to trend-based contributions, reducing false signals in sideways conditions. Volume spikes remain binary (optional behavior; can be adjusted if desired).
7. RSI Pivot-Divergence Penalty
o Uses ta.pivothigh / ta.pivotlow with a lookback to detect pivot highs/lows on price and corresponding RSI values. When price makes a higher high but RSI makes a lower high (bearish divergence), or price makes a lower low but RSI makes a higher low (bullish divergence), a divergence signal is set. Rather than flipping the trend outright, the indicator subtracts (or adds) a small penalty (configurable) from the aggregated score if it would weaken the current bias. This subtle adjustment warns of weakening momentum without overreacting to noise.
8. Confidence Meter
o Counts how many enabled components currently agree in direction with the aggregated score (i.e., component sign × score sign > 0). Displays this as a percentage. A high percentage indicates strong corroboration; a low percentage warns of mixed signals.
9. Δ Score Momentum View
o Plots the bar-to-bar change in the aggregated score (delta_score = score - score ) as a histogram. When positive, bars are drawn in green above zero; when negative, bars are drawn in red below zero. This reveals acceleration (rising Δ) or deceleration (falling Δ), supplementing the main oscillator.
10. Dashboard
• A table in the indicator pane’s top-right with 11 rows:
1. EMA Cross status
2. VWMA Momentum status
3. Volume Spike status
4. ATR Breakout status
5. Higher-Timeframe Trend status
6. Score (numeric)
7. Confidence %
8. Regime (“Trending” or “Ranging”)
9. Trend Strength label (e.g., “Weak Bullish Trend”, “Strong Bearish Trend”)
10. Gauge bar visually representing score magnitude
• All rows always present; size_opt (Normal, Small, Tiny) only changes text size via text_size, not which elements appear. This ensures full transparency.
________________________________________
## 4. What Makes This Indicator Stand Out
• Regime-Weighted Multi-Factor Score: Trend and momentum signals are adaptively weighted by market regime (trending vs. ranging) , reducing false signals.
• Magnitude Scaling: VWMA and ATR breakout contributions are normalized by recent average momentum or ATR, giving finer gradation compared to simple ±1.
• Integrated Divergence Penalty: Divergence directly adjusts the aggregated score rather than appearing as a separate subplot; this influences alerts and trend labeling in real time.
• Confidence Meter: Shows the percentage of sub-signals in agreement, providing transparency and preventing blind trust in a single metric.
• Δ Score Histogram Momentum View: A histogram highlights acceleration or deceleration of the aggregated trend score, helping detect shifts early.
• Flexible Dashboard: Always-visible component statuses and summary metrics in one place; text size scaling keeps the full picture available in cramped layouts.
• Lookahead-Safe HTF Confirmation: Uses lookahead_off so no future data is accessed from higher timeframes, avoiding repaint bias.
• Repaint Transparency: Divergence detection uses pivot functions that inherently confirm only after lookback bars; description documents this lag so users understand how and when divergence labels appear.
• Open-Source & Educational: Full, well-commented Pine v6 code is provided; users can learn from its structure: manual ADX computation, conditional plotting with series = show ? value : na, efficient use of table.new in barstate.islast, and grouped inputs with tooltips.
• Compliance-Conscious: All plots have descriptive titles; inputs use clear names; no unnamed generic “Plot” entries; manual ADX uses RMA; all request.security calls use lookahead_off. Code comments mention repaint behavior and limitations.
________________________________________
## 5. Recommended Timeframes & Tuning
• Any Timeframe: The indicator works on small (e.g., 1m) to large (daily, weekly) timeframes. However:
o On very low timeframes (<1m or tick charts), noise may produce frequent whipsaws. Consider increasing smoothing lengths, disabling certain components (e.g., volume spike if volume data noisy), or using a larger pivot lookback for divergence.
o On higher timeframes (daily, weekly), consider longer lookbacks for ATR breakout or divergence, and set Higher-Timeframe trend appropriately (e.g., 4H HTF when on 5 Min chart).
• Defaults & Experimentation: Default input values are chosen to be balanced for many liquid markets. Users should test with replay or historical analysis on their symbol/timeframe and adjust:
o ADX threshold (e.g., 20–30) based on instrument volatility.
o VWMA and ATR scaling lengths to match average volatility cycles.
o Pivot lookback for divergence: shorter for faster markets, longer for slower ones.
• Combining with Other Analysis: Use in conjunction with price action, support/resistance, candlestick patterns, order flow, or other tools as desired. The aggregated score and alerts can guide attention but should not be the sole decision-factor.
________________________________________
## 6. How Scoring and Logic Works (Step-by-Step)
1. Compute Sub-Scores
o EMA Cross: Evaluate fast EMA > slow EMA ? +1 : fast EMA < slow EMA ? -1 : 0.
o VWMA Momentum: Calculate vwma = ta.vwma(close, length), then vwma_mom = vwma - vwma . Normalize: divide by recent average absolute momentum (e.g., ta.sma(abs(vwma_mom), lookback)), clip to .
o Volume Spike: Compute vol_SMA = ta.sma(volume, len). If volume > vol_SMA * multiplier AND price moved up ≥ threshold%, assign +1; if moved down ≥ threshold%, assign -1; else 0.
o ATR Breakout: Determine recent high/low over lookback. If close > high + ATR*mult, compute distance = close - (high + ATR*mult), normalize by ATR, cap at a configured maximum. Assign positive contribution. Similarly for bearish breakout below low.
o Higher-Timeframe Trend: Use request.security(..., lookahead=barmerge.lookahead_off) to fetch HTF EMAs; assign +1 or -1 based on alignment.
2. ADX Regime Weighting
o Compute manual ADX: directional movements (+DM, –DM), smoothed via RMA, DI+ and DI–, then DX and ADX via RMA. If ADX ≥ threshold, market is considered “Trending”; otherwise “Ranging.”
o If trending, trend-based contributions (EMA, VWMA, ATR, HTF) use full weight = 1.0. If ranging, use weight = ranging_weight (e.g., 0.5) to down-weight them. Volume spike stays binary ±1 (optional to change if desired).
3. Aggregate Raw Score
o Sum weighted contributions of all enabled components. Count the number of enabled components; if zero, default count = 1 to avoid division by zero.
4. Divergence Penalty
o Detect pivot highs/lows on price and corresponding RSI values, using a lookback. When price and RSI diverge (bearish or bullish divergence), check if current raw score is in the opposing direction:
If bearish divergence (price higher high, RSI lower high) and raw score currently positive, subtract a penalty (e.g., 0.5).
If bullish divergence (price lower low, RSI higher low) and raw score currently negative, add a penalty.
o This reduces score magnitude to reflect weakening momentum, without flipping the trend outright.
5. Normalize and Smooth
o Normalized score = (raw_score / number_of_enabled_components) * 100. This yields a roughly range.
o Optional EMA smoothing of this normalized score to reduce noise.
6. Interpretation
o Sign: >0 = net bullish bias; <0 = net bearish bias; near zero = neutral.
o Magnitude Zones: Compare |score| to thresholds (Weak, Medium, Strong) to label trend strength (e.g., “Weak Bullish Trend”, “Medium Bearish Trend”, “Strong Bullish Trend”).
o Δ Score Histogram: The histogram bars from zero show change from previous bar’s score; positive bars indicate acceleration, negative bars indicate deceleration.
o Confidence: Percentage of sub-indicators aligned with the score’s sign.
o Regime: Indicates whether trend-based signals are fully weighted or down-weighted.
________________________________________
## 7. Oscillator Plot & Visualization: How to Read It
Main Score Line & Area
The oscillator plots the aggregated score as a line, with colored fill: green above zero for bullish area, red below zero for bearish area. Horizontal reference lines at ±Weak, ±Medium, and ±Strong thresholds mark zones: crossing above +Weak suggests beginning of bullish bias, above +Medium for moderate strength, above +Strong for strong trend; similarly for bearish below negative thresholds.
Δ Score Histogram
If enabled, a histogram shows score - score . When positive, bars appear in green above zero, indicating accelerating bullish momentum; when negative, bars appear in red below zero, indicating decelerating or reversing momentum. The height of each bar reflects the magnitude of change in the aggregated score from the prior bar.
Divergence Highlight Fill
If enabled, when a pivot-based divergence is confirmed:
• Bullish Divergence : fill the area below zero down to –Weak threshold in green, signaling potential reversal from bearish to bullish.
• Bearish Divergence : fill the area above zero up to +Weak threshold in red, signaling potential reversal from bullish to bearish.
These fills appear with a lag equal to pivot lookback (the number of bars needed to confirm the pivot). They do not repaint after confirmation, but users must understand this lag.
Trend Direction Label
When score crosses above or below the Weak threshold, a small label appears near the score line reading “Bullish” or “Bearish.” If the score returns within ±Weak, the label “Neutral” appears. This helps quickly identify shifts at the moment they occur.
Dashboard Panel
In the indicator pane’s top-right, a table shows:
1. EMA Cross status: “Bull”, “Bear”, “Flat”, or “Disabled”
2. VWMA Momentum status: similarly
3. Volume Spike status: “Bull”, “Bear”, “No”, or “Disabled”
4. ATR Breakout status: “Bull”, “Bear”, “No”, or “Disabled”
5. Higher-Timeframe Trend status: “Bull”, “Bear”, “Flat”, or “Disabled”
6. Score: numeric value (rounded)
7. Confidence: e.g., “80%” (colored: green for high, amber for medium, red for low)
8. Regime: “Trending” or “Ranging” (colored accordingly)
9. Trend Strength: textual label based on magnitude (e.g., “Medium Bullish Trend”)
10. Gauge: a bar of blocks representing |score|/100
All rows remain visible at all times; changing Dashboard Size only scales text size (Normal, Small, Tiny).
________________________________________
## 8. Example Usage (Illustrative Scenario)
Example: BTCUSD 5 Min
1. Setup: Add “Trend Gauge ” to your BTCUSD 5 Min chart. Defaults: EMAs (8/21), VWMA 14 with lookback 3, volume spike settings, ATR breakout 14/5, HTF = 5m (or adjust to 4H if preferred), ADX threshold 25, ranging weight 0.5, divergence RSI length 14 pivot lookback 5, penalty 0.5, smoothing length 3, thresholds Weak=20, Medium=50, Strong=80. Dashboard Size = Small.
2. Trend Onset: At some point, price breaks above recent high by ATR multiple, volume spikes upward, faster EMA crosses above slower EMA, HTF EMA also bullish, and ADX (manual) ≥ threshold → aggregated score rises above +20 (Weak threshold) into +Medium zone. Dashboard shows “Bull” for EMA, VWMA, Vol Spike, ATR, HTF; Score ~+60–+70; Confidence ~100%; Regime “Trending”; Trend Strength “Medium Bullish Trend”; Gauge ~6–7 blocks. Δ Score histogram bars are green and rising, indicating accelerating bullish momentum. Trader notes the alignment.
3. Divergence Warning: Later, price makes a slightly higher high but RSI fails to confirm (lower RSI high). Pivot lookback completes; the indicator highlights a bearish divergence fill above zero and subtracts a small penalty from the score, causing score to stall or retrace slightly. Dashboard still bullish but score dips toward +Weak. This warns the trader to tighten stops or take partial profits.
4. Trend Weakens: Score eventually crosses below +Weak back into neutral; a “Neutral” label appears, and a “Neutral Trend” alert fires if enabled. Trader exits or avoids new long entries. If score subsequently crosses below –Weak, a “Bearish” label and alert occur.
5. Customization: If the trader finds VWMA noise too frequent on this instrument, they may disable VWMA or increase lookback. If ATR breakouts are too rare, adjust ATR length or multiplier. If ADX threshold seems off, tune threshold. All these adjustments are explained in Inputs section.
6. Visualization: The screenshot shows the main score oscillator with colored areas, reference lines at ±20/50/80, Δ Score histogram bars below/above zero, divergence fill highlighting potential reversal, and the dashboard table in the top-right.
________________________________________
## 9. Inputs Explanation
A concise yet clear summary of inputs helps users understand and adjust:
1. General Settings
• Theme (Dark/Light): Choose background-appropriate colors for the indicator pane.
• Dashboard Size (Normal/Small/Tiny): Scales text size only; all dashboard elements remain visible.
2. Indicator Settings
• Enable EMA Cross: Toggle on/off basic EMA alignment check.
o Fast EMA Length and Slow EMA Length: Periods for EMAs.
• Enable VWMA Momentum: Toggle VWMA momentum check.
o VWMA Length: Period for VWMA.
o VWMA Momentum Lookback: Bars to compare VWMA to measure momentum.
• Enable Volume Spike: Toggle volume spike detection.
o Volume SMA Length: Period to compute average volume.
o Volume Spike Multiplier: How many times above average volume qualifies as spike.
o Min Price Move (%): Minimum percent change in price during spike to qualify as bullish or bearish.
• Enable ATR Breakout: Toggle ATR breakout detection.
o ATR Length: Period for ATR.
o Breakout Lookback: Bars to look back for recent highs/lows.
o ATR Multiplier: Multiplier for breakout threshold.
• Enable Higher Timeframe Trend: Toggle HTF EMA alignment.
o Higher Timeframe: E.g., “5” for 5-minute when on 1-minute chart, or “60” for 5 Min when on 15m, etc. Uses lookahead_off.
• Enable ADX Regime Filter: Toggles regime-based weighting.
o ADX Length: Period for manual ADX calculation.
o ADX Threshold: Value above which market considered trending.
o Ranging Weight Multiplier: Weight applied to trend components when ADX < threshold (e.g., 0.5).
• Scale VWMA Momentum: Toggle normalization of VWMA momentum magnitude.
o VWMA Mom Scale Lookback: Period for average absolute VWMA momentum.
• Scale ATR Breakout Strength: Toggle normalization of breakout distance by ATR.
o ATR Scale Cap: Maximum multiple of ATR used for breakout strength.
• Enable Price-RSI Divergence: Toggle divergence detection.
o RSI Length for Divergence: Period for RSI.
o Pivot Lookback for Divergence: Bars on each side to identify pivot high/low.
o Divergence Penalty: Amount to subtract/add to score when divergence detected (e.g., 0.5).
3. Score Settings
• Smooth Score: Toggle EMA smoothing of normalized score.
• Score Smoothing Length: Period for smoothing EMA.
• Weak Threshold: Absolute score value under which trend is considered weak or neutral.
• Medium Threshold: Score above Weak but below Medium is moderate.
• Strong Threshold: Score above this indicates strong trend.
4. Visualization Settings
• Show Δ Score Histogram: Toggle display of the bar-to-bar change in score as a histogram. Default true.
• Show Divergence Fill: Toggle background fill highlighting confirmed divergences. Default true.
Each input has a tooltip in the code.
________________________________________
## 10. Limitations, Repaint Notes, and Disclaimers
10.1. Repaint & Lag Considerations
• Pivot-Based Divergence Lag: The divergence detection uses ta.pivothigh / ta.pivotlow with a specified lookback. By design, a pivot is only confirmed after the lookback number of bars. As a result:
o Divergence labels or fills appear with a delay equal to the pivot lookback.
o Once the pivot is confirmed and the divergence is detected, the fill/label does not repaint thereafter, but you must understand and accept this lag.
o Users should not treat divergence highlights as predictive signals without additional confirmation, because they appear after the pivot has fully formed.
• Higher-Timeframe EMA Alignment: Uses request.security(..., lookahead=barmerge.lookahead_off), so no future data from the higher timeframe is used. This avoids lookahead bias and ensures signals are based only on completed higher-timeframe bars.
• No Future Data: All calculations are designed to avoid using future information. For example, manual ADX uses RMA on past data; security calls use lookahead_off.
10.2. Market & Noise Considerations
• In very choppy or low-liquidity markets, some components (e.g., volume spikes or VWMA momentum) may be noisy. Users can disable or adjust those components’ parameters.
• On extremely low timeframes, noise may dominate; consider smoothing lengths or disabling certain features.
• On very high timeframes, pivots and breakouts occur less frequently; adjust lookbacks accordingly to avoid sparse signals.
10.3. Not a Standalone Trading System
• This is an indicator, not a complete trading strategy. It provides signals and context but does not manage entries, exits, position sizing, or risk management.
• Users must combine it with their own analysis, money management, and confirmations (e.g., price patterns, support/resistance, fundamental context).
• No guarantees: past behavior does not guarantee future performance.
10.4. Disclaimers
• Educational Purposes Only: The script is provided as-is for educational and informational purposes. It does not constitute financial, investment, or trading advice.
• Use at Your Own Risk: Trading involves risk of loss. Users should thoroughly test and use proper risk management.
• No Guarantees: The author is not responsible for trading outcomes based on this indicator.
• License: Published under Mozilla Public License 2.0; code is open for viewing and modification under MPL terms.
________________________________________
## 11. Alerts
• The indicator defines three alert conditions:
1. Bullish Trend: when the aggregated score crosses above the Weak threshold.
2. Bearish Trend: when the score crosses below the negative Weak threshold.
3. Neutral Trend: when the score returns within ±Weak after being outside.
Good luck
– BullByte

SAFE Leverage Pro x50Safe Leverage Pro x50 — Safe leverage based on timeframes
Description:
Safe Leverage Pro x50 is an indicator designed to help traders choose prudent and realistic leverage, tailored to the timeframe being traded and the asset chosen.
Based on rigorous statistical research, this indicator provides a visual recommendation of the maximum typical leverage by timeframe and automatically suggests a more conservative value (by default, half) for trading with greater peace of mind and risk control.
* The goal is not for the indicator to make decisions for you, but rather to support your pre-defined entry strategies, allowing you to clearly understand how much leverage you can use without compromising your account against normal price fluctuations.
*The indicator does not calculate based on real-time volatility or ATR, but rather relies on statistical historical patterns obtained by analyzing price behavior after entry, differentiating between average movements in long and short entries by timeframe.
Important: Before following the recommendations of this indicator, check the maximum leverage your broker or exchange allows for the asset you are trading, as it can vary significantly between platforms.
* Philosophy behind the indicator:
This project arises as a response to the simplistic discourse that condemns leverage without distinguishing nuances.
Leverage is not intrinsically bad. What is dangerous is leveraging without method, without awareness, and without risk management.
Safe Leverage Pro x50 is designed to change that narrative:
** It's not about whether or not to use leverage, but when, how much, and how to use it intelligently.

Momentum Candle by Sekolah Trading## 🔷 Introduction
**Momentum Candle by Sekolah Trading** is a proprietary price action tool that identifies high-conviction candles with large bodies and minimal wicks, based on dynamically adjusted thresholds tailored to each pair and timeframe. This script helps traders recognize moments of price acceleration that often precede breakouts, trend continuation, or sharp reversals.
---
## 🔷 What Makes This Script Unique (Originality & Utility)
Unlike traditional candle filters that rely on static size comparisons, this indicator uses:
- **Instrument-specific pip sensitivity**: Automatically detects if the pair is XAUUSD, JPY-based, or other Forex instruments.
- **Timeframe-based calibration**: Adjusts body size thresholds dynamically for 5m, 15m, 30m, and 1h.
- **Wick ratio control**: Validates only candles with short wicks (<30%), filtering indecisive moves.
- **Non-repainting logic**: Signals appear after candle close, with no future data lookahead.
This logic has been tested and refined internally by **Sekolah Trading**, designed for scalpers and intraday traders who rely on clean price action structure.
---
## 🔷 How It Works
1. **Pair & Timeframe Detection**
Adjusts `minRange` dynamically based on:
- Gold (XAUUSD), JPY pairs, or other Forex
- Timeframe: 5m to 1h
2. **Candle Structure Analysis**
- Calculates body = `abs(open - close)`
- Wick = `upper + lower shadows`
- Valid only if wick is under 30% of total candle
3. **Conditions for Signal**
- Body ≥ minRange
- Wick ≤ 30%
- Clear bullish or bearish direction
4. **Plots**
- 🔺 Blue triangle = Bullish momentum candle
- 🔻 Red triangle = Bearish momentum candle
---
## 🔷 How to Use
1. **Add to any 5m–1h chart**, ideally on XAUUSD or major Forex pairs
2. **Wait for signal triangle** to appear at the close of a candle
3. Use with:
- Trend indicators (MA, Supertrend, etc.)
- Support/resistance zones
- Breakout levels
4. **Set alerts** using:
`Momentum Candle (Body)`
---
## 🔷 Why This Script is Closed-Source
This indicator includes proprietary logic created by **Sekolah Trading** for professional and community use:
- Original dynamic pip sensitivity calibration
- Custom multi-condition filtering
- Non-reused, non-public logic with adaptive precision
The source is protected to prevent unauthorized duplication. However, all relevant logic and intent have been clearly explained above as required by TradingView’s House Rules.
---
## 🔷 Disclaimer
This indicator does not provide financial advice or guaranteed signals. Always combine with your own analysis and risk management. Historical performance does not guarantee future results.
---
## 🔷 Suggested Tags
`momentum`, `price action`, `breakout`, `forex`, `xauusd`, `jpy`, `scalping`, `candle`, `non-repainting`, `trend confirmation`
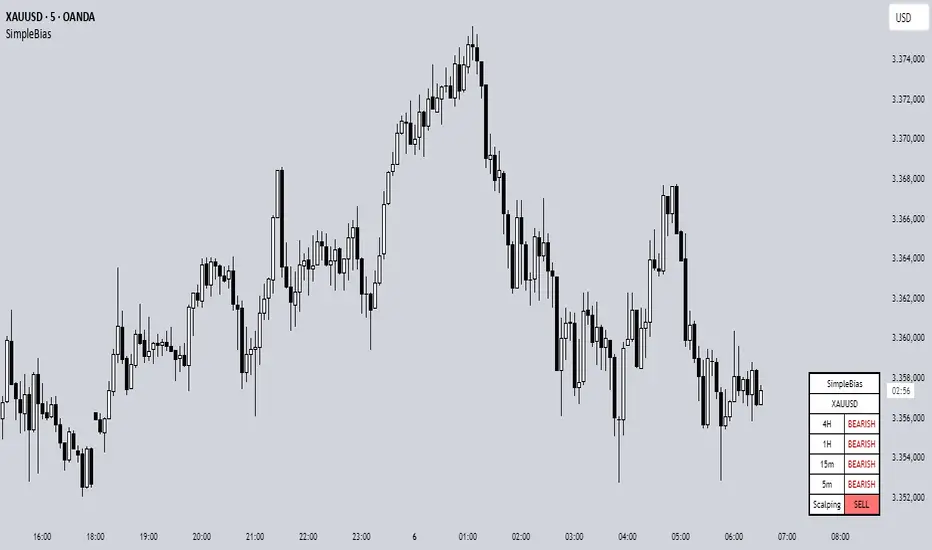
SimpleBiasSimpleBias - Multi-Timeframe Bias Analysis Indicator
Overview
SimpleBias is a comprehensive multi-timeframe bias analysis indicator designed to help traders make informed trading decisions by displaying market bias across multiple timeframes in a clean, organized table format.
Key Features
Multi-Timeframe Analysis
8 Timeframes Supported : 1M, 1W, 1D, 4H, 1H, 15m, 5m, 1m
Adaptive Display : Shows only relevant timeframes based on current chart timeframe
Real-time Bias Detection : Compares current open price with previous period's open price
Signal Generation
Day Trading Mode : Ideal for 15-minute timeframe analysis
Scalping Mode : Optimized for 5-minute timeframe trading
Signal OFF : Pure bias analysis without trade signals
Customization Options
Theme Support : Light mode and dark mode with automatic color adaptation
Position Control : Table can be positioned at top-right, middle-right, or bottom-right
Size Options : Tiny, small, or normal text size
Color Customization : Full control over bias colors, signal colors, and interface elements
Transparency : Optional transparent background for cleaner chart appearance
How It Works
Bias Calculation
The indicator determines market bias by comparing the current timeframe's open price with the previous period's open price:
BULLISH : Current open > Previous open
BEARISH : Current open < Previous open
NEUTRAL : Current open = Previous open
Adaptive Timeframe Display
The indicator intelligently shows only relevant timeframes based on your current chart:
On 1M chart: Shows 1M bias only
On 1W chart: Shows 1M, 1W bias
On 1D chart: Shows 1M, 1W, 1D bias
And so on...
Signal Logic
Day Trading : Compares current price with 4H open price
Scalping : Compares current price with 1H open price
Usage Instructions
Add to Chart : Apply the indicator to any timeframe chart
Configure Settings :
- Choose table position and text size
- Select signal mode (OFF/Day Trade/Scalping)
- Customize colors and theme
Interpret Results :
- Green/Blue text = Bullish bias
- Red text = Bearish bias
- Gray text = Neutral bias
Customization Guide
Theme Settings
Light Mode : Traditional white background with dark text
Dark Mode : Dark background with light text, optimized for dark charts
Transparent Background : Clean overlay without background color
Color Schemes
Bias Colors : Separate customization for bullish, bearish, and neutral bias
Signal Colors : Distinct colors for buy, sell, and neutral signals
Interface : Control table background and border colors
Best Practices
For Day Trading
Use 15-minute or 1-hour charts
Enable "Day Trade" signal mode
Focus on 4H and higher timeframe bias alignment
For Scalping
Use 5-minute charts
Enable "Scalping" signal mode
Watch for 1H and 4H bias alignment
For Swing Trading
Use 4H or daily charts
Keep signal mode OFF
Focus on weekly and monthly bias alignment
Important Notes
This indicator is for educational and analysis purposes only
Not financial advice - always do your own research
Past performance does not guarantee future results
Risk management is essential in all trading activities
Technical Specifications
Pine Script Version : v6
Overlay : True (displays on price chart)
Performance : Optimized with cached security requests
Compatibility : Works on all TradingView timeframes and instruments
---
SimpleBias - Indikator Analisis Bias Multi-Timeframe
Gambaran Umum
SimpleBias adalah indikator analisis bias multi-timeframe yang komprehensif, dirancang untuk membantu trader membuat keputusan trading yang tepat dengan menampilkan bias pasar di berbagai timeframe dalam format tabel yang bersih dan terorganisir.
Fitur Utama
Analisis Multi-Timeframe
8 Timeframe Didukung : 1M, 1W, 1D, 4H, 1H, 15m, 5m, 1m
Tampilan Adaptif : Hanya menampilkan timeframe yang relevan berdasarkan timeframe chart saat ini
Deteksi Bias Real-time : Membandingkan harga open saat ini dengan harga open periode sebelumnya
Mode Sinyal Trading
Mode Day Trading : Ideal untuk analisis timeframe 15 menit
Mode Scalping : Dioptimalkan untuk trading timeframe 5 menit
Mode OFF : Analisis bias murni tanpa sinyal trading
Opsi Kustomisasi
Dukungan Theme : Mode terang dan gelap dengan adaptasi warna otomatis
Kontrol Posisi : Tabel dapat diposisikan di kanan-atas, kanan-tengah, atau kanan-bawah
Opsi Ukuran : Ukuran teks kecil, sedang, atau normal
Kustomisasi Warna : Kontrol penuh atas warna bias, warna sinyal, dan elemen interface
Transparansi : Background transparan opsional untuk chart yang lebih bersih
Cara Kerja
Perhitungan Bias
Indikator menentukan bias pasar dengan membandingkan harga open timeframe saat ini dengan harga open periode sebelumnya:
BULLISH : Open saat ini > Open sebelumnya
BEARISH : Open saat ini < Open sebelumnya
NEUTRAL : Open saat ini = Open sebelumnya
Petunjuk Penggunaan
Tambahkan ke Chart : Terapkan indikator ke chart timeframe apapun
Konfigurasi Settings :
- Pilih posisi tabel dan ukuran teks
- Pilih mode sinyal (OFF/Day Trade/Scalping)
- Sesuaikan warna dan theme
Interpretasi Hasil :
- Teks hijau/biru = Bias bullish
- Teks merah = Bias bearish
- Teks abu-abu = Bias neutral
Best Practices
Untuk Day Trading
Gunakan chart 15 menit atau 1 jam
Aktifkan mode sinyal "Day Trade"
Fokus pada alignment bias timeframe 4H ke atas
Untuk Scalping
Gunakan chart 5 menit
Aktifkan mode sinyal "Scalping"
Perhatikan alignment bias 1H dan 4H
Catatan Penting
Indikator ini hanya untuk tujuan edukasi dan analisis
Bukan nasihat keuangan - selalu lakukan riset sendiri
Performa masa lalu tidak menjamin hasil masa depan
Manajemen risiko sangat penting dalam semua aktivitas trading
SimpleBias membantu trader mempertahankan kesadaran terhadap bias pasar di berbagai timeframe, mendukung timing dan pengambilan keputusan yang lebih baik dalam strategi trading mereka.
CHN BUY SELL with EMA 200Overview
This indicator combines RSI 7 momentum signals with EMA 200 trend filtering to generate high-probability BUY and SELL entry points. It uses colored candles to highlight key market conditions and displays clear trading signals with built-in cooldown periods to prevent signal spam.
Key Features
Colored Candles: Visual momentum indicators based on RSI 7 levels
Trend Filtering: EMA 200 confirms overall market direction
Signal Cooldown: Prevents over-trading with adjustable waiting periods
Clean Interface: Simple BUY/SELL labels without clutter
How It Works
Candle Coloring System
Yellow Candles: Appear when RSI 7 ≥ 70 (overbought momentum)
Purple Candles: Appear when RSI 7 ≤ 30 (oversold momentum)
Normal Candles: All other market conditions
Trading Signals
BUY Signal: Triggered when closing price > EMA 200 AND yellow candle appears
SELL Signal: Triggered when closing price < EMA 200 AND purple candle appears
Signal Cooldown
After a BUY or SELL signal appears, the same signal type is suppressed for a specified number of candles (default: 5) to prevent excessive signals in ranging markets.
Settings
RSI 7 Length: Period for RSI calculation (default: 7)
RSI 7 Overbought: Threshold for yellow candles (default: 70)
RSI 7 Oversold: Threshold for purple candles (default: 30)
EMA Length: Period for trend filter (default: 200)
Signal Cooldown: Candles to wait between same signal type (default: 5)
How to Use
Apply the indicator to your chart
Look for yellow or purple colored candles
For LONG entries: Wait for yellow candle above EMA 200, then enter BUY when signal appears
For SHORT entries: Wait for purple candle below EMA 200, then enter SELL when signal appears
Use appropriate risk management and position sizing
Best Practices
Works best on timeframes M15 and higher
Suitable for Forex, Gold, Crypto, and Stock markets
Consider market volatility when setting stop-loss and take-profit levels
Use in conjunction with proper risk management strategies
Technical Details
Overlay: True (plots directly on price chart)
Calculation: Based on RSI momentum and EMA trend analysis
Signal Logic: Combines momentum exhaustion with trend direction
Visual Feedback: Colored candles provide immediate market condition awareness

Ultimate Scalping Tool[BullByte]Overview
The Ultimate Scalping Tool is an open-source TradingView indicator built for scalpers and short-term traders released under the Mozilla Public License 2.0. It uses a custom Quantum Flux Candle (QFC) oscillator to combine multiple market forces into one visual signal. In plain terms, the script reads momentum, trend strength, volatility, and volume together and plots a special “candlestick” each bar (the QFC) that reflects the overall market bias. This unified view makes it easier to spot entries and exits: the tool labels signals as Strong Buy/Sell, Pullback (a brief retracement in a trend), Early Entry, or Exit Warning . It also provides color-coded alerts and a small dashboard of metrics. In practice, traders see green/red oscillator bars and symbols on the chart when conditions align, helping them scalp or trend-follow without reading multiple separate indicators.
Core Components
Quantum Flux Candle (QFC) Construction
The QFC is the heart of the indicator. Rather than using raw price, it creates a candlestick-like bar from the underlying oscillator values. Each QFC bar has an “open,” “high/low,” and “close” derived from calculated momentum and volatility inputs for that period . In effect, this turns the oscillator into intuitive candle patterns so traders can recognize momentum shifts visually. (For comparison, note that Heikin-Ashi candles “have a smoother look because take an average of the movement”. The QFC instead represents exact oscillator readings, so it reflects true momentum changes without hiding price action.) Colors of QFC bars change dynamically (e.g. green for bullish momentum, red for bearish) to highlight shifts. This is the first open-source QFC oscillator that dynamically weights four non-correlated indicators with moving thresholds, which makes it a unique indicator on its own.
Oscillator Normalization & Adaptive Weights
The script normalizes its oscillator to a fixed scale (for example, a 0–100 range much like the RSI) so that various inputs can be compared fairly. It then applies adaptive weighting: the relative influence of trend, momentum, volatility or volume signals is automatically adjusted based on current market conditions. For instance, in very volatile markets the script might weight volatility more heavily, or in a strong trend it might give extra weight to trend direction. Normalizing data and adjusting weights helps keep the QFC sensitive but stable (normalization ensures all inputs fit a common scale).
Trend/Momentum/Volume/Volatility Fusion
Unlike a typical single-factor oscillator, the QFC oscillator fuses four aspects at once. It may compute, for example, a trend indicator (such as an ADX or moving average slope), a momentum measure (like RSI or Rate-of-Change), a volume-based pressure (similar to MFI/OBV), and a volatility measure (like ATR) . These different values are combined into one composite oscillator. This “multi-dimensional” approach follows best practices of using non-correlated indicators (trend, momentum, volume, volatility) for confirmation. By encoding all these signals in one line, a high QFC reading means that trend, momentum, and volume are all aligned, whereas a neutral reading might mean mixed conditions. This gives traders a comprehensive picture of market strength.
Signal Classification
The script interprets the QFC oscillator to label trades. For example:
• Strong Buy/Sell : Triggered when the oscillator crosses a high-confidence threshold (e.g. breaks clearly above zero with strong slope), indicating a well-confirmed move. This is like seeing a big green/red QFC candle aligned with the trend.
• Pullbacks : Identified when the trend is up but momentum dips briefly. A Pullback Buy appears if the overall trend is bullish but the oscillator has a short retracement – a typical buying opportunity in an uptrend. (A pullback is “a brief decline or pause in a generally upward price trend”.)
• Early Buy/Sell : Marks an initial swing in the oscillator suggesting a possible new trend, before it is fully confirmed. It’s a hint of momentum building (an early-warning signal), not as strong as the confirmed “Strong” signal.
• Exit Warnings : Issued when momentum peaks or reverses. For instance, if the QFC bars reach a high and start turning red/green opposite, the indicator warns that the move may be ending. In other words, a Momentum Peak is the point of maximum strength after which weakness may follow.
These categories correspond to typical trading concepts: Pullback (temporary reversal in an uptrend), Early Buy (an initial bullish cross), Strong Buy (confirmed bullish momentum), and Momentum Peak (peak oscillator value suggesting exhaustion).
Filters (DI Reversal, Dynamic Thresholds, HTF EMA/ADX)
Extra filters help avoid bad trades. A DI Reversal filter uses the +DI/–DI lines (from the ADX system) to require that the trend direction confirms the signal . For example, it might ignore a buy signal if the +DI is still below –DI. Dynamic Thresholds adjust signal levels on-the-fly: rather than fixed “overbought” lines, they move with volatility so signals happen under appropriate market stress. An optional High-Timeframe EMA or ADX filter adds a check against a larger timeframe trend: for instance, only taking a trade if price is above the weekly EMA or if weekly ADX shows a strong trend. (Notably, the ADX is “a technical indicator used by traders to determine the strength of a price trend”, so requiring a high-timeframe ADX avoids trading against the bigger trend.)
Dashboard Metrics & Color Logic
The Dashboard in the Ultimate Scalping Tool (UST) serves as a centralized information hub, providing traders with real-time insights into market conditions, trend strength, momentum, volume pressure, and trade signals. It is highly customizable, allowing users to adjust its appearance and content based on their preferences.
1. Dashboard Layout & Customization
Short vs. Extended Mode : Users can toggle between a compact view (9 rows) and an extended view (13 rows) via the `Short Dashboard` input.
Text Size Options : The dashboard supports three text sizes— Tiny, Small, and Normal —adjustable via the `Dashboard Text Size` input.
Positioning : The dashboard is positioned in the top-right corner by default but can be moved if modified in the script.
2. Key Metrics Displayed
The dashboard presents critical trading metrics in a structured table format:
Trend (TF) : Indicates the current trend direction (Strong Bullish, Moderate Bullish, Sideways, Moderate Bearish, Strong Bearish) based on normalized trend strength (normTrend) .
Momentum (TF) : Displays momentum status (Strong Bullish/Bearish or Neutral) derived from the oscillator's position relative to dynamic thresholds.
Volume (CMF) : Shows buying/selling pressure levels (Very High Buying, High Selling, Neutral, etc.) based on the Chaikin Money Flow (CMF) indicator.
Basic & Advanced Signals:
Basic Signal : Provides simple trade signals (Strong Buy, Strong Sell, Pullback Buy, Pullback Sell, No Trade).
Advanced Signal : Offers nuanced signals (Early Buy/Sell, Momentum Peak, Weakening Momentum, etc.) with color-coded alerts.
RSI : Displays the Relative Strength Index (RSI) value, colored based on overbought (>70), oversold (<30), or neutral conditions.
HTF Filter : Indicates the higher timeframe trend status (Bullish, Bearish, Neutral) when using the Leading HTF Filter.
VWAP : Shows the V olume-Weighted Average Price and whether the current price is above (bullish) or below (bearish) it.
ADX : Displays the Average Directional Index (ADX) value, with color highlighting whether it is rising (green) or falling (red).
Market Mode : Shows the selected market type (Crypto, Stocks, Options, Forex, Custom).
Regime : Indicates volatility conditions (High, Low, Moderate) based on the **ATR ratio**.
3. Filters Status Panel
A secondary panel displays the status of active filters, helping traders quickly assess which conditions are influencing signals:
- DI Reversal Filter: On/Off (confirms reversals before generating signals).
- Dynamic Thresholds: On/Off (adjusts buy/sell thresholds based on volatility).
- Adaptive Weighting: On/Off (auto-adjusts oscillator weights for trend/momentum/volatility).
- Early Signal: On/Off (enables early momentum-based signals).
- Leading HTF Filter: On/Off (applies higher timeframe trend confirmation).
4. Visual Enhancements
Color-Coded Cells : Each metric is color-coded (green for bullish, red for bearish, gray for neutral) for quick interpretation.
Dynamic Background : The dashboard background adapts to market conditions (bullish/bearish/neutral) based on ADX and DI trends.
Customizable Reference Lines : Users can enable/disable fixed reference lines for the oscillator.
How It(QFC) Differs from Traditional Indicators
Quantum Flux Candle (QFC) Versus Heikin-Ashi
Heikin-Ashi candles smooth price by averaging (HA’s open/close use averages) so they show trend clearly but hide true price (the current HA bar’s close is not the real price). QFC candles are different: they are oscillator values, not price averages . A Heikin-Ashi chart “has a smoother look because it is essentially taking an average of the movement”, which can cause lag. The QFC instead shows the raw combined momentum each bar, allowing faster recognition of shifts. In short, HA is a smoothed price chart; QFC is a momentum-based chart.
Versus Standard Oscillators
Common oscillators like RSI or MACD use fixed formulas on price (or price+volume). For example, RSI “compares gains and losses and normalizes this value on a scale from 0 to 100”, reflecting pure price momentum. MFI is similar but adds volume. These indicators each show one dimension: momentum or volume. The Ultimate Scalping Tool’s QFC goes further by integrating trend strength and volatility too. In practice, this means a move that looks strong on RSI might be downplayed by low volume or weak trend in QFC. As one source notes, using multiple non-correlated indicators (trend, momentum, volume, volatility) provides a more complete market picture. The QFC’s multi-factor fusion is unique – it is effectively a multi-dimensional oscillator rather than a traditional single-input one.
Signal Style
Traditional oscillators often use crossovers (RSI crossing 50) or fixed zones (MACD above zero) for signals. The Ultimate Scalping Tool’s signals are custom-classified: it explicitly labels pullbacks, early entries, and strong moves. These terms go beyond a typical indicator’s generic “buy”/“sell.” In other words, it packages a strategy around the oscillator, which traders can backtest or observe without reading code.
Key Term Definitions
• Pullback : A short-term dip or consolidation in an uptrend. In this script, a Pullback Buy appears when price is generally rising but shows a brief retracement. (As defined by Investopedia, a pullback is “a brief decline or pause in a generally upward price trend”.)
• Early Buy/Sell : An initial or tentative entry signal. It means the oscillator first starts turning positive (or negative) before a full trend has developed. It’s an early indication that a trend might be starting.
• Strong Buy/Sell : A confident entry signal when multiple conditions align. This label is used when momentum is already strong and confirmed by trend/volume filters, offering a higher-probability trade.
• Momentum Peak : The point where bullish (or bearish) momentum reaches its maximum before weakening. When the oscillator value stops rising (or falling) and begins to reverse, the script flags it as a peak – signaling that the current move could be overextended.
What is the Flux MA?
The Flux MA (Moving Average) is an Exponential Moving Average (EMA) applied to a normalized oscillator, referred to as FM . Its purpose is to smooth out the fluctuations of the oscillator, providing a clearer picture of the underlying trend direction and strength. Think of it as a dynamic baseline that the oscillator moves above or below, helping you determine whether the market is trending bullish or bearish.
How it’s calculated (Flux MA):
1.The oscillator is normalized (scaled to a range, typically between 0 and 1, using a default scale factor of 100.0).
2.An EMA is applied to this normalized value (FM) over a user-defined period (default is 10 periods).
3.The result is rescaled back to the oscillator’s original range for plotting.
Why it matters : The Flux MA acts like a support or resistance level for the oscillator, making it easier to spot trend shifts.
Color of the Flux Candle
The Quantum Flux Candle visualizes the normalized oscillator (FM) as candlesticks, with colors that indicate specific market conditions based on the relationship between the FM and the Flux MA. Here’s what each color means:
• Green : The FM is above the Flux MA, signaling bullish momentum. This suggests the market is trending upward.
• Red : The FM is below the Flux MA, signaling bearish momentum. This suggests the market is trending downward.
• Yellow : Indicates strong buy conditions (e.g., a "Strong Buy" signal combined with a positive trend). This is a high-confidence signal to go long.
• Purple : Indicates strong sell conditions (e.g., a "Strong Sell" signal combined with a negative trend). This is a high-confidence signal to go short.
The candle mode shows the oscillator’s open, high, low, and close values for each period, similar to price candlesticks, but it’s the color that provides the quick visual cue for trading decisions.
How to Trade the Flux MA with Respect to the Candle
Trading with the Flux MA and Quantum Flux Candle involves using the MA as a trend indicator and the candle colors as entry and exit signals. Here’s a step-by-step guide:
1. Identify the Trend Direction
• Bullish Trend : The Flux Candle is green and positioned above the Flux MA. This indicates upward momentum.
• Bearish Trend : The Flux Candle is red and positioned below the Flux MA. This indicates downward momentum.
The Flux MA serves as the reference line—candles above it suggest buying pressure, while candles below it suggest selling pressure.
2. Interpret Candle Colors for Trade Signals
• Green Candle : General bullish momentum. Consider entering or holding a long position.
• Red Candle : General bearish momentum. Consider entering or holding a short position.
• Yellow Candle : A strong buy signal. This is an ideal time to enter a long trade.
• Purple Candle : A strong sell signal. This is an ideal time to enter a short trade.
3. Enter Trades Based on Crossovers and Colors
• Long Entry : Enter a buy position when the Flux Candle turns green and crosses above the Flux MA. If it turns yellow, this is an even stronger signal to go long.
• Short Entry : Enter a sell position when the Flux Candle turns red and crosses below the Flux MA. If it turns purple, this is an even stronger signal to go short.
4. Exit Trades
• Exit Long : Close your buy position when the Flux Candle turns red or crosses below the Flux MA, indicating the bullish trend may be reversing.
• Exit Short : Close your sell position when the Flux Candle turns green or crosses above the Flux MA, indicating the bearish trend may be reversing.
•You might also exit a long trade if the candle changes from yellow to green (weakening strong buy signal) or a short trade from purple to red (weakening strong sell signal).
5. Use Additional Confirmation
To avoid false signals, combine the Flux MA and candle signals with other indicators or dashboard metrics (e.g., trend strength, momentum, or volume pressure). For example:
•A yellow candle with a " Strong Bullish " trend and high buying volume is a robust long signal.
•A red candle with a " Moderate Bearish " trend and neutral momentum might need more confirmation before shorting.
Practical Example
Imagine you’re scalping a cryptocurrency:
• Long Trade : The Flux Candle turns yellow and is above the Flux MA, with the dashboard showing "Strong Buy" and high buying volume. You enter a long position. You exit when the candle turns red and dips below the Flux MA.
• Short Trade : The Flux Candle turns purple and crosses below the Flux MA, with a "Strong Sell" signal on the dashboard. You enter a short position. You exit when the candle turns green and crosses above the Flux MA.
Market Presets and Adaptation
This indicator is designed to work on any market with candlestick price data (stocks, crypto, forex, indices, etc.). To handle different behavior, it provides presets for major asset classes. Selecting a “Stocks,” “Crypto,” “Forex,” or “Options” preset automatically loads a set of parameter values optimized for that market . For example, a crypto preset might use a shorter lookback or higher sensitivity to account for crypto’s high volatility, while a stocks preset might use slightly longer smoothing since stocks often trend more slowly. In practice, this means the same core QFC logic applies across markets, but the thresholds and smoothing adjust so signals remain relevant for each asset type.
Usage Guidelines
• Recommended Timeframes : Optimized for 1 minute to 15 minute intraday charts. Can also be used on higher timeframes for short term swings.
• Market Types : Select “Crypto,” “Stocks,” “Forex,” or “Options” to auto tune periods, thresholds and weights. Use “Custom” to manually adjust all inputs.
• Interpreting Signals : Always confirm a signal by checking that trend, volume, and VWAP agree on the dashboard. A green “Strong Buy” arrow with green trend, green volume, and price > VWAP is highest probability.
• Adjusting Sensitivity : To reduce false signals in fast markets, enable DI Reversal Confirmation and Dynamic Thresholds. For more frequent entries in trending environments, enable Early Entry Trigger.
• Risk Management : This tool does not plot stop loss or take profit levels. Users should define their own risk parameters based on support/resistance or volatility bands.
Background Shading
To give you an at-a-glance sense of market regime without reading numbers, the indicator automatically tints the chart background in three modes—neutral, bullish and bearish—with two levels of intensity (light vs. dark):
Neutral (Gray)
When ADX is below 20 the market is considered “no trend” or too weak to trade. The background fills with a light gray (high transparency) so you know to sit on your hands.
Bullish (Green)
As soon as ADX rises above 20 and +DI exceeds –DI, the background turns a semi-transparent green, signaling an emerging uptrend. When ADX climbs above 30 (strong trend), the green becomes more opaque—reminding you that trend-following signals (Strong Buy, Pullback) carry extra weight.
Bearish (Red)
Similarly, if –DI exceeds +DI with ADX >20, you get a light red tint for a developing downtrend, and a darker, more solid red once ADX surpasses 30.
By dynamically varying both hue (green vs. red vs. gray) and opacity (light vs. dark), the background instantly communicates trend strength and direction—so you always know whether to favor breakout-style entries (in a strong trend) or stay flat during choppy, low-ADX conditions.
The setup shown in the above chart snapshot is BTCUSD 15 min chart : Binance for reference.
Disclaimer
No indicator guarantees profits. Backtest or paper trade this tool to understand its behavior in your market. Always use proper position sizing and stop loss orders.
Good luck!
- BullByte

ATR Volatility giua64ATR Volatility giua64 – Smart Signal + VIX Filter
📘 Script Explanation (in English)
Title: ATR Volatility giua64 – Smart Signal + VIX Filter
This script analyzes market volatility using the Average True Range (ATR) and compares it to its moving average to determine whether volatility is HIGH, MEDIUM, or LOW.
It includes:
✅ Custom or preset configurations for different asset classes (Forex, Indices, Gold, etc.).
✅ An optional external volatility index input (like the VIX) to refine directional bias.
✅ A directional signal (LONG, SHORT, FLAT) based on ATR strength, direction, and external volatility conditions.
✅ A clean visual table showing key values such as ATR, ATR average, ATR %, VIX level, current range, extended range, and final signal.
This tool is ideal for traders looking to:
Monitor the intensity of price movements
Filter trading strategies based on volatility conditions
Identify momentum acceleration or exhaustion
⚙️ Settings Guide
Here’s a breakdown of the user inputs:
🔹 ATR Settings
Setting Description
ATR Length Number of periods for ATR calculation (default: 14)
ATR Smoothing Type of moving average used (RMA, SMA, EMA, WMA)
ATR Average Length Period for the ATR moving average baseline
🔹 Asset Class Preset
Choose between:
Manual – Define your own point multiplier and thresholds
Forex (Pips) – Auto-set for FX markets (high precision)
Indices (0.1 Points) – For index instruments like DAX or S&P
Gold (USD) – Preset suitable for XAU/USD
If Manual is selected, configure:
Setting Description
Points Multiplier Multiplies raw price ranges into useful units (e.g., 10 for Gold)
Low Volatility Threshold Threshold to define "LOW" volatility
High Volatility Threshold Threshold to define "HIGH" volatility
🔹 Extended Range and VIX
Setting Description
Timeframe for Extended High/Low Used to compare larger price ranges (e.g., Daily or Weekly)
External Volatility Index (VIX) Symbol for a volatility index like "VIX" or "EUVI"
Low VIX Threshold Below this level, VIX is considered "low" (default: 20)
High VIX Threshold Above this level, VIX is considered "high" (default: 30)
🔹 Table Display
Setting Description
Table Position Where the visual table appears on the chart (e.g., bottom_center, top_left)
Show ATR Line on Chart Whether to display the ATR line directly on the chart
✅ Signal Logic Summary
The script determines the final signal based on:
ATR being above or below its average
ATR rising or falling
ATR percentage being significant (>2%)
VIX being high or low
Conditions Signal
ATR rising + high volatility + low VIX LONG
ATR falling + high volatility + high VIX SHORT
ATR flat or low volatility or low %ATR FLAT

Spreader – Real-Time Spread Detector for ScalpingSpreader is a professional tool built for scalpers and intraday traders, designed to visually display live bid-ask spread on your chart. By showing you the true market friction in real time, it helps you avoid poor entries and reduce immediate trade losses.
Apex Edge - MTF Confluence PanelApex Edge – MTF Confluence Panel
Description:
The Apex Edge – MTF Confluence Panel is a powerful multi-timeframe analysis tool built to streamline trade decision-making by aggregating key confluences across three user-defined timeframes. The panel visually presents the state of five core market signals—Trend, Momentum, Sweep, Structure, and Trap—alongside a unified Score column that summarizes directional bias with clarity.
Traders can customize the number of bullish/bearish conditions required to trigger a score signal, allowing the tool to be tailored for both conservative and aggressive trading styles. This script is designed for those who value a clean, structured, and objective approach to identifying market alignment—whether scalping or swing trading.
How it Works:
Across each of the three selected timeframes, the panel evaluates:
Trend: Based on a user-configurable Hull Moving Average (HMA), the script compares price relative to trend to determine bullish, bearish, or neutral bias.
Momentum: Uses OBV (On-Balance Volume) with volume spike detection to identify bursts of strong buying or selling pressure.
Sweep: Detects potential liquidity grabs by identifying price rejections beyond prior swing highs/lows. A break below a previous low with reversal signals bullish intent (and vice versa for bearish).
Structure: Uses dynamic pivot-based logic to identify market structure breaks (BOS) beyond recent confirmed swing levels.
Trap: Flags potential false moves by measuring RSI overbought/oversold signal clusters combined with minimal price movement—highlighting exhaustion or deceptive breaks.
Score: A weighted consensus of the above components. The number of required confluences to trigger a score (default: 3) can be set by the user via input, offering flexibility in signal sensitivity.
Why It’s Useful for Traders:
Quick Decision-Making: The color-coded panel provides instant visual feedback on whether confluences align across timeframes—ideal for fast-paced environments like scalping or high-volatility news sessions.
Multi-Timeframe Confidence: Helps eliminate guesswork by confirming whether higher and lower timeframe conditions support your trade idea.
Customizability: Adjustable confluence threshold means traders can fine-tune how sensitive the system is—more signals for faster entries, stricter confluence for higher conviction trades.
Built-In Alerts: Automated alerts for score alignment, trap detection, and liquidity sweeps allow traders to stay informed even when away from the screen.
Strategic Edge: Supports directional bias confirmation and trade filtering with logic designed to mimic professional decision-making workflows.
Features:
Clean, real-time confluence table across three user-selected timeframes
Configurable score sensitivity via “Minimum Confluences for Score” input
Cell-based colour coding for at-a-glance trade direction
Built-in alerts for score alignment, traps, and sweep triggers
Note - This Indicator works great in sync with Apex Edge - Session Sweep Pro
Useful levels for TP = previous session high/low boxes or fib levels.
⚠️ Disclaimer:
This script is for informational and educational purposes only and should not be considered financial advice. Always perform your own due diligence and practice proper risk management when trading.

Intraday Pivot Highs & Lows (Asia London NY)Intraday Pivot Highs & Lows (Asia London NY)
Script Description
This TradingView indicator is optimized for Forex, scalping, intraday, and day trading strategies. It accurately plots Pivot Points and levels, high/low, support and resistance levels. These are clearly identified to aid the trader during killzone sessions and session opens. Ideal for scalp trading, intraday sessions, and leveraging SMT (Smart Money Techniques). Utilize these Price Levels effectively during London Open, NY Open, and the Asia Session, utilizing Market Structure to pinpoint key levels and reversal zones for successful trading. Improve your Trade Setups, recognize reliable Chart Patterns, identify critical Price Pivots, and trade confidently off Institutional Levels.
This script marks the intraday pivot highs, lows and midpoints retracement levels for
Asia
London
New York
It also plots the previous day's high, low, midpoint, and 0.618 Fibonacci retracement levels, providing traders with critical price reference points for making intraday trading decisions.
Originality & Usefulness
This indicator uniquely integrates pivot calculations across three major Forex sessions (Asia, London, NY), clearly delineating session boundaries.
It enhances visibility by using distinct styling
solid for New York
dashed for London
dotted lines for Asia
And colour co-ordinated labeling, improving traders' ability to identify important intraday price action zones efficiently. Unlike standard pivot indicators, this script emphasizes session-specific trading dynamics.
### Key Features ###
Session-Based Levels: Automatically plots high, low, midpoint, and Fibonacci (.618) levels for each major session (Asia, London, NY).
Distinct Visual Cues: Lines and labels use session-specific styles and colors to easily differentiate between sessions.
Previous Day Reference: Clearly plots and labels yesterday's high, low, midpoint, and Fibonacci levels.
Flexible Visibility: Traders can set timeframe visibility to maintain clean charts on higher timeframes.
### How It Works
At the start of next day's session, previous session lines are cleared, ensuring the chart remains uncluttered.
High, low, midpoint, and Fibonacci retracement levels (.618) are dynamically calculated and displayed at the close of each session.
All session levels remain visible until the start of the next respective session, providing continuous actionable insights.
Trading Application:
Session highs and lows act as strong intraday support and resistance zones.
Midpoints and Fibonacci levels are effective for identifying potential reversal zones and retracements.
Daily levels provide a broader context, useful for gauging intraday volatility and range.
### Limitations and Considerations ##
Best used on liquid assets with clear session-based price action, such as Forex major pairs, if used on indexes make sure they contain 24 hour price action not just New York session.
This indicator is designed to streamline intraday trading by clearly marking essential pivot points and session-based levels, significantly improving traders' market context and decision-making accuracy. Can be used to enhance SMT decision making when scalping killzones.

AL Brooks - Price Action Multi-Signal Suite📘 Price Action Multi-Signal Suite📘
This indicator is a complete visual toolset for traders who use price action principles inspired by Al Brooks-style analysis.
It combines multiple nuanced signals — like first/second entries, breakout failures, trend bias, higher-timeframe context, and dynamic trend channels — into one elegant, customizable interface.
It is built with clarity, flexibility, and actionable precision in mind.
🧠 Core Concepts Behind the Tool
1. Trend Bias with EMA (20 by default)
The indicator calculates a standard EMA (default: 20) to establish trend direction bias.
When price is above EMA, we consider the market to be in a bull trend, and vice versa.
The EMA line changes color dynamically — green (bull), red (bear), gray (neutral).
🟢 Example:
If price is forming higher highs and staying above EMA with strong bull bars, the bias is bullish. In this phase, you're looking for High 1 and High 2 (H1/H2) setups.
2. First and Second Entries (H1/H2 and L1/L2)
High 1 (H1): First pullback in a bull trend after a minor new high.
High 2 (H2): A second attempt to push up after a failed H1.
Low 1 (L1) and Low 2 (L2): Mirror the above logic for bear trends.
📈 Example Trade – H2 Long:
Price breaks out above EMA.
Pulls back and forms an H1, but it fails to break out.
Second push (H2) forms a higher low, then closes strong above previous bar → BUY entry.
📉 Example Trade – L2 Short:
Market is below EMA.
A rally creates L1, fails.
L2 forms and closes below the previous bar low with a bear body → SELL entry.
3. Second Entry Logic (Simplified Swing Count)
This adds context to H2/L2 by ensuring at least two swings occurred in the same direction.
Reduces false signals in choppy markets.
Painted as colored circles (aqua = long, fuchsia = short).
4. Breakout Failure Detection
Detects false breakouts using 10-bar highs/lows:
Failed High Breakout: Price breaks a 10-bar high but closes back inside → potential reversal short.
Failed Low Breakout: Price breaks a 10-bar low but closes back inside → potential long.
🚨 Example:
Price breaks above a recent high but closes below it with a strong bear bar → look for reversal or fade setups.
5. Inside / Outside Bars
Helps recognize compression (inside bars) or volatility expansions (outside bars).
Inside bars often precede breakouts.
Outside bars may signal traps or indecision.
Use these in combination with entry logic. An H2 after an inside bar can signal a strong, clean breakout.
6. Higher Timeframe (HTF) Context
Pulls EMA and trend bias from a higher timeframe (default: 1hr).
Background color indicates HTF bias (adjustable opacity).
Green = HTF uptrend.
Red = HTF downtrend.
🧭 Usage: Trade in the direction of the HTF bias when possible. An H2 with HTF bias bullish adds confluence.
7. Trend Channels (Automatic, Visual)
Dynamically draws trend channel lines based on pivot highs/lows.
These act as support/resistance, visual guides for traps or continuation.
Trendline breakouts or touches often align with H2/L2 setups.
📏 Example:
Price touches lower channel and forms a second entry long (L2) with a strong bull bar → high-quality reversal trade.
⚙️ Customization Options
Toggle each signal component (entries, bias, bars, failures, channels).
Adjust EMA length, HTF resolution, background opacity.
Keep your chart clean and focused on the signals that matter to you.
📊 Trade Example Summary
H2 with HTF Bullish
Trade Setup: Strong bull bar after a failed H1, above EMA
Expected Move: Trend continuation upward
L2 with Channel Hit
Trade Setup: Pullback hits lower trend channel, forms L2
Expected Move: Reversal or scalp down
Failed High Breakout
Trade Setup: Price breaks above a 10-bar high, but reverses and closes inside
Expected Move: Quick fade or reversal short
Inside Bar + H2
Trade Setup: Price compresses into an inside bar, followed by a breakout with H2
Expected Move: Momentum breakout trade
Outside Bar + L2
Trade Setup: Price breaks strongly in one direction (outside bar), second push fails upward, forms L2
Expected Move: Short on weakness
Please note, this is an educational idea and representation of whatever I understood of it.
Historical performances may not be replicable in present/future.
Trade at your own responsibility.
Regards! ^^
