Top 40 High Low Strategy for SPY, 5minThis strategy is developed based on my High Low Index SPY Top 40 indicator
Notes:
- this strategy is only developed for SPY on the 5 min chart . It seems to work with QQQ as well, but it isn't optimized for it
- P/L shown is based on 10 SPY option contracts, call or put, with strike price closest to the entry SPY price and expiry of 0 to 1 day. This includes commissions (can be changed). This is only an estimate calculated using an arbitrary multiplier factor, this can be changed in the setting
- P/L is based on $5000 initial capital
- Works with both regular / extended trading session turned on/off. However, max drawdown is 1/2 with extended trading session ON
- there is still a bug that doesn't allow alert to be created due to calculation error, will update once fixed
This strategy combines signals from the following indicators to determine entry signals:
- High Low Index SPY Top 40
- MACD
- Linear Regression Slope
Entry signal is triggered when:
- High Low Index line crosses the EMA line
- MACD trending in the same direction
- Linear Regression slope is accelerating above a threshold in the same direction, indicating a strong trend
Profit target(PT) and stop loss(SL) are determined using ATR value, with 2:1 Reward to Risk ratio as default.
Exit signal may be triggered prior to PT or SL trigger when:
- High Low Index SPY Top 40 shows a reversal after overbought or oversold conditions (optional)
- Opposite entry signal is triggered
There are a number of optional settings:
- Turn on/off "option trading", P/L will be calculated using share price only without multiplication factor for trading option contracts
- # of options per trade, default to 10
- Reinvest with profit made
- Trade with trailing SL after PT hit
- Take profit early based on Top 40 overbought/oversold
- Trade 0/1 day expiry. This will signal exit by the end of the day on Mon/Wed/Fri, and only exits 1/2 of positions (if in profit) on Tues/Thurs
- Can reduce the SL level without impacting PT
- No entry between 10:05 - 10:20 (don't ask me why, but statistically it performs better)
Consider donating me some of your profit if you make $$$ hahaha~ ;)
Enjoy~~
Scalping

EDMA Scalping Strategy (Exponentially Deviating Moving Average)This strategy uses crossover of Exponentially Deviating Moving Average (MZ EDMA ) along with Exponential Moving Average for trades entry/exits. Exponentially Deviating Moving Average (MZ EDMA ) is derived from Exponential Moving Average to predict better exit in top reversal case.
EDMA Philosophy
EDMA is calculated in following steps:
In first step, Exponentially expanding moving line is calculated with same code as of EMA but with different smoothness (1 instead of 2).
In 2nd step, Exponentially contracting moving line is calculated using 1st calculated line as source input and also using same code as of EMA but with different smoothness (1 instead of 2).
In 3rd step, Hull Moving Average with 2/3 of EDMA length is calculated using final line as source input. This final HMA will be equal to Exponentially Deviating Moving Average.
EDMA Defaults
Currently default EDMA and EMA length is set to 20 period which I've found better for higher timeframes but this can be adjusted according to user's timeframe. I would soon add Multi Timeframe option in script too. Chikou filter's period is set to 25.
Additional Features
EMA Band: EMA band is shown on chart to better visualize EMA cross with EDMA .
Dynamic Coloring: Chikou Filter library is used for derivation of dynamic coloring of EDMA and its band.
Trade Confirmation with Chikou Filter: Trend filteration from Chikou filter library is used as an option to enhance trades signals accuracy.
Strategy Default Test Settings
For backtesting purpose, following settings are used:
Initial capital=10000 USD
Default quantity value = 5 % of total capital
Commission value = 0.1 %
Pyramiding isn't included.
Backtesting data never assures that the same results would occur in future and also above settings use very less of total portfolio for trades, which in a way results less maximum drawdown along with less total profit on initial capital too. For example, increasing default quantity value will definity increase maximum drawdown value. The other way is also to use fix contracts in backtesting but it all depends on users general practice. Best option is to explore backtesting results with manually modified settings on different charts, before trusting them for other uses in future.
Usage and In-Detail Backtesting
This strategy has built-in option to enable trade confirmations with Chikou filter which will reduce the total number of trades increasing profit factor.
Symmetrically Weighted Moving Average (SWMA) on input source, may risk repainting in real-time data. Better option is to run a trade on bar close or simply left this optin unchecked.
I've set Chikou filter unchecked to increase number of trades (greater than 100) on higher timeframe (12H) and this can be changed according to your precision requirement and timeframe.
Timeframes lower than 4H usually have more noise. So its better to use higher EDMA and EMA length on lower timeframes which will decrease total number of offsetting trades increasing average total number of bars within a single trade.
Original "Exponentially Deviating Moving Average (MZ EDMA )" Indicator can be found here.

iCryptoScalperHi everyone!
In this post I would like to present my personal indicator for short-term strategies on cryptocurrencies called iCryptoScalper , but let me first introduce myself:
I am a theoretical physicist with a deep passion for trading and mathematical modelling of the financial markets.
I started trading cryptocurrencies more than 4 years ago and, throughout this period, I got more and more involved in trying to describe the mechanisms governing
the price action at lower timeframes like 1, 5 and 15 minutes.
As a beginner, I started with the usual "buy and hold" strategy, the safest but also boring option. Afterthat, I tried to get more involved on speed trading
and scalping and, as it happens to all the beginners, I went through many mistakes.
At the beginning, trying to find the best scalping strategy, was a very difficult task and I barely managed to perform well, mostly because every trade were overwhelmed
by my emotional approach and the fear of missing the right entry point and/or exit point. However, thanks to these difficulties, I understood that I needed
an algorithmic procedure to improve my performances and overtake the emotional approach, with a more technical approach: a mathematical guide that precisely tells me how to behave in the best way possible to be profitable.
To achieve this goal, I put all my efforts in trying to write a consistent mathematical model able to give me all the statistical informations I needed to reach
the best performances and, of course, the best possible profits.
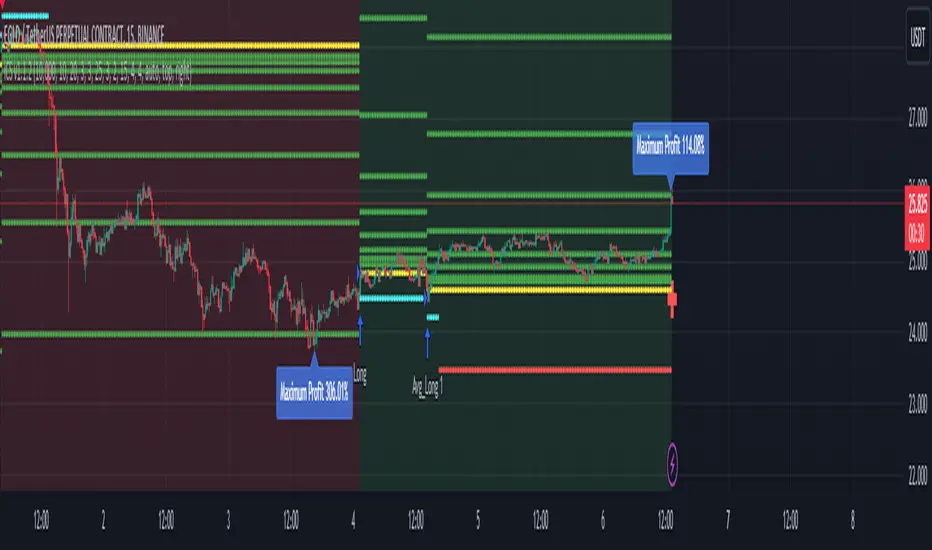
The iCryptoScalper is an explicit mathematical tool to be used for scalping strategies and optimized for different cryptocurrency pairs on 15/30 min timeframes.
The script gives you many useful informations and details regarding the current and subsequent trade, accompanied with a detailed overview on both the last 20 short
and long trade results.
Let us have a look to all the detailed informations the script shows to you:
CHART
- Lines: The script plots for you the Entry price (yellow line), the Stop Loss price (red line) and a series of 8 Take Profit levels (green lines).
- Background: The green background color indicates that the script is in a long position, viceversa, the red background color indicates that the script is in a short position.
- Labels: The blue labels indicate the maximum achieved profit for each trade.
- Alerts: The script shows two types of alerts, the "prepare to #" one and the true entry one. The prepare alert is very useful to understand when the strategy is going
to enter a specific trade, thus giving you the possibility to set up all the necessary Entry/SL/TP levels on your favorite trading platform.
- Crosses: The green and red crosses are precisely located at the corresponding long and short entry price for the next trade, thus giving you a preview on the target price
that has to be reached for the indicator to enter. They are computed thanks to a mathematical model I set up and optimized for each cryptocurrency pair.
PANEL
- Overview: This part shows you two probability tables for the last 20 long and short trades each. The first table indicates the set of probabilities of reaching the corresponding TP level, whereas the second table shows the conditional probability , namely the probability of reaching a certain profit level once the previous one has been achieved.
Below the tables you can find three quantities again referring to the last 20 long and short trades: the Average Maximum Profit , the Average Maximum Drawdown and the Average Risk/Reward Ratio .
Last but not least, the correlation between the current asset and BTC is displayed together with the current BTC status.
- Active Trade: This part collects all the data related to the current trade status.
- Next Trade: This part collects all the data related to the next trade status.
ATTENTION!
Please notice that the equity line you see in the "Strategy Tester" section of TradingView is unreliable compared to the real performances of the script. This is due to the
fact that the TradingView engine is designed for backtesting automatic trading strategies and not real-time trading bots.
An example is the following: Bob buys 1 BTC-PERP contract at 10000$, setting the Stop Loss at 9000$. The price of the perpetual then goes to 12000$ and then go back hitting the Stop Loss. For the TradingView Engine this is a
trade with a permanent loss of 1000$. However, for the iCryptoScalper users, the trade is perfectly fine thanks to the numerous TP levels (and corresponding probabilities) given by the script within the trade window.
3 Candle Strike StretegyMainly developed for AMEX:SPY trading on 1 min chart. But feel free to try on other tickers.
Basic idea of this strategy is to look for 3 candle reversal pattern within trending market structure. The 3 candle reversal pattern consist of 3 consecutive bullish or bearish candles,
followed by an engulfing candle in the opposite direction. This pattern usually signals a reversal of short term trend. This strategy also uses multiple moving averages to filter long or short
entries. ie. if the 21 smoothed moving average is above the 50, only look for long (bullish) entries, and vise versa. There is option change these moving average periods to suit your needs.
I also choose to use Linear Regression to determine whether the market is ranging or trending. It seems the 3 candle pattern is more successful under trending market. Hence I use it as a filter.
There is also an option to combine this strategy with moving average crossovers. The idea is to look for 3 candle pattern right after a fast moving average crosses over a slow moving average.
By default , 21 and 50 smoothed moving averages are used. This gives additional entry opportunities and also provides better results.
This strategy aims for 1:3 risk to reward ratio. Stop losses are calculated using the closest low or high values for long or short entries, respectively, with an offset using a percentage of
the daily ATR value. This allows some price fluctuation without being stopped out prematurely. Price target is calculated by multiplying the difference between the entry price and the stop loss
by a factor of 3. When price target is reach, this strategy will set stop loss at the price target and wait for exit condition to maximize potential profit.
This strategy will exit an order if an opposing 3 candle pattern is detected, this could happen before stop loss or price target is reached, and may also happen after price target is reached.
*Note that this strategy is designed for same day SPY option scalping. I haven't determined an easy way to calculate the # of contracts to represent the equivalent option values. Plus the option
prices varies greatly depending on which strike and expiry that may suits your trading style. Therefore, please be mindful of the net profit shown. By default, each entry is approximately equal
to buying 10 of same day or 1 day expiry call or puts at strike $1 - $2 OTM. This strategy will close all open trades at 3:45pm EST on Mon, Wed, and Fri.
**Note that this strategy also takes into account of extended market data.
***Note pyramiding is set to 2 by default, so it allows for multiple entries on the way towards price target.
Remember that market conditions are always changing. This strategy was only able to be back-tested using 1 month of data. This strategy may not work the next month. Please keep that in mind.
Also, I take no credit for any of the indicators used as part of this strategy.
Enjoy~

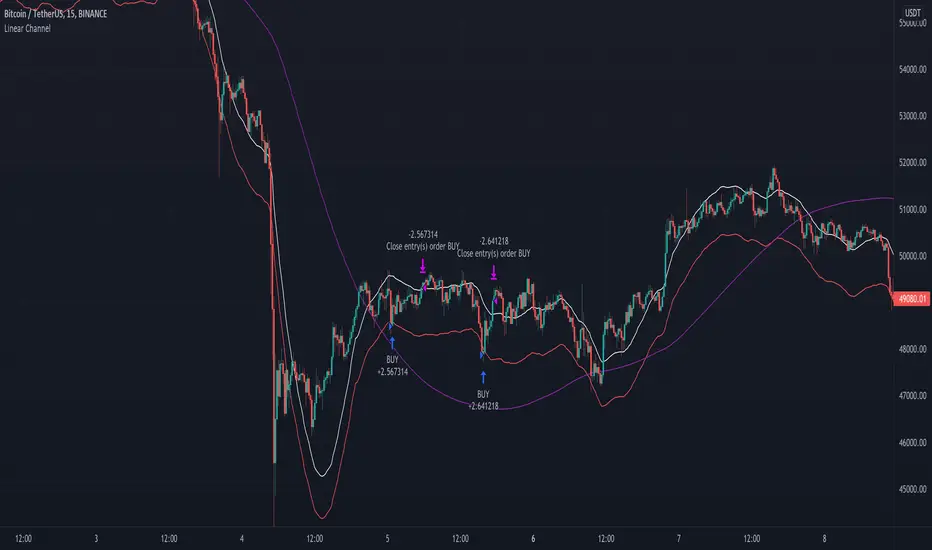
Linear Channel - Scalp Strategy 15MSimple way how to use Linear Regression for trading.
What we use:
• Linear Regression
• HMA as a trend filter
Logic:
Firstly we make simple linear regression moving. It is the white line which appears on the chart.
Then we make second line (named: band2) on the chart by multiplying linreg and value difference.
The third step is to ad HMA as a trend filter.
The trade open when price is below band2, but still upper than Hullma. The trade close when price again upper than linreg.
AlphaScalp [Backtest, No RealTime]AlphaScalp tries to find volatility moves and profits from the small pullbacks.
Even though the performance of this script in a fair amount of cases will beat HODL it is not the purpose. AlphaScalp aims for a high accuracy and profitfactor to ensure a more or less stable profit taking.
The properties like " MA Length " and the " Short - " or " Long line % " tweaks the risk by increasing or lowering the requirements for a buy (Long or Short). Close/Exit of each order is then handled by TP, SL or volatility stop.
For high volatility assets it is recommended to use the " Sell LONG on Volatility DOWN " and " Sell SHORT on Volatility UP " to ensure a TA approach for StopLoss. Normal SL is also possible to set but is not recommended on high volatility assets since you quickly can be stopped out by wicks.
AlphaScalp works best on high volatility assets with a solid liquidity and volume - but it will also work on stocks and low volatility assets.
AlphaScalp is designed for scalping and is thereby recommended to use between 5M-1H.
This version is free for your to backtest on all assets - but be aware that alerts on RealTime bars are disabled - meaning you can add alerts but they will not trigger in real time. To ensure you have the latest backtesting results, you need to have the script added to your chart, save your chart and the refresh the page.
Enjoy and please let me know if you have any questions

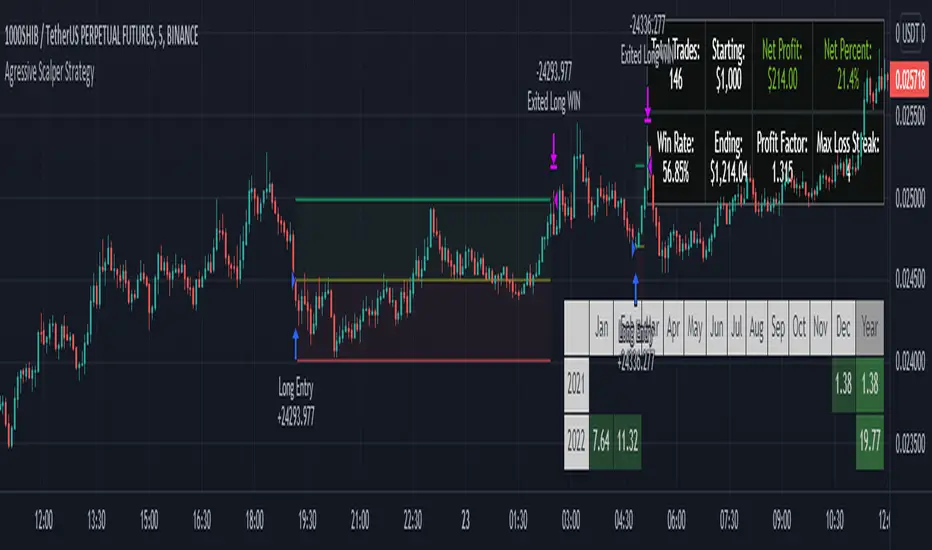
Agressive Scalper StrategyAfter many different tests and tries we found a strategy which is suited for people that likes to trade in shorter time frames. It uses multiple indications for entries. Entries include indications like Double ATR, Consolidation Detection, Dynamic RSI Calculation with Overbought and Oversold lines and also previous bars highs and lows. Although this strategy has been coded and tested on short time frames, after many additions it turns out it can be very profitable in every time frame if you play with the settings. Also it has some helpers for people that likes to optimize and see how their choices affects the outcome.
The strategy calculates the entry with the rules below:
LONG ENTRY RULES
- Price must be in consolidation zone
- Fast ATR Must be higher than Slow ATR
- Dynamic RSI must be below the oversold line (Green Line as Default)
- The Signal lookback must allow entry. (For example if you set signal lookback to 5, if the LOW of current price is LOWEST point of last 5 bars it is okay to enter LONG) If you check the lookback helper it will show you as green arrow at the bottom.
SHORT ENTRY RULES
- Price must be in consolidation zone
- Fast ATR Must be higher than Slow ATR
- Dynamic RSI must be above the overbought line (Red Line as Default)
- The Signal lookback must allow entry. (For example if you set signal lookback to 5, if the HIGHEST of current price is HIGHEST point of last 5 bars it is okay to enter SHORT) If you check the lookback helper it will show you as red arrow at the top.
This strategy has additional settings that are not available in indicator version that is previously released so i suggest everyone to use this instead.
Happy trading everyone!
Premium ScalperThe strategy works with a combination of a number of different factors, including:
- Volume
- Moving averages
- Volatility
- RSI
This strategy generates long and short signals based on volume movements, moving averages and RSI. By combining other algorithms, low volatility periods can be filtered out.
The best results can be achieved by pairing the indicator with a bot through 3Commas and using a diversification strategy. This way you spread your risk over different pairs and you therefore also have a great chance of taking big moves.
The strategy results we display are results WITHOUT leverage. It is therefore also possible to only long on spot with this strategy, but for optimal results a trading bot link is required.
The settings we have used for these results are an order size of 100% with a 0.08% commission size.
Side note: This indicator does NOT use repainting!
We offer the possibility to try the indicator for free for 7 days.

5min MACD scalp by JoelThis strategy is inspired by a youtuber called Joel on Crypto. He trades this using Ema, MACD indicators and his own experience. For more information, check out his Best Crypto Scalping Strategy for the 5 Min Time Frame video. I have tried to automate this a little.
Long or Short trades are determined with a crossing of the fast Ema over the slow Ema for Long and the opposite for Short. Trades should only happen close to the crossovers. Then for Long we use the MACD indicator with a 1min TF (I had better results using the 5min) where we look for high peaks in negative values for Long and vice versa for Shorts. These should be significantly higher than other peaks (or if you will lower peaks for a Long).
Hence, the key is to detect high peaks on the histogram, which I try to achieve by checking if the last 2 values were higher than X bars back. If you want to make it even more specific, then you can turn on the additional checkbox which compares the current value to the average value of X bars back, and if it is greater than, say, 50% the value of the average (= 1.5x the average), then it's ok for the trade.
I also noticed that the strategy often bought at the top or bottom, so I added a check that compares whether the last evaluated bar is the first rising bar (for Long) or falling bar (for Short). This can be turned on or off.
Target profit 0,5% and stop loss 0,4% are based on his recommendation. The strategy is set to take only 1 trade at a time , and you can have a back tester table on.
I'm still a pine script beginner, so the strategy is certainly not perfect and could be improved. If you have any tips on how to improve it further, please let me know. I will try to update it when I have time.
I would also like to thank Joel on Crypto for sharing the strategy and @ZenAndTheArtOfTrading for his great library and code (thanks to him we have a back tester table in here), but especially his educational videos on youtube, which taught me a lot about pine script.
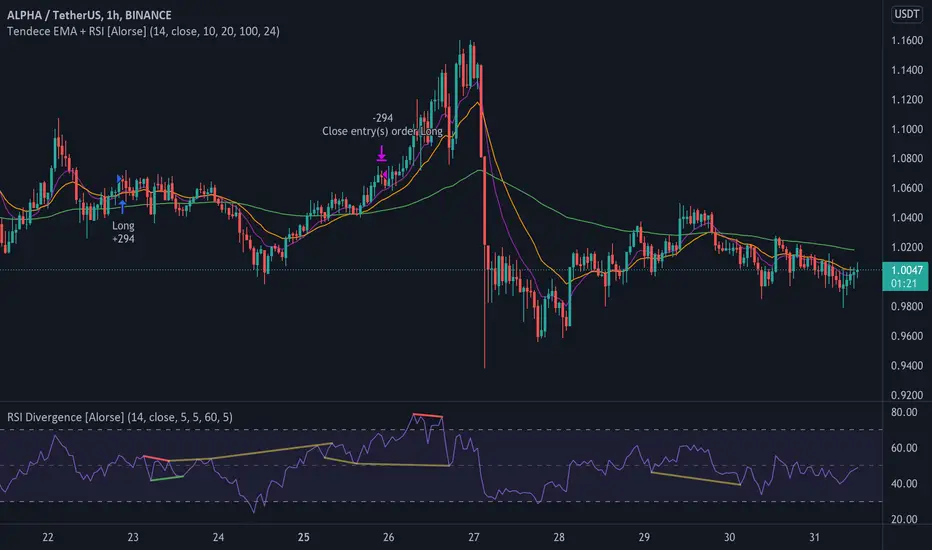
Tendency EMA + RSI [Alorse]A very simple and highly effective strategy LONG & SHORT that combines only 2 indicators:
RSI
3 Moving Average Exponential (EMA)
LONG Entry conditions are:
EMA 20 cross over EMA 10
EMA 10 is above EMA 100
LONG Exit conditions are:
RSI greater than 70
Or when X number of candles have passed and the trade is in profit. (Check Settings)
SHORT Entry conditions are:
EMA 20 cross under EMA 10
EMA 10 is below EMA 100
SHORT Exit conditions are:
RSI is less than 30
Or when X number of candles have passed and the trade is in profit. (Check Settings)
TripleEMA + StochasticRSI + ATR Scalping Strategy by TradeSmartCOINBASE:BTCUSD Hello everyone and welcome to our second script release!
This script is one of many upcoming scripts. This one is a test for us, how it works, how you guys like this kind of stuff, and for feedback what we should change/improve at.
So feel free to comment any suggestions you have.
SCRIPT IS OPTIMIZED FOR:
BTC/USD (Coinbase) 15 minute timeframe
(Keep in mind default settings does not include trading fees, you can set it at the properties)
I recommend using this script on a trading exchange where the fees are extremely low or on an exchange where you get paid to place limit orders.
(I am not a financial avdvisor and none of this is financial advice.)
Now you can modify the following:
Stochastic RSI
3 different EMA
Length of ATR (for stop loss and take profit)
Stop Loss and Take Profit Risk to Reward ratio
Choice between Capital Risk on each trade or Risk of % of Capital
Allowing Short/Long entries only
Limit between dates
Trading days 1-7
We will update the script with more and more features taking in consideration your requests.
Hope you like it! Don't forget to let us know what we should change or improve. Thanks, and have a great day!
STRATEGY ENTRY RULES
LONG
When EMAs are lining up (meaning for ex. 400 < 13 < 7), and the Stochastic RSI crosses upwards (meaning blue line crosses orange upwards), then go long.
SHORT
When EMAs are lining down (meaning for ex. 7 < 13 < 400), and the Stochastic RSI crosses downwards (meaning blue line crosses orange downwards), then go short.
TAKE PROFIT
When price hits the exit price (calculated from stop loss with the risk ratio)
STOP LOSS
When price hits stop loss then exit the position.
QUANTITY TO BUY (Risk per Trade % or Capital %)
Risk Per Trade % attribute: we can set how much money we want to risk on one trade. Meaning that if we lose that particular position, then a Risk Per Trade % value of our equity will be lost.
Example: if you set the Risk Per Trade % to 1 % and you have a 100$ account balance, then if you loose the trade you will loose 1$ max.
Capital % we can set with how big % of our capital we want to enter into a position. Meaning that we enter with a set % of our capital.
Example: if you set the Capital % to 1 % and you have a 100$ account balance, then you will enter the position with 1$.
First Release Settings: (2021-10-25) for BTC/USD (Coinbase) 15 minute timeframe
Stochastic RSI settings: (Not displayed in the script. If you want to see it you have to add it separately.)
K: 3
D: 2
RSI Length: 6
Stochastic Length: 16
RSI Source: hlc3
EMA 1: 5
Source One: Close
EMA 2: 12
Source Two: Close
EMA 3: 215
Source Three: Close
Length of ATR: 16
Stop Loss Multiplier (risk): 3.6
Exit Price Multiplier (reward): 1
Risk Percentage: 3
Allow Long Entries: yes
Allow Short Entries: yes
Valid Trading Days: 1234567
The valid trading days of the Limit Trading Time feature. Numbers represent the days: Sunday (1), Monday (2), Tuesday (3), …, Saturday (7)
If you like this one, follow for more scripts! Thank you for your support!

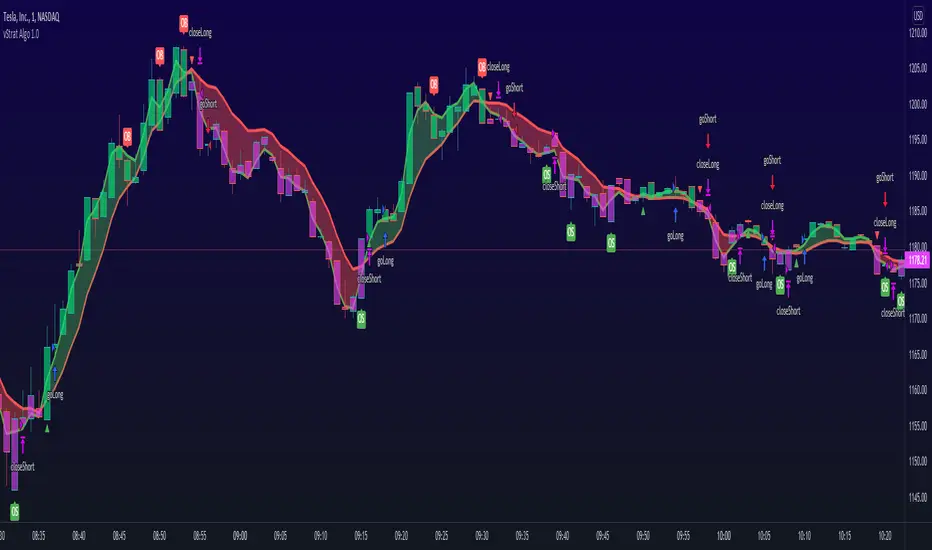
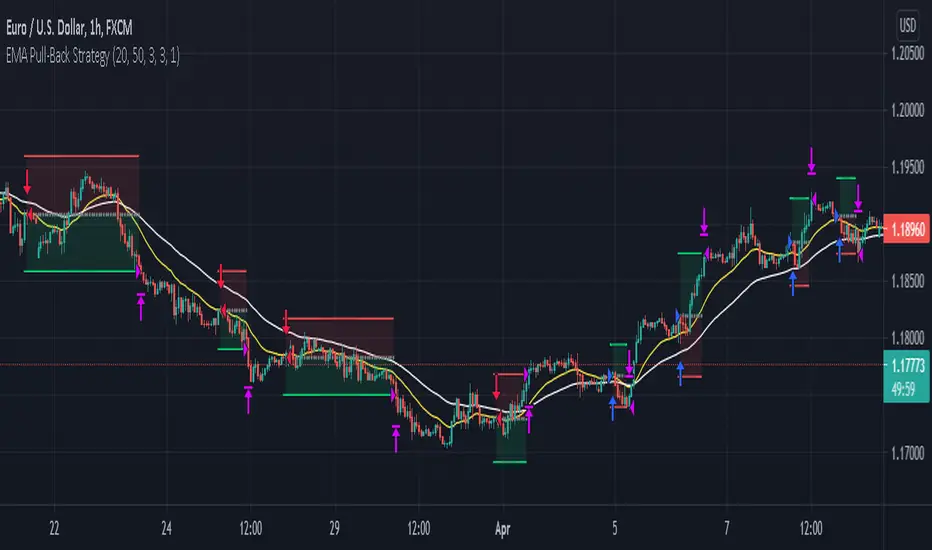
vStrat Algo 1.0 (BETA)vStrat Algo 1.0
The Very First Scalping/Intraday Trading Algo for Options
Note: If you have any favorite indicators that you use regularly and are helpful, feel free to use them in conjunction to this strategy.
Legend:
long = buy call
short = buy put
close entry = sell call/put
BULL = bullish engulfing
BEAR = bearish engulfing
OS = oversold
OB = overbought
Instructions:
1. You can choose to watch the 3 minute or 5 minute chart but be aware of the Pro’s and Con’s. It’s not recommended to use this strategy on the 1 minute chart, but this works on higher timeframes. Keep in mind that the signals will vary on each timeframe.
3 minute 5 minute
i.ibb.co i.ibb.co
2. It’s best to use this strategy right at market open. If a “long” (buy CALLS) or “short” (buy PUTS) signal was given at pre-market, I do not recommend taking it. Only take signals once the market opens. If you really wish to take the signal that was given 1-5 minutes before the market opened, you most definitely can, but its’s just riskier. What I would do is, wait 3-10 minutes after market open and if one Moving Average is respecting the other and holding above or below it, you can enter especially if the blow is bullish, the vStrat Algo 1.0 will also tell you if the candles are bearish or bullish. Use your best judgement.
i.ibb.co [
3. You do not have to wait for the exit signal, everyone's risk management is different so take profits whenever you're green or hold as long as the short-term MA is still trending above or below the long-term MA and is not touching or bouncing off it.
i.ibb.co
4. Avoid taking any signals from 11:30 AM ET - 2:30 PM ET, when stocks are trading sideways since the algo’s stop losses get triggered here due to the low volume.
i.ibb.co
5. Lastly, there is no magic indicator or strategy, this algorithm is designed based on multiple conditions. Each signal gets triggered when ALL the conditions are met. This strategy is based off advanced moving averages, one that reduces lag and responds quicker than the simple and exponential ones, RSI value, S/R, pivot points, and a few others. I’m always looking for ways to improve this scalping algorithm so rest assured any complaints or suggestions will be taken and fixed as timely as possible. For best results, avoid trading with your emotions. If you’re a new user, open a small position, set a stop loss, and let the algorithm decide how you will trade it for that day. Keep doing this until you get more familiar with the script then slowly increase your position sizing, but do not invest money you can’t afford to lose. Play with the settings, change the lengths if you wish, but the script was created to provide the most accurate signals as it is. If you do decide to change these inputs, the signals will also be different. Take profits whenever you see fit, the goal is to have a green day and grow your account slowly but surely. If you make a profit, do not risk giving your money back to the market by overtrading. Always do your own due diligence and use your best judgement. Good luck, Traders!
DISCLAIMER : All information found here, including any ideas, opinions, views, predictions, forecasts, commentaries, suggestions, or stock picks, expressed, or implied herein, are for informational, entertainment or educational purposes only and should not be construed as personal investment advice. While the information provided is believed to be accurate, it may include errors or inaccuracies. Conduct your own due diligence or consult a licensed financial advisor or broker before making any and all investment decisions. Any investments, trades, speculations, or decisions made on the basis of any information found on this site, expressed, or implied herein, are committed at your own risk, financial or otherwise.
Algo Trading Strategy (Nifty & BankNifty)What is Algo Trading Strategy ( Nifty & Bank Nifty )?
There are many 9 to 5 working professionals who have some spare money to invest each month but they can not do active trading because they are busy with their full time job.
So they wish to have an automated system which could take and close trades for them with a proven back-tested strategy, proper money management, ability to trade within particular timings, pre-defined maximum loss they can bear and so on.
To cater needs of such type of traders, we created from scratch; and published an 'AutoTrading Algo (Nifty & Bank Nifty) in Sep 2021. (The link is given below, please read on).
Many people who want to try this AutoTrading Algo want us to share stats of this algo with them.
In order to fulfil this demand, we have converted that "Algo Trading" Study into a Strategy whose description you are reading right now.
For all other queries related to how our "Algo Trading (Nifty & Bank Nifty)" works, what are its limitations, benefits and other features, please read the description of our main 'Algo Trading (Bank Nifty & Nifty )' study which is available at following link:
Note:
1. in order to test this strategy on longer time period, you must have a Premium TradingView account.
2. If you have premium TradingView account, the stats you generate will exactly match with our stats which we keep sharing in our channel.
3. To Enable Auto-Trading, You will need to connect this Algo with your broker's trading platform through 3rd party platforms. We will guide you on how to do this, when you contact us.

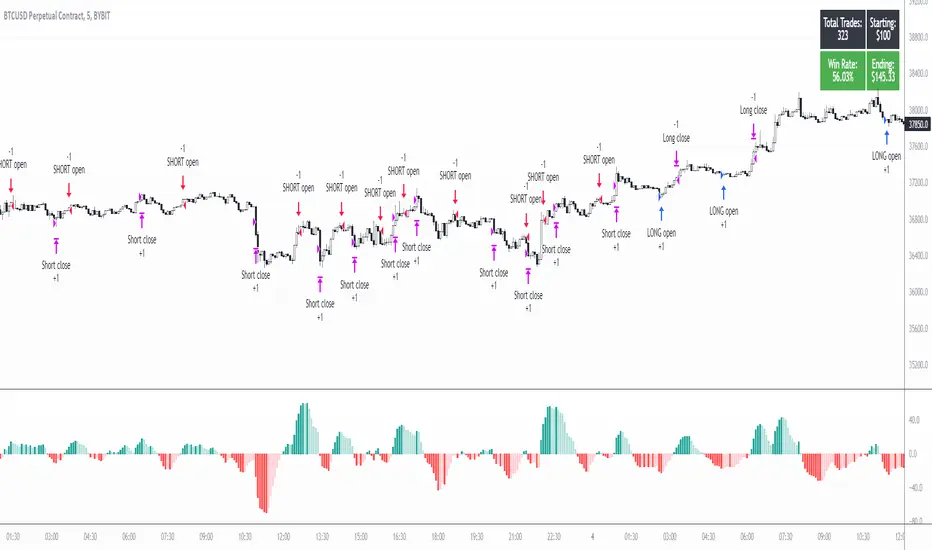
Price Change Scalping Strategy v1.0 - 3Commas EditionIntroduction
This strategy implements the Price Change Scalping (PCS) strategy specifically for the 3Commas platform. The Input settings have been redesigned to match the same inputs as the 3Commas My Bot Settings page. Only the "Deal Start Condition" section will echo the required PCS-related settings found in the original Price Change Scalping Strategy v1.0 to successfully implement the strategy.
The strategy uses a price rate of change (ROC) momentum calculation to determine the percent change in price between a defined range of bars. The calculated ROC value is then compared to the Upper Threshold and Lower Threshold values to determine if a trade setup is to be activated. If the threshold is crossed, a trade setup will occur based on the indicator settings. Entry, Take Profit, and Stop Loss prices are calculated and displayed on the chart. Once the Entry Price is crossed, a long or short position is created (depending on the direction) and once the Take Profit price is crossed, the position is closed. If the Entry Price is not crossed within a specific number of bars, the trade setup is canceled, and it will proceed to monitor price changes for the next set up.
How is it original and useful?
This strategy is unique in that the strategy version fully supports the TradingView backtester, which will enable you to perform experiments with various settings to evaluate performance using the historical chart data. The study version implements the "Start Deal" and "Close Deal" alerts for you to integrate with 3Comma's "Trading View Custom Signal" start condition. Both script versions will provide the same configuration abilities. The following list is a brief description of its usefulness:
Full support for all possible 3Commas bot settings.
Define a short or long trading strategy.
Price change data source and offset settings.
Your layering placement relative to the entry price.
Your trading parameters like take profit and stop loss offsets, trailing take profit support, exchange commission rates, trading start time, and order size multiplication for each layer.
Flexible trade eligibility rules that can use other chart indicators, like RSI or EMA, to exclude the selection of entry prices for trading.
The visibility of detailed statistics from the chart history pertaining to trading sessions started and closed, session durations, win rate, price action drops and bounces, as well as layer utilization.
The visibility of detailed Used Amount for Each Step table that details how each layer will be allocated for trading.
How does it compare to other scripts in the Public Library?
The strategy offers a very detailed, comprehensive settings to address all types of markets found on TradingView where you can implement the price change scalping strategy. The strategy version can be considered the first of its kind on TradingView to leverage the backtester to provide informative, detailed performance measurements surrounding this unique trading strategy. The study version will implement the latest alert framework called "Any Alert() Function" where you can create a single alert to handle multiple events, which include:
Deal Start
Deal Close
Strategy Results
The default settings are designed to define a "loose" price change settings to ensure that the indicator will render chart elements when first loaded as well as to allow the backtester to gather order executions and display performance summary. The strategy version is using $10,000 initial capital, a commission rate of 0.1% for both entries and exits, and a 1 tick slippage setting. It is also using 3.4881% of the equity for the Base Order Size, 4.7097% of equity for the first Safety Order Size. The Maximum Safety Trade Count is 7 with a Safety Order Volume Scale of 1.33, and a take profit of 2% with no stop loss. All other settings are defaults.
It is recommended that the indicator be "tuned" for your specific market to best implement the price change strategy and obtain better desirable results. You do so by scrolling through the chart's history and observing moments when prices tend to move rapidly. Measure the number or bars it typically takes for the price to change at a specific rate. Using this information, you can adjust the Price Change Settings accordingly to configure the indicator for the chart.
Always keep in mind that past performance may not be indicative of future results. Settings that seem favorable for one market may be found to be disastrous in another. Therefore, do take the time needed to understand how the settings will behave with the given chart symbol.
Enjoy! 😊👍
How to obtain access to the script?
You have two choices:
Use the "Website" link below to obtain access to this indicator, or
Send us a private message (PM) in TradingView itself.

Price Change Scalping Strategy v1.0Introduction
This strategy uses a price rate of change (ROC) momentum calculation to determine the percent change in price between a defined range of bars. The calculated ROC value is then compared to the Upper Threshold and Lower Threshold values to determine if a trade setup is to be activated. If the threshold is crossed, a trade setup will occur based on the indicator settings. Entry, Take Profit, and Stop Loss prices are calculated and displayed on the chart. Once the Entry Price is crossed, a long or short position is created (depending on the direction) and once the Take Profit price is crossed, the position is closed. If the Entry Price is not crossed within a specific number of bars, the trade setup is canceled, and it will proceed to monitor price changes for the next set up.
How is it original and useful?
This strategy is unique in that the strategy version fully supports the TradingView backtester, which will enable you to perform experiments with various settings to evaluate performance using the historical chart data. The study version implements numerous custom alerts for you to build TradingView notifications around specific price action events and stay informed with market activity in real-time. Both script versions will provide the same configuration abilities where you can define:
Define a short or long trading strategy.
Price change data source and offset settings.
Your layering placement relative to the entry price.
Your trading parameters like take profit and stop loss offsets, exchange commission rates, trading start time, and order size multiplication for each layer.
Flexible trade eligibility rules that can use other chart indicators, like RSI or EMA, to exclude the selection of entry prices for trading.
The visibility of detailed statistics from the chart history pertaining to trading sessions started and closed, session durations, win rate, price action drops and bounces, as well as layer utilization.
How does it compare to other scripts in the Public Library?
The strategy offers a very detailed, comprehensive settings to address all types of markets found on TradingView where you can implement the price change scalping strategy. The strategy version can be considered the first of its kind on TradingView to leverage the backtester to provide informative, detailed performance measurements surrounding this unique trading strategy. The study version will contain numerous custom alerts to aid in your notification preferences and stay informed on the indicator's activities:
Price Crossed Above Threshold
Price Crossed Below Threshold
Enter Long Position
Exit Long Position
Enter Short Position
Exit Short Position
Price Crossed DCA Layer 1 (Long)
Price Crossed DCA Layer 2 (Long)
Price Crossed DCA Layer 3 (Long)
Price Crossed DCA Layer 4 (Long)
Price Crossed DCA Layer 5 (Long)
Price Crossed DCA Layer 6 (Long)
Price Crossed DCA Layer 7 (Long)
Price Crossed DCA Layer 8 (Long)
Price Crossed DCA Layer 1 (Short)
Price Crossed DCA Layer 2 (Short)
Price Crossed DCA Layer 3 (Short)
Price Crossed DCA Layer 4 (Short)
Price Crossed DCA Layer 5 (Short)
Price Crossed DCA Layer 6 (Short)
Price Crossed DCA Layer 7 (Short)
Price Crossed DCA Layer 8 (Short)
Strategy Results
The default settings are designed to define a "loose" price change settings to ensure that the indicator will render chart elements when first loaded as well as to allow the backtester to gather order executions and display performance summary. The strategy version is using $10,000 initial capital, a commission rate of 0.1% for both entries and exits, and a 1 tick slippage setting. It is also using 2.74506% of the equity with a Order Size Multiplier of 1.33, using 8 total DCA layers, and a take profit of 2% with no stop loss. All other settings are defaults.
It is recommended that the indicator be "tuned" for your specific market in order to best implement the price change strategy and obtain better desirable results. You do so by scrolling through the chart's history and observing moments when prices tend to move rapidly. Measure the number or bars it typcially takes for the price to change at a specific rate. Using this information, you can adjust the Price Change Settings accordingly to configure the indicator for the chart.
Always keep in mind that past performance may not be indicative of future results. Settings that seem favorable for one market may be found to be disastrous in another. Therefore, do take the time needed to understand how the settings will behave with the given chart symbol.
Enjoy! 😊👍
How to obtain access to the script?
You have two choices:
Use the "Website" link below to obtain access to this indicator, or
Send us a private message (PM) in TradingView itself.

CRYPTO TRADING BOT - 1min SCALPING LONG/SHORTHOW IT WORKS
The core concept behind the script is the determination of the current market mood in sense of creating a trendline indicator using EMA / SMA .
By using this trend indication alongside RSI / MACD value range, we are able to enter/exit the market in both directions: LONG and SHORT .
In case of confirmed false signals, we try to catch up the next good opportunity to minimise loss and to close the current trade.
If the chance for a good countertrade is given at this point, the market is going to be entered reversely.
Should the market move incredibly fast against our trade direction, we use proven Stop-loss targets, to bring our children into safety.
As many others, we could tell you now, that we used state-of-the-art machine learning algorithms
as well as highly sophisticated methods to gain our results.
As a fact, we started with an idea, using simple and common trading tools/indicators,
as a solid ground. We did not want to reinvent the wheel and it paid off.
GET A WORKING SCRIPT
The algorithm we are using has initially been created with a self-developed backtesting software.
To be able to deliver gas to our engine, we have bought a huge amount of OHLCV data for the 1min chart.
After many exhausting and frustrating weeks of our workflow-rotation (develop, fail, fix, test, repeat)
we finally got confirmation for all of our conditions/expectations, so we translated our algorithm into pine-code.
THE RESULTS
Since we have been using our Pine-Strategy alongside our backtesting software , we checked all the results provided by TradingView
and our tool to be 100% sure every outcome, every entry and every exit is exactly the same.
We did this for several months and since 2021 June we have been using it with real Alerts, coped to our binance account.
Below, you will find how the performance for the previous months looked like (every trade was made with 100% of the capital, of course using proper stop loss and take profit):
September 2020: 15.18%
October 2020: 36.17%
November 2020: 15.12%
December 2020: 48.58%
January 2021: 150.10%
February 2021: 45.96%
March 2021: 46.48%
April 2021: 4.96%
May 2021: 43.48%
June 2021: -28.99%
Juli 2021: 15.63%
August 2021 (so far): 11.57%
Accumulated Profit: 1,979.01%
To prove our results, we will link an excel sheet for every trade that was made within this timerange.
Link: docs.google.com
ABOUT US
We are two good friends, both incredibly interested in mathematics, software engineering, AI and algorithmics. After getting introduced into the crypto space
by a common friend, we started figuring out that there is a pattern behind every big or small move which happens in an asset.
This is where the passion for creating a CRYPTO TRADING BOT began. It was our goal, to create this script for the 1min Timeframe, so the software can react quickly when a
big or small move is happening - this is why it is called a SCALPING SCRIPT .
We are incredibly proud of this script and would like to share it with this amazing community - just hit us up on TradingView!

Swing/Scalper HULL + T3 avg Crypto StrategyThis is a both a swing and a scalper strategy(depends on the timeframe that you use), that works with all timeframes, however I noticed that with swing 3h works the best on most crypto pairs, such as ETH, BTC and so on.
Its main components are:
Hull moving average
T3 moving average
Risk management
With them I make an average and use it as the main moving average.
Rules for entry
For long: Average moving average is bigger than previous average moving average value.
For short:Average moving average is lower than previous average moving average value.
Rules for exit
We exit when either the TP/SL has been hit, or when we get a different condition than previous one(both for long and short).
If you have any questions, let me know !

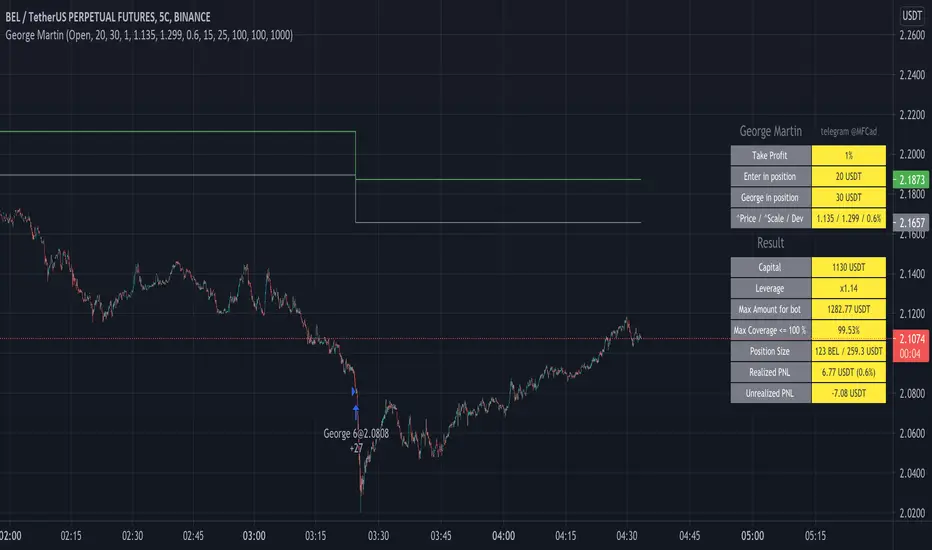
George MartinENG:
This script is based on a simple principle - MartinGale. Each subsequent entry, if the price goes in the wrong direction, increases the number of contracts taking into account the coefficient and also changes the entry price taking into account the coefficient. The coefficients can be configured so that the script keeps the drawdown up to 85%. For instructions and connection - write.
RUS:
Этот скрипт основан на простом принципе - Мартин Гейл. Каждый следующий вход если цена идет не в нужную сторону, увеличивает количество контрактов с учетом коэффициента и также меняется цена входа с учетом коэффициента. Коэффициенты можно настроить таким образом чтобы скрипт держал просадку до 85%. Для инструкций и подключения - пишите.
Scalp - 50/200 EMAWorks on any timeframe but was built originally for scalping. Uses 50EMA and 200EMA to define the trend and touch backs on to the 50 EMA for entry.
200 EMA - White Line
50 EMA - Yellow Line
ATR: Length 14 Smoothing RMA
1. Wait for 50ema to crossover 200 ema – Then wait for candle to touch 50 ema after the cross.
2. Entry: Green candle that closes above 50 ema without getting more than 3 candles closing below(BUY) or above (SELL) 50ema.
3. Stop loss: 2x ATR value below entry candle.
4. Take profit: 1.5x the risk.
Settings allow for # of Entries allowed per trend as well as EMA periods.
Opposite for Sell Entries (Stop Loss: 2x ATR value above entry candle)
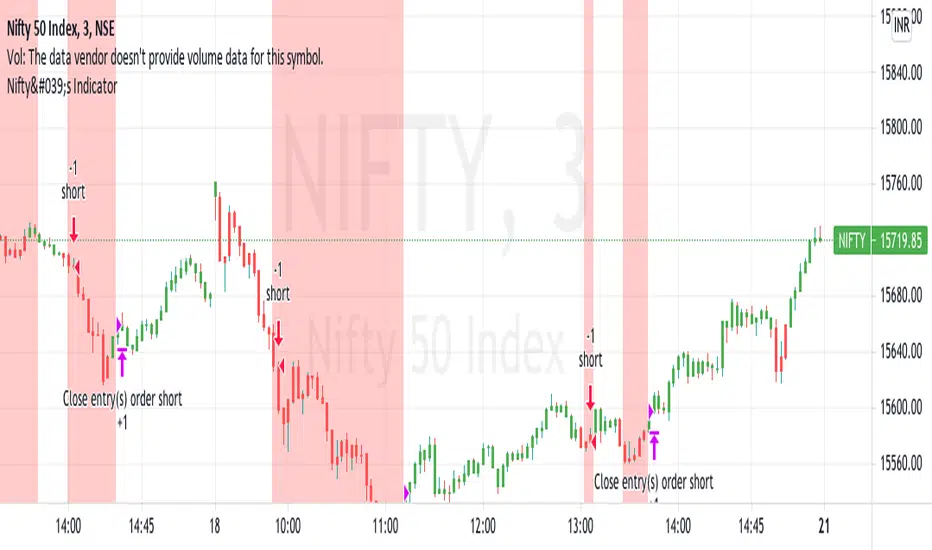
Nifty's IndicatorThis Indicator is only for Indian market and works only on 'Nifty' and 'Banknifty'. Please don't use it in any other stock/indices.
Use it in only in 3m and 1m timeframe. No other timeframe is to be used.
This indicator gives only sell signals on intraday basis.
When you apply this indicator on charts then you will see 2 things ploted there.
1. Barcolor
2. Background color
Barcolor :
We have use unique trend analysing tool in this indicator, which identifies price is in Uptrend or Downtrend. If price is in uptrend
then candle color will become GREEN and it will remain green until price comes in downtrend. In downtrend candle color becomes RED.
Background color :
We have observed that price behaves a certain way when it is in downtrend. So we try to catch that behaviour of Nifty and Banknifty .
And when ever we observe that behaviour, a red color background is formed in background. This red color background indicates user that
price may fall now.
HOW TO USE :
ENTRY => You should trade only on 3m timeframe. When you see a RED COLOR candle inside RED ZONE then take a SELL trade. That means red background
is indicating that price may fall and red color bar also indicating the same. And your entry should be in between 09:15-10:30 and 12:30-14:55.
This is the time slot when price is volatile.
EXIT => You exit when red zone ends or the trading day ends.
BACKTESTING :
Based on these entry and exit conditions , we have backtested this strategy ( taking only 1 share when sell signal comes ). You can see down arrow on
chart when sell signals comes and uparrow when we exit from trade.
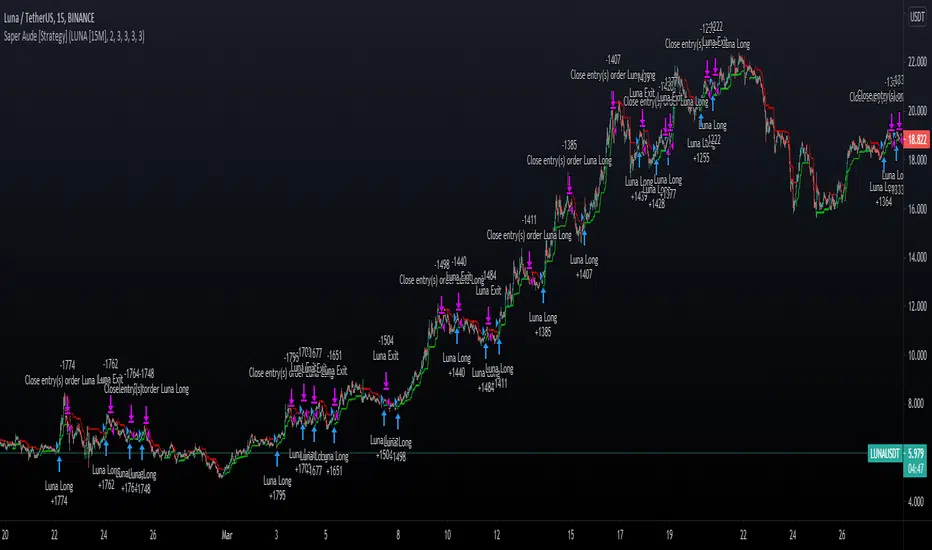
Saper Aude [Strategy]Sapere Aude Strategy
Trend based scalping strategy, to work on lower timeframes (15Minute - 1 Hour)
Calculations on ATR, strategy uses extra conditions to help filter out bad trades.
How to use the strategy?
Simple as when green line shows below, that can be either a good entry point or a signal to start building limit orders on the plot.
I use the ATR as a trailing stop loss for exit.
vica versa for entering shorts. The strategy is only set up to take long positions though.
This is a great scalping strategy for bots in Ranging or up trending markets.
This scripts has 5 variations built within it which are fitted for certain coins & their timeframes
The coins included are
BTC/USDT 1 Hour
ETH/USDT 1 Hour
ADA/USDT 30 Minutes
DOGE/USDT 15 Minutes
LUNA/USDT/15 Minutes
The Strategy backtest results includes Fess and there is NO Repaint! The script is written in Version 4
There is an option in the settings cog to choose from the 5 coins and their timeframes where they have been optimised
There is also an option to change the backtesting range
The stop Losses are also adjustable and listed under the settings
The strategy performs best on the Binance listings
Maximized Scalping On Trend (by Coinrule)" The trend is your friend. " This is one of the most famous and valuable teachings that experienced traders can give to newbies. There is a reason for that.
No matter your views about where the price moves, what matters is where the price heads to . The market is always right, and ultimately it decides who gets the profit and who has to take a loss.
The purpose of this strategy is to spot when it's the most suitable time to buy an asset profiting from a potential short-term price increase. The strategy tends to open trades frequently, closing them on average in one and a half days.
ENTRY
The buy order is placed on assets that present strong momentum when it's more likely that it is about to increase further in the short term.
To capture momentum on the asset, the rule strategy requires:
the MA50 greater than the MA100
the RSI greater than 50
The rule, then, places the order when
The price crosses above the MA9.
EXIT
This strategy comes with a stop loss and a take profit which adapt dynamically to market conditions.
The trade is closed in profit when the RSI is greater than 70 , as the trend could experience a pull-back.
Alternatively, the trade is closed when the RSI is lower than 30 , being this a sign of weakening of the trend.
Pro tip : The 1-hour time frame has proven to return the best results on average. The strategy can also work well in the 15-min time frame if you want to increase the trades' frequency.
The strategy assumes each order to trade 30% of the available capital and opens a trade at a time. A trading fee of 0.1% is taken into account.

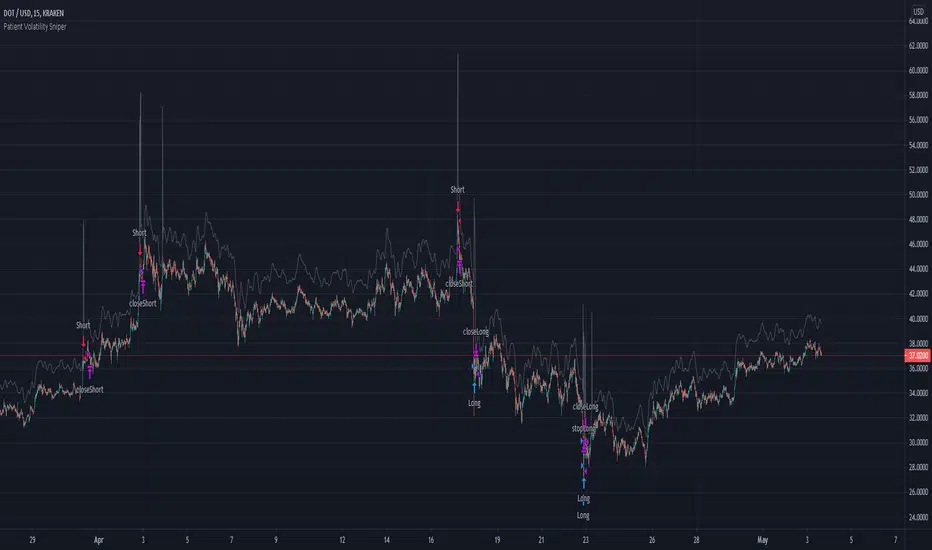
Patient Volatility SniperThis strategy waits for moments of high volatility where an asset is significantly overbought/oversold and makes very short trades.
When the indicator line spikes, it means the script sees a "window of opportunity." However, it will only enter a position if the underlying oscillators are overbought/oversold as determined by the threshold you set.
It does not produce a particularly gaudy net profit compared to many other strategies and can go weeks without making a trade. However, since the win/loss ratio tends to be consistently favorable (based on backtests: see below) it may be useful as a supplement to more "active" trading strategies.
I backtested it over the last year or so with a handful of different altcoins (specifically: ETH, ADA, DOT, XLM, VET, ZEC, and OMG), and it seems fairly robust. Please keep in mind that past results do not guarantee future success. Feel free to confirm the backtesting for yourself, especially as it may change in the future after this was written.
USAGE NOTE: If you have access to custom timeframes on tradingview, I strongly recommend using this strategy on charts in the range of 10m to 12m. In practice, there's not much of a difference, but I did optimize it for those slightly shorter timeframes. There are a handful of tickers for which it does not seem to work very well once you go up to 15m (notably, as of the time of publishing, DOGE).
Commission fee included because not doing so is unrealistic.