Moving Average and PerformanceThis indicator combines several tools that are used daily for analysis:
The performance of the action we are seeing.
The percentage of retracement the stock has made from its all time high.
Possibility of using up to four exponential or simple moving averages in the length we want.
It allows to see or not the levels of four moving averages in daily temporality.
This indicator is unique since it allows you to see in real time the performance of the Stock or ETF that is being analyzed, which allows you to make a timely decision for short, medium or long-term investments.
If you are doing scalping, swing, or intraday trading, you can see the retracement it has made from the ATH (3, 5, 10 or 13%) which can become Supports or Resistances where the price can rebound, Likewise, the levels of the moving averages in 1D temporality can be observed at the same time, which are usually dynamic supports or resistances and it can also be observed in the same temporality of the chart four moving averages that the trader can configure in the length that you deem convenient to improve your analysis and make decisions as quickly as possible.
Este indicador es único ya que permite ver en tiempo real el rendimiento de la Acción o ETF que se está analizando, lo cual permite tomar una decisión oportuna para las inversiones a corto, mediano o largo plazo.
Si se está haciendo trading tipo scalping, swing, o intradía, se puede observar el retroceso que ha hecho desde el ATH (3, 5, 10 o 13%) el cual puede convertirse en Soportes o Resistencias en donde el precio puede hacer rebotes, así mismo se pueden estar observando al mismo tiempo los niveles de las medias móviles en temporalidad de 1D, los cuales usualmente son Soportes o resistencias dinámicas y también se puede observar en la misma temporalidad del gráfico cuatro medias móviles que el trader puede configurar en la longitud que crea conveniente para mejorar su análisis y tomar decisiones lo más rápido posible.
Scalping
CRYPTOPRODear traders,
Welcome to CRYPTOPRO indicator. Only for crypto markets! This is an invite only script, please PM me to request permission for testing and access.
This indicator is developed as a scalping, intraday or swingtrade strategy.
Been working on indicators for years now, now back to trading again and made the best possible indicator for different timeframes.
The indicator uses market data, multiple timeframe ma/rsi charts and price action for determining a long or short strategy.
The indicator does not repaint!
I have made the indicator as easy as possible to use with added background colors.
How to use:
- Long strategy: when background turns to green after bar closing.
- Short strategy: when background turns to red after bar closing.
Alerts:
- Alerts are included in the indicator and are very simple to use.
- Alert "buy" for long strategy (green background)
- Alert "sell" for short strategy (red background)
- The alerts can also be used for automated trading/bot trading.
Time Frames :
- Can be used for all different timeframes.
Chart candles:
- Indicator is to be used with standard prince candles.
Note:
- Trading and financial markets are always risky and unpredictable.
- All trades made based on this indicator and his results are always your own responsibility.
- As an author i will not be held responsible for any of your trading profit or loss. Always be cautious when trading.
Charts can be applied to all TV supported crypto charts.
If you find the indicator usefull share your support and feedback in the comments.
Any questions PM me for more info.Thank you!
DISCLAIMER:
No sharing, copying, reselling, or any other forms of use are authorized for our scripts / strategy, and the information published with them.
This script / strategy is strictly for individual use.
This is not financial or investment advice. Investments are always made at your own risk and are based on your personal judgement.
NYTRADE is not responsible for any losses you may incur. Please trade wisely.

MM Scalper A scalpers Dream just like my other algorithms you have your SL, 2TPs, and entry points to scalp the market based on these two MoneyMoves Moving averages.
can use
Entry
2 TP
ATR x1.5 or x2 Stop Loss auto generated per signal.
BB Bands, TMA Bands, Donchain channels, or volatility cloud
MTF support and resistance
pivot high/low
works on all timeframes for scalpers, intraday, or even swing.
effective on binary as well.
Directions are simple
when one Ma crosses the other you will receive a signal with all your inputs
the signals change based on the length you set on the Baseline and Slop
use market structure and its it a sure winner
Link below or PM us for access to this indicator Happy Trading

Crypto SniperAn easy to follow indicator for scalping or long term trades. You can add this indicator to other analysis as a complementary indicator or use it alone for entry and exit your trades.
Features
• Simple entry signals, buy the contract at the end of the signal candle
• Additional entry signals can be enabled to increase your position and your profits
• Get exit signals for your opened trades.
• Alert conditions for all entries, additional entries and exits
• Enable ATR plot of Take Profit and Stop Loss
• Customize your ATR settings to adapt the indicator to any market
This indicator use some analysis to get the bottom/top of the cycles. Any market or timeframe and can be used. Specially designed for scalping on cryptocurrency futures markets.
LSMA Wave RiderThe LSMA Wave Rider uses Least Squares Moving Average to make a fast oscillator ideal for scalping lower timeframe charts. Upper and lower bands contract during pullback and expand as it "booms". The perfect entry is the first crossover after bands expand. This is a great tool for entering trades.
The above image shows two examples of perfect entries:
1. The upper and lower bands contract getting tighter as it pulls back.
2. The upper and lower bands then begin to expand as it gets ready to fly.
3. The oscillator crosses over showing entry point.
* Please note that this strategy may not work during major downtrends. *
Oscillator 2 is used to detect diversions. Reduce the number to pick up shorter diversions and increase to 200 to pickup larger diversions.

Top Scalping Indicator with Trend & S/RINTRODUCTION
---------------------
Welcome Traders, this is a custom indicator created specifically for scalping stocks, commodities, currencies, and cryptos where there is usually high volatility and momentum. This indicator is a fusion of three specially coded indicators.
1) Custom Dynamic Trend Line
2) Custom Buy and Sell signals
3) Support and Resistance lines
The trendline and the buy/sell scalp signals are based on RSI, MACD, Stochastics values, and the past volume of the security. There is also an ATR inbuilt which allows you to ride the trend. All values can be tweaked according to your trading style. After choosing the desired values, a trendline and buy/sell signals will be generated providing you with various trading opportunities.
Finally, the S/R levels help you to take better confluence trades.
HOW TO USE THIS INDICATOR
-------------------------------------
To make the most of this indicator, deploy it on your chart, wait for a buy signal when the candlestick breaks the trend line from below and take a trade after it closes above the trendline, with previous candles low as to stop loss. Similarly, take a short when the candle cuts the trendline from above and closes below. Maintain a 1:1 or 1:2 risk to reward ratio for net positive results over time. My suggested time frame for trading is 3m, 5m, and 15m, but it may be used on higher time frames as well depending on your strategy and trading style.
The above strategy is just a suggestion from personal experience. As this indicator is a confluence indicator that takes into account various technical values, it is best to back-test this strategy or create your own through the tools provided in this indicator.
Happy Trading!!

Scalp Recorder█ OVERVIEW
When it comes to tracking your performance when scalping, you are either going to design an automatic algorithm or that you might just want to go with the flow record your performance on a spread sheet. We all know how boring and time consuming that as. I initially designed this easy and simple script for myself, because I wanted to focus on scalping and the chart I have at hand here on TradingView and not go to my spread sheet to enter every single scalp. But instead have something to enter after I am done with my scalping session.
This script is easy to use if you're a systematic trader where you'd have entries, exits and take profits already set.
Just enter your R value ( The amount you're risking per trade ), and manually add a trade to "# of trades" when you're done with a scalp and add the Rs from that scalp in the settings. A 2 seconds process to store that data and have it presented to you at all time on an elegant box at the corner of the screen! - you can also adjust the location of that box/table, and hide your profit and average profit per trade if you want to share your daily/scalping-session stats with a friend -
Enjoy!

Legacy Scalper - Trend Trading SystemLegacy Scalper Trend Trading System
Welcome to the Legacy Scalper
This indicator is based on a trend trading strategy using multiple EMA's, with an added colored algo to help traders enter orders while simultaneously reducing noise in the markets by changing candlesticks to one solid color dependant upon direction of price.
This indicator capitalizes on short term momentum while ensuring that you are trading with the trend using the commonly known fact of EMA's being above or below price to ensure the trend.
The customization and plotting of different length EMA's allows for freedom to design your own system within the realm of the indicators, or use the recommended strategies below.
////////
The Legacy Scalper plots 3 main EMA's listed as following:
-50 EMA
-200 EMA
-800 EMA
Additionaly there is an algo coded into the mix that allows for:
- Tradingview alarms for buys and sells
- change of period (frequency) for buys and sells
- color selection of the moving average
- change all candlestick color dependant upon buy and sell alerts.
////////
The Strategies (Or Create Your Own)
Basic
Sell only when you get an alert above the 50 EMA (Only 50 EMA plotted on screen)
Buy only when you get an alert with the 50 EMA below price (Only 50 EMA plotted on screen)
Sell Example:
Intermediate
Sell only when 50EMA is below the 200EMA and you get a sell alert
Buy only when the 50 EMA is above the 200EMA and you get a buy Alert
Buy Example:
Advanced
Sell only when you get a sell alert with all EMA's above price
Buy only when you get a buy alert with all EMA's below price
Example:
Legacy Mode
Backtesting is highly recommended
Remove EMA's and plot a high period MA and take alerts both ways to capitalize on longer moves
And/Or
Add Ema's for swing trading with a higher plot MA
Example:
NOTES:
This is designed to work on all time frames
This is designed to work on all financial instruments
Feel free to backtest which period setting is best, however visually glancing at most charts the default setting appears the best across all instruments.
Feel free to add in other indicators for additional confirmation such as an RSI, TDI, Stoch, or WAE
DISCLAIMER
THIS IS NOT FINANCIAL OR INVESTMENT ADVICE AND SHOULD NOT BE INTERPRETED AS SUCH.
Trading foreign exchange on margin carries a high level of risk, and may not be suitable for all investors. Past performance is not indicative of future results. The high degree of leverage can work against you as well as for you. Before deciding to invest in foreign exchange you should carefully consider your investment objectives, level of experience, and risk appetite. The possibility exists that you could sustain a loss of some or all of your initial investment and therefore you should not invest money that you cannot afford to lose. You should be aware of all the risks associated with foreign exchange trading, and seek advice from an independent financial advisor if you have any doubts.

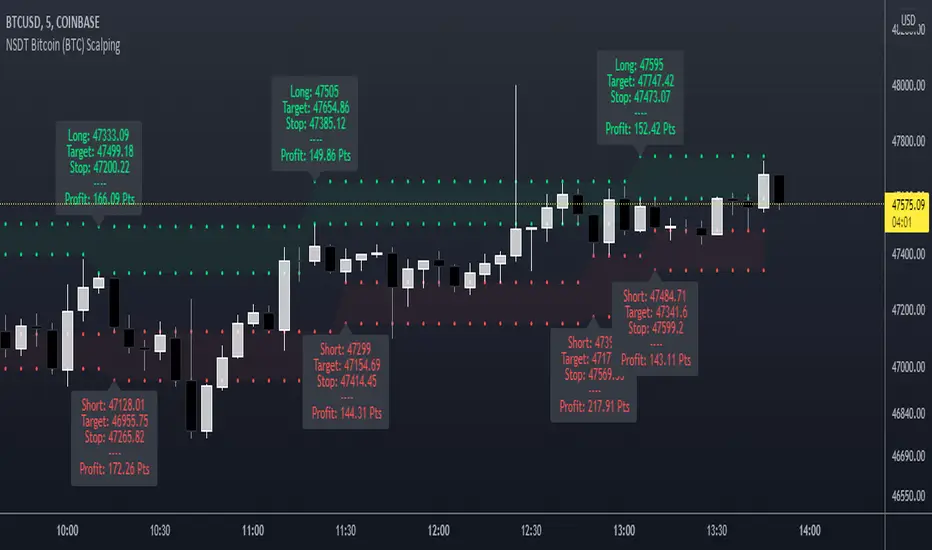
NSDT Bitcoin (BTC) ScalpingThis indicator is specifically designed for scalping Bitcoin (BTC). It looks for a particular price pattern/sequence and displays a label on the chart to show a potential entry, target, and stop based on that analysis. Basically enter long through the green zones and short through the red zones. These levels are not guaranteed to be hit. Trading is risking and you can lose money. Trade at your own discretion and risk. This indicator is only providing potential scalping zones based on recent price action.

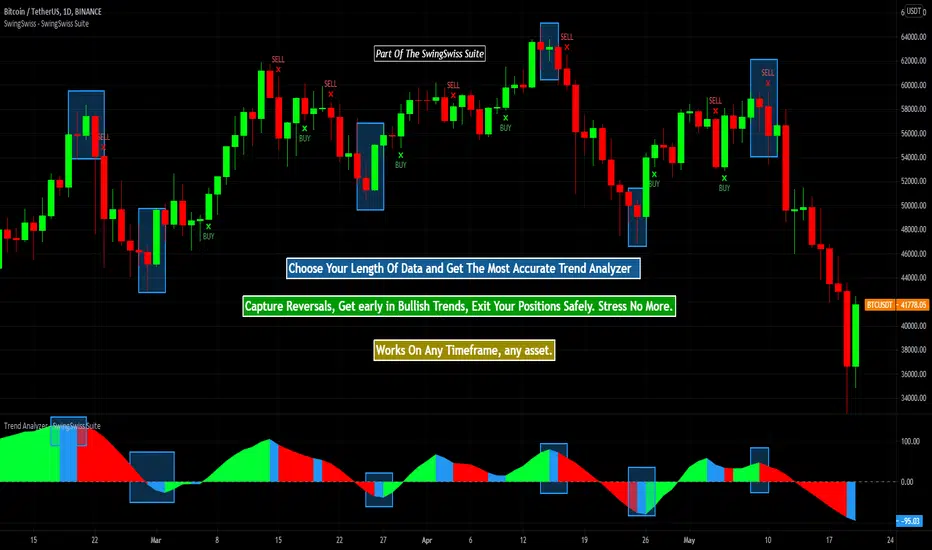
Trend Analyzer - SwingSwiss SuiteTrend Analyzer aims to define and analyze the trend of a particular asset at a given time using MACD, mathematical functions, and moving average.
It comes in very handy when determining an overall strategy or when you need to decide on whether a trade makes sense or not.
Finally, you can build a complete strategy around the indicator.
QUICK OVERVIEW
When the histogram is green, it means that the asset is currently bullish. Blue shows a possible reversal while red is synonymous with a bearish trend.
In the configuration panel, you can change the length of the data analysis.
The lower the number, the more recent the data captured is. Therefore, it's more predictive.
USE CASES
- You want to make a long trade on a 30mn chart but the indicator is red on the 30mn chart but also in the lower charts showing that the trend is not likely to reverse... You should think twice about that trade.
- You want to short the market on a 2h chart but on the lower charts, the green indicator is showing... Wait for a little bit, you might short at a higher price.
POSSIBLE STRATEGY
Let's take the BTCUSDT Future on the 2h chart :
You can display the indicator twice.
The first one with a length of 5, the second one with a length of 4.
To enter a long trade, wait for the green on length 5 and exit it at blue or red on length 4! It works like magic ;)
Disclaimer:
Trading and investing in the financial markets involves substantial risk of loss and is not suitable for every investor.
All trading strategies are used at your own risk.
Trend Analyzer is part of the SwingSwiss Suite, contact me for more info
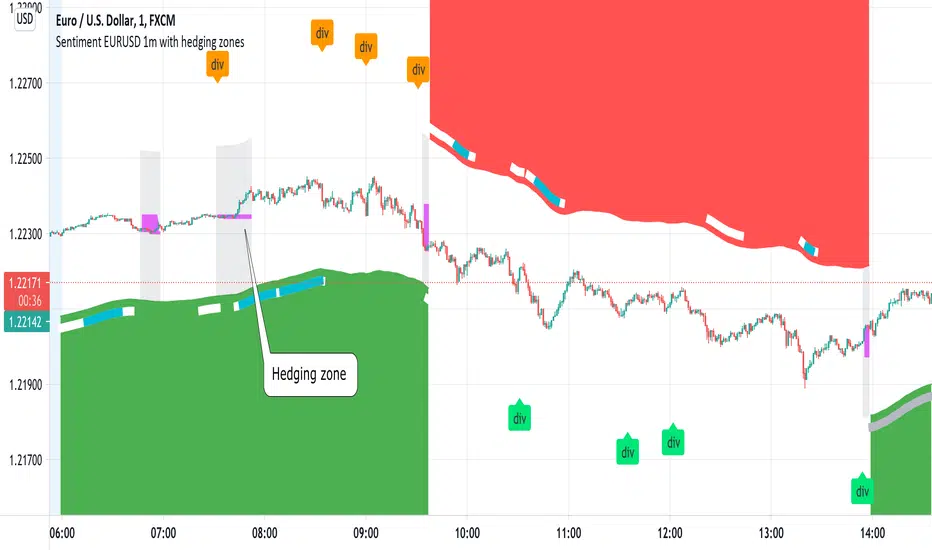
Sentiment EURUSD 1m with hedging zonesThis is a very specialised and optimized script, for 1m EURUSD traders - daytraders, scalpers.
1m trading is very difficult, but it can be also most profitable, if done right.
Why difficult? It is hard to detect market direction - usually when trend indicators reverse, that new trend is already over. One and the same indicator signal sometimes provides one outcome (for example reversal) and sometimes exactly the opposite (continuation). It requires deep understanding on WHEN to use which indicator and when to ignore signals. Set the parameters of your indicators to a very sensitive extent and they will keep changing direction back and forth - always being too late of course :) Set the parameters too losely, and you'll be late with entries 100% of times. Looking for universal trend-showing indicator? There is none...
This script is a result of 2 years of practical following EURUSD 1m market action. Looking at charts with MANUAL TRADER'S eyes. Analyzing all together: price action, indicators, zigzag, divergences, momentum, pivot points, support and resistance. On the one hand traders say only manual trading can be successful and on the other - to stick to one strategy and be automatic when applying to it. So this is it - automatic coding of market signals as if manual trader would do it. Forex is news-driven? Yes, it is. So if market sentiment changes because of some news happening, the script will quickly recognize it and suggest reversal.
Please note I'm not pretending to have a crystal ball. Nobody has. The goal of this script is not to predict where EURUSD market will be, but to correctly notice that is has reversed. Nothing else.
Sometimes the market will move towards reversal, but not cross the line yet - these are so-called HEDGING ZONES. Sometimes they turn out to be reversals and sometimes simply best places for dip entries. Ideally a trader should hedge there, because market could move either way. You might wanna apply apply knowledge of market fundamentals there or look into some micro-indicators. Anyway, it is good to realize where those zones are and this script shows them. In pink.
It is invite-only script. DM me for access.
GODXBT Scalper 15minGodxbt scalper is specifically designed for short term trades on 15min timeframe
This indicator is based on price action
What this indicator includes:
1) BULL,BEAR signals based on price action
2) 3 EMA(exponential moving average) for the market trend/direction .
3) take profits points ( based on oscillators ) shows overbought and oversold conditions.
How to trade :
This indicator works on 15min timeframe the parameters for the indicator is locked for 15min timeframe
***Important: Signal confirms on bar close
1) “BULL” signal shows buying opportunity
Buys are more profitable than sells if EMA ribbon is blue which means bullish trend (buyers are in control)
2) “BEAR” signal shows selling opportunity
Sells are more profitable when EMA ribbon is red which means bearish trend (sellers are in control)
3) TP+ and TP- appears below and above candles it shows the potential reversal points for the price action
There you should take some profits off the trade
Ema ribbon shows market trend
Default ema inputs are set on 20 and 50 (you can add your own sets of ema by changing the input )
Blue ribbon is bullish trend which also acts as a support
Red ribbon is bearish trend which also acts as a resistance
You can use ribbon to add stoploss below and above the ribbon
222 EMA for strong support and resistance
DM for the access

Eliza Ellis Improved FractalsA little side project of mine. may enhance further in the future. Used best for scalping. The longer you're in the market the more the news is waiting to eat you so I'd recommend using high volume and getting in and out quickly

VWMACDV2 w/Intraday Intensity Index Histogram & VBCB Hello traders! In this script i tried to combine Kıvanç Özbilgiç's Volume Based Coloured Bars, Volume Weighted Macd V2 and Intraday Intensity Index developed by Dave Bostian and added to Tradingview by Kıvanç Özbilgiç. Let's see what we got here;
VBCB, Paints candlestick bars according to the volume of that bar. Period is 30 by default. If you're trading stocks, 21 should be better.
Volume Weighted Macd V2, "Here in this version; Exponential Moving Averages used and Weighted by Volume instead of using only vwma (Volume Weighted Moving Averages)." Says, Kıvanç Özbilgiç.
III, "A technical indicator that approximates the volume of trading for a specified security in a given day. It is designed to help track the activity of institutional block traders and is calculated by subtracting the day's high and low from double the closing price, divided by the volume and multiplied by the difference between the high and the low."
*Histogram of vwmacd changes color according to the value of III. (Green if positive, yellow if negative value)*
VWMACD also comes with the values of 21,13,3... Which are fibonacci numbers and that's how i use it. You can always go back to the good old 26,12,9.
Other options according to the fibonacci numbers might be= 21,13,5-13,8,3-13,8,5... (For shorter terms of trading)
Trading combined with the bollinger bands is strongly advised for both VWMACD and III. VBCB is just the candy on top :)
Enjoy!

Order Blocks V2 [MensaTrader]Lines are Strong Support and resistance , Used to help find buy/sell or take profit zones.
When the lines turn green, these prices are suggest good limit entry prices for longs and shorts.
Default settings are left for scalping on short timeframes
Please note that this is experimental and far from perfect. feel free to play about with the variables in the settings.
feel free to comment any suggestions I hope to update this in the near future
The script is written in version 4

CCI45/SMA50 indy for 30 min SP500SPCFD:SPX
The script determines entry points using 45 period CCI and 50 period SMA.
Long condition: When CCI crosses up 150 treshold while price above 50 period SMA
Short condition: When CCI crosses down -150 treshold while price below 50 period SMA
Trades are executed above/below 1 point of high/low for long/short positions. Stops are just 1 point below/above of SMA. After 4 points of profit stops should be tightened. If you do not plan to hold the position for a long time, it can produce quick profit within 5-6 bars namely 2.5-3 hour. Otherwise you can manage the trade using SMA as trailing stop. This can be treated as a strategy of scalping which turns out a trend trading eventually if conditions good.
Have a nice trading

Hourly Scalp Engine◆ Purpose of this Script
The Hourly Scalp Engine (HSE) is designed to show scalp long opportunities on lower timeframes (H, 2H or 4H) based on a Fibonacci-valued MA-like structure. It was tested for Bitcoin and Ethereum, with the 2H timeframe seemingly giving the best test results. The chart shows a few instances where the price crossed below the HSE to trigger an entry (marked manually with arrows).
◆ Settings
Default scaling input (10.6) is tuned for Ethereum (ETH/USD) on Kraken.
Scaling input for Bitcoin (XBT/USD) on Kraken: 10.4.
Reasonable timeframes: H, 2H, 4H. Recommended timeframe: 2H.
You should probably set an alert for when Price crosses under the HSE.
◆ Instructions
As this is purely a scalp engine (and not feasible for long-term trades), the instructions have to be followed precisely for intended functionality:
As soon as Price crosses below the HSE, contemplate if you want to scalp, i.e. check current price, other indicators and market conditions. If yes, enter a scalp long. Do not enter the trade if : price has crossed above the HSE already and sits more than 1 % above it, or the down-wick was so deep and quick that it already retraced 10 % to the upside from the wick low (even if price is still below the HSE). In both cases it might be too late to enter.
Watch the 2H candle, at which you entered the trade, closing. Draw a 10 % price range from the wick low to the upside. The range high is your exit point. Set a take profit trigger there. Set a stop loss slightly below the wick low.
Observe the price action for the next 6 hours (i.e. the next three 2H candle closes). If price bounces up and hits the target, you exit with 10 % gains. If price hasn't moved to the target after 6 hours, close the trade at current price. If the stop loss should be hit in the meantime, you will have closed the trade automatically. The 10 % gain as a target was chosen because it seems to be hit very often, while higher targets are not reliably hit.
◆ Example Trade
Shown below is an example trade with correct drawing of the 10 % price range.
◆ Viability
From backtesting this should be a viable strategy for most instances where the HSE is crossed. However the HSE is not as hard as a boundary as e.g. the Confidence Bands (also published by DeanTrader), so that price can and will sometimes breach through (= close below) the HSE (as e.g. in the case of the March 2020 black swan event). Still even there a profitable trade could have been performed on the first bounce dependent on actual entry, although more risky due to very high volatility. Before using the HSE please make yourself familiar with the price action history of the considered asset and review the instances where the price crossed below the HSE in connection with the rules laid out in "Instructions" to understand the system and how to execute the trades. Also note that scalp trades are generally harder to perform than slower-paced swing trades, as timing becomes much more important and noise becomes relevant.
◆ Access
For access to this indicator please contact me via DM on TradingView or on Twitter (linked on my TradingView profile and in my signature).

AltTrader Scalp & SwingPLEASE READ THIS DESCRIPTION TO SAVE TIME AND UNDERSTAND WHAT THIS INDICATOR DOES
Hello Tradingview World!
It is us, AltSignals, and we're back after many months of working on a new indicator script for anyone to try! Just message us and we will add you to test it out, all feedback is highly appreciated as we're always trying to improve the script.
This script was designed for Cryptocurrency pairs as we know how much you guys love crypto! However it will work on other markets. The AltTrader script uses various indicators in conjunction with each other but the most prominent one is ATR! ATR is truly a secret indicator that many people do not incorporate into their trading strategy, but I have found it to be a great tool for finding trends and predicting tops!
I have made sure to include Take profit 1, Take profit 2 and Stop loss options for AltTrader, this means you can adjust the settings based on percent, make sure to use the measure tool in TradingView if you need to find out the percentage gap of a move. Generally with Crypto pairs the percent moves will be more so 1-5% and with forex much smaller 0.1-0.5% for example.
I have also added in a Power setting which allows you to increase or decrease the number of alerts, the default is set at 100, but you can do it as low as 1 and as high as 500 or more. But remember too many alerts is a curse and over trading may be detrimental to a users performance!
This indicator was designed to work in both small and high timeframe scenarios allowing you to catch small scalp moves and large trend moves, my personal favourite timeframes 15m and 1hr for lower timeframes and 4hr to 1D for higher timeframes. I know it can be tempting to use a low timeframe like 1 minute but there will be a lot of choppy indirection. You don't want to be sitting there all day trading, jumping in and out of every move there is.
I hope this has cleared up some questions for the indicator and I will be happy to answer more over Tradingview Private Messenger if needed. Please message me if you would like a trial as I am looking for feedback as well.
Thank you
AltS Team

MAC Trader V2.0 [VK]This script is based on a very simple and affective strategy. Usable for scalp, Trend, Swing, positional Trading. Works on all types of markets(Crypto, Stocks, Commodity, Forex, etc) and symbols.
About The Indicator :
The three lines(Grey upper, Red Mid, Grey Lower) moving with the price direction is Moving average channel (MAC) Which is used to determine the Market Direction. Buy/Sell signals are plotted on RSI Oversold/overbought Which is used For Entries. Small Red Line plotted below the Buy/Sell Signals is Stop loss and The Dotted lines in Green, Grey and Red are the take profit lines.
How to use :
Buy When Buy Signal, Sell When Sell Signal (Entry only After Candle Close). Use The red line below/above signals for Stop Loss. Green Red dotted lines to take profit targets, move your stops above/below as targets hits.
Functions :
Moving Average Channel (MAC) For Direction
RSI for entries
ATR for stops
Support/Resistance Lines to Take Profits
Color candles When Price Above/Below MAC
Additional Feature :
Chop Signals for Scalping/continuation/Mid Entries - This feature can be turned on in the indicator settings Which will plot B/S signals for entries.
TIP : Use MAC input 34,48 for low volatile markets (Indices, Gold , etc)
Scalping using RSI 2 indicator with TP and TSLThis study implements a simply scalping using the RSI (calculated on two periods), the slopes of two MAs (EMA or SMA) having different lengths (by default, I use 50 and 200).
A take profit (%) and a trailing stop loss (%) are used.
Entry conditions:
.) Fast MA > Slow MA and Price > Slow MA and RSI < Oversold Threshold ------> go Long
.) Fast MA < Slow MA and Price < Slow MA and RSI > Overbought Threshold ------> go Short
Exit conditions:
.) Long entry condition is true and (close >= TP or close <= TSL) ----> close short position
.) Short entry condition is true and (close <= TP or close >= TSL) ----> close long position
The strategy performed best on Bitcoin and the most liquid and capitalized Altcoins but works excellent on volatile assets, mainly if they often go trending.
Works best on 3h - 4h time frame.
There's also an optional Volatility filter, which opens the position only if the difference between the two slopes is more than a specific value, which can be set in the study inputs. The purpose is not opening positions if the price goes sideways and the noise is way > than the signal.
Note:
.) the RSI length is 2;
.) the oversold Threshold is 90%;
.) the overbought Threshold is 10%;
.) by default, the take profit per cent is 0.5%;
.) by default, the trailing stop loss per cent is 0.5%;
.) by default, the fast MA length is 50;
.) by default, the slow MA length is 200;
.) by default, the MA used is EMA.
Cheers.

MRC Trend Trader [VK]MRC Trend Trader one of the best indicator by VK. Usable for Trend, Swing, positional Trading. Works on all types of markets and symbols, Best To use in Time Frame Higher Than 30m
About The Indicator :
This indicator uses MACD to scan the Trend Based on Higher TF and RSI+CCI for entries . It also has the ability to plot MACD crossing signal line in higher TF, plotted on the bottom of the chart and ATR is used for Stop Loss, plotted below Signals. One of the best function of this indicator is support/resistance levels, dot lines plotted on the chart, Which can be used to Take Profit as targets.
How To Use :
The main strategy behind this indicator is to only Long When Background Trend is green and only Short when Background trend is red . Enter on B/S Signal close.
Functions :
- MACD to scan Trend and MACD cross on Multi Time Frame.
- RSI to find lower Buy entry and Higher Sell entry (MTF - Only use current TF or Lower).
- CCI to find continuation entries (More Signals).
- Stop Loss.
- Support and Resistance Levels (Take Profit Targets).
This indicator is set up keeping Money management as one of the main priority, Keep taking profits on targets and always move Stop Loss to Breakeven Once in Profit.
PM for access.

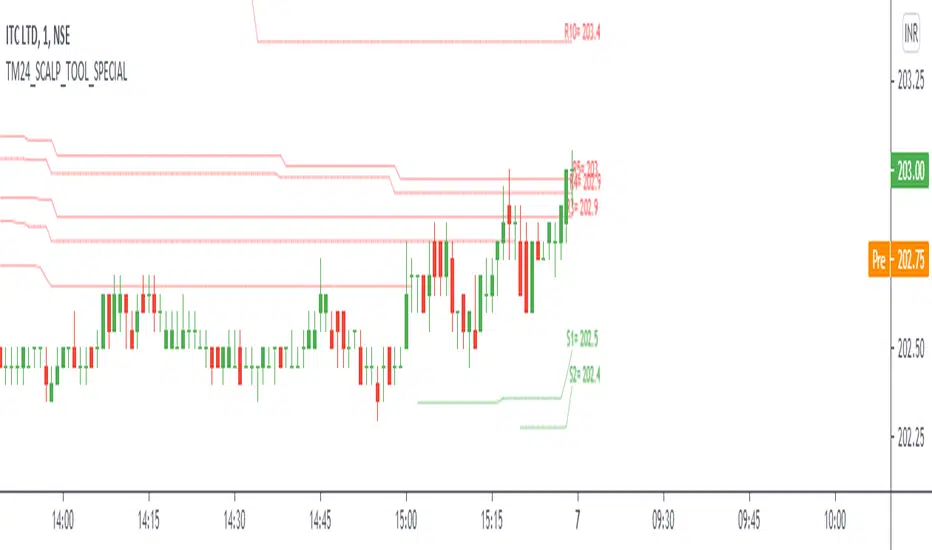
TM24_SCALP_TOOL_SPECIALTM24_SCALP_TOOL_SPECIAL helps to identify following Things for Intraday-Swing Position on 1- 5 Minutes + timeframe along with Trend, Support , resistance , reversal and Breakout levels.
1. Market Trend (Different Timeframe)
2. Price Direction
3. Area of Support & Resistance
4. Price Momentum
Terminology Use ==> Red for downtrend and green for uptrend on that timeframe
Display and Interpretation ==> Buy Sale Signal with breakout 1-2-3-4-5 for different time frames.
any value signal ending with * shows breakout of support/ resistance and value signal starting with * shows entry to a momentum zone.
Use market structure, chart pattern, trend lines for more support..
Time frame ==> Use proper Signal with 60 minute or daily time frame
What to Identify ==> Overall Trend for the Swing
How to Use ==>
See how and order buildup is seen and current order position. Also area for volatility and expected movement in price direction
Note: - Use market structure, chart pattern, trend lines and price action parameter for more confirmation.
Entry ==>
Let’s wait the proper area of support or resistance ( Area of Value in case of trend pattern use)
Exit ==>
SL of swing high/low out of market structure with proper risk management and target with proper Risk/ Reward Ratio
Use the Below Contacts to Access this Indicator