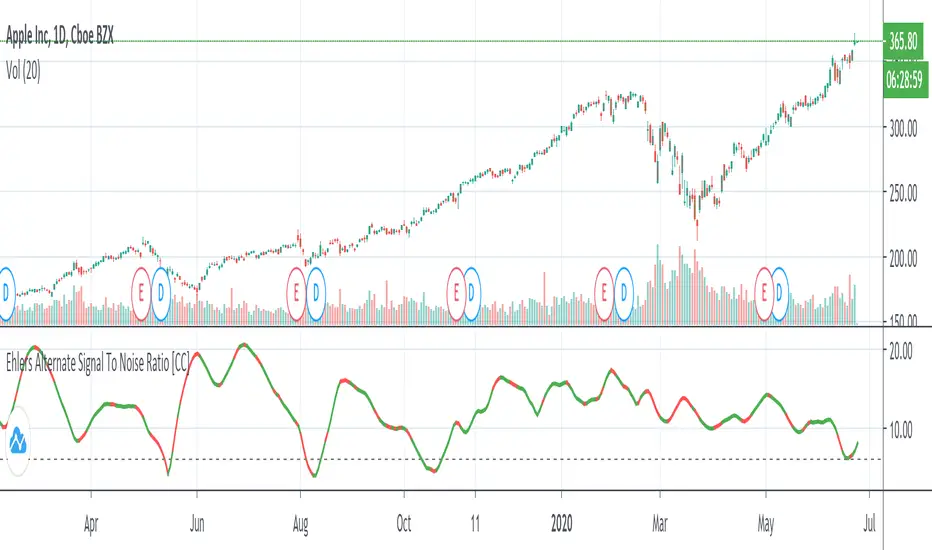
Ehlers Alternate Signal To Noise Ratio [CC]The Alternate Signal To Noise Ratio was created by John Ehlers (Rocket Science For Traders pgs 84-85) and this is a variation of his signal to noise ratio that some scalpers might find more useful than his default signal to noise ratio. You would want to buy and sell when the indicator is above the dotted line because that means the stock is volatile enough to maximize any movement of the trade in either direction. Buy when the indicator line is green and sell when it is red.
Let me know if there are other indicators you would like to see me publish or if you want something custom done!
Scalp
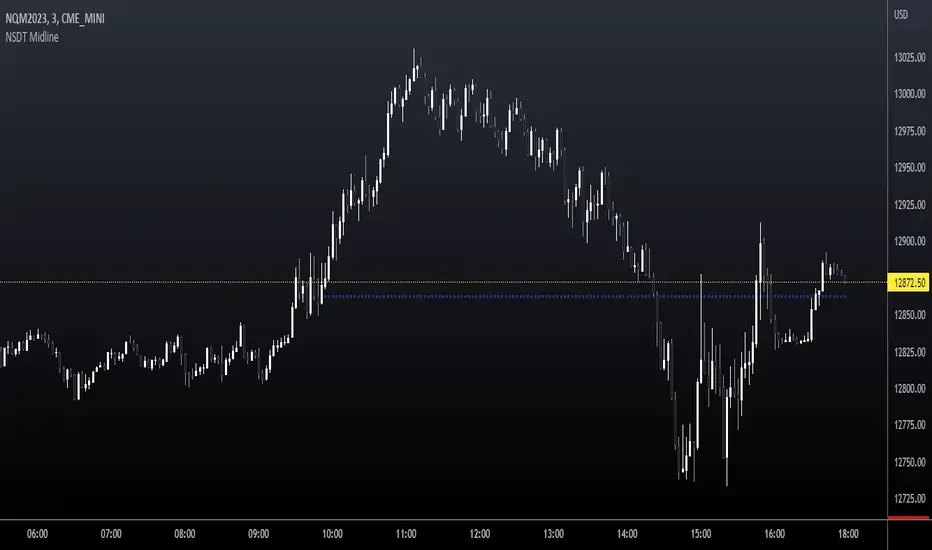
NSDT MidlineSimple script to plot the Midpoint between the High and Low of day for intraday trading. This is a key level that is respected quite often. Very easy to trade bounces or breakthroughs.
Intraday BUY/SELLBUY & SELL Scalp Signals for Crude Oil Future Contracts (Or it can be used with any scrip with good amount of Volume) based on Sma & RSI overbought/oversold alert (!) for possible reversal indication.
Take Buy position only if candle breaks the high of alert candle & for Sell positions, take position if candle breaks low of the alert candle.
Best to perform with 3 min timeframe on Crude Oil Futures

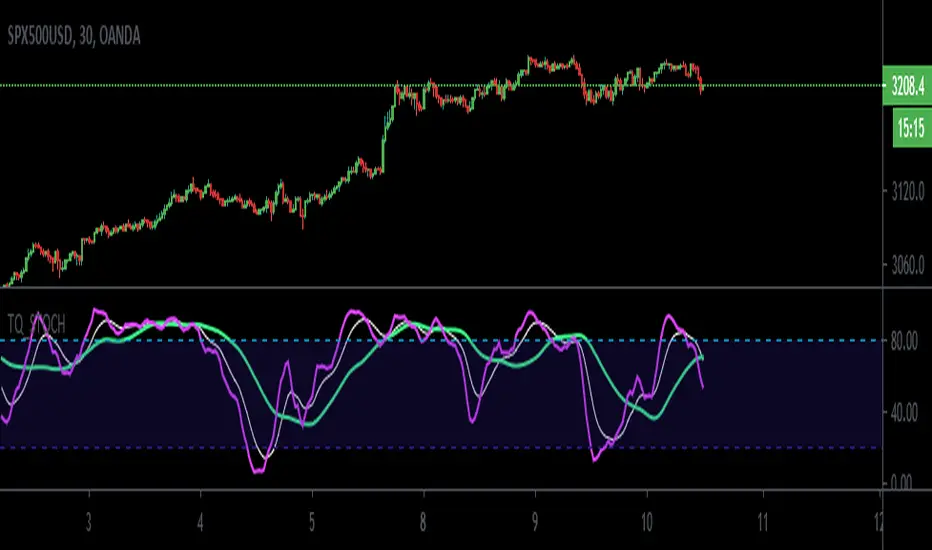
TQ_STOCHThis is a modified stochastic oscillator. It works very well with Forex pairs, traditional markets and has also proved itself profitable with BTC. The aim of this indicator is to help you predict a change in direction of the market.
When lower periods are above higher periods you are looking to buy of support and when lower periods are below higher periods you are looking to sell of resistance.
Lowest period: pink
Medium period: white
Longest period: turquoise
PERFECT LONG: pink line above the white and white above the turquoise. Turquoise should serve as support for the white line and white line should serve as support for the pink line. BUY when pink line tests the white line and bounces off.
PERFECT SHORT: pink line below the white and white below the turquoise. Turquoise should serve as resistance for the white line and white line should serve as resistance for the pink line. SELL when pink line tests the white line and bounces down.
You can also play less perfect signals where pink or white tests blue as support or where white is not above the blue line yet but you still get a test of the white from the pink. These are slightly more risky.
- SOME SIGNAL EXAMPLES:
Enjoy :)
MA Pull [VK] - alert version of vkscalperThis is the alert version of vkscalper
you will need to change the settings for different TF also try changing MA types
Ability to choose MA types
Ability to plot stop loss / take profit lines
simply select buy alert or sell alert for alerts

MoneyFlow SCALP
this indicator to trade for a short time in a TF of 1-5-15 minutes.
We have created takeprofit zones for you so that you can understand where we can get to and take your profit. these points are mostly very helpful.
There are basic settings that allow you to adjust the indicator individually for each situation; because of this, this indicator can be used for any exchange and any currency pair.
For Scalp trading, we use 4 different strategies available to our clients. If you enter them correctly, you can never see the minus sign.
Use the link below to obtain access to this indicator.

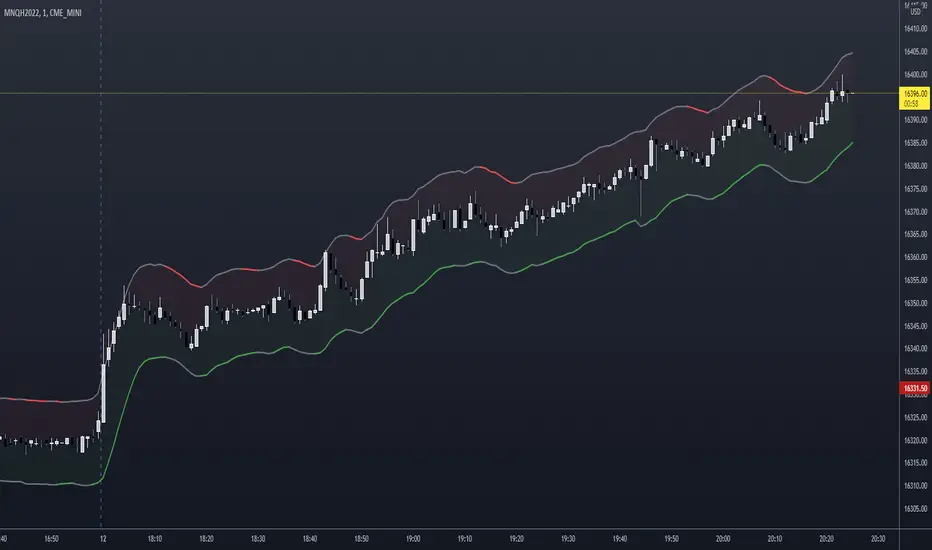
NSDT Scalping ChannelThis script uses the highs and lows of the candles (instead of the close) to make a "channel" to reference while scalping.
Use the green lower line as a guide to go long and the red upper line as a guide to go short. You may use the lines as potential entry points and direction but you may want to consider exiting before the opposite colored line prints, as that may be too late. As always, entries and exits are at the discretion of each trader.
You will need to adjust the "Line Spacing" settings as you change instruments, chart timeframes, and/or volatility increases/decreases.
Crypto Scalper Pro Study / Alerts===========
Crypto Scalper Pro Study Script with Alerts
===========
Our Crypto Scalper Pro Study with Alerts Script is a carbon copy of our tried and tested Crypto Scalper Pro Strategy , but now with the option of setting TradingView Alerts for your chosen trading plan. Making missing trades a thing of the past, and helping you to automate your own trading strategy using AutoView, 3Commas or similar 3rd party Auto Trading Software.
-----------
Crypto Scalper Pro is a scalping strategy developed to work alongside our Crypto Tipster Strategy, now you can trade the D markets with our Tipster, and Intra-Day markets with our Scalper!
This strategy works very well on shorter time frames across multiple crypto pairs, everything from 4H all the way down to a 5m chart, our Crypto Scalper will find the best Entry and Exit points for consistent and reliable returns.
We've added a few variables for you to play with to fine tune this scalper to suit your chosen trading plan - however, these will only adjust the strategy to a certain degree, as there are many algorithms and indicators doing their thing hidden in the background that take precedence.
-----------
What's Included?
Crypto Scalper Pro comes with a host of features and is being continually updated, these features include (but are not limited to):
- Date Range Settings
Setting custom Start/End dates can help hone your strategy to suit the current times, or get a general overview of the market over the years.
- Heikin Ashi Confirmation
We added HA confirmation for both Entry & Exit of trades. This started as a form of "Safe Mode", we have since adapted our safe mode far beyond Heikin Ashi; but kept this confirmation as an added extra.
- Variable Indicator Settings
As well as our Fixed Indicators and Price Action analysis going on in the background of the strategy, we've also included some Variable Indicators that you have access to edit.
Lookback Period will help establish how far back you'd want to be confirming price indications on the strategy - the higher the number the further back it will look, making the Scalping Strategy appear smoother with less trades during choppy times, the downside with a higher lookback is you might miss the start of a potentially epic trade, and only be shown an Entry after the event has already happened.
We find Lookback Lengths of between 5 and 100 could work depending on various other settings, the market being traded, and the timeframe being used.
MA Length (Length of Moving Average) - We use a few MA's to best determine various factors involved with successfully scalping a market, overall trend direction, current price movements and fake-out detection to name just a few. You've got the option of determining a good average length for a few of these variables.
Again, a short MA Length will catch every big move right at the start, but you're almost guaranteed a Negative Expected Value with that method, due to the vast quantity of losing trades in times of chop/ranging markets. A Higher MA Length will remove a lot of chop, reduce the quantity of trades, and therefore (should) result in a higher Percent of Trades Profitable; it will however add a certain lag to the strategy, meaning those highly profitable trades we're looking for may turn out to be not so highly profitable!
- Safe Mode
Enabling Safe Mode will add a couple more confirmation indicators to the strategy - the aim of Safe Mode is, in essence, to remove any trading signals that would end of being false/bad moves. Usually resulting in less Overall Trades, a higher Net Profit, higher % Profitable, higher Profit Factor AND a lower Drawdown. Use Safe Mode to help eliminate orders that would otherwise be placed in choppy markets.
- Stop Loss/Take Profit Settings
This is where Crypto Scalper Pro really proves itself, Money Management. We have an editable Fixed SL/TP, as well as Trailing Stops for Long or Short orders, all of which you can use on their own, or combined with each other. Playing with these settings can turn an un-profitable system into a very-profitable trading plan!
-----------
What's Included within Crypto Scalper Study / Alerts Script?
Our Study script will find Entry and Exit points exactly as our Pro Strategy would find them. The same indicators, methods and chart reading techniques are used, there are 2 big differences however...
The first difference is that our Pro Strategy has the ability to manage your money, Fixed Stops, Take Profit and Trailing Stops to name just a few. Our Study does not (yet) have these functions added due to the way TradingView's charting platform operates.
That's the bad news, the good news for our Crypto Scalper Study Script is that you can add Alerts to your trading plan! This is super handy if you decide to implement our methods into different time frames across various markets and are looking for Intra-day Alerts, or if you're looking to Automate your trading strategy using external software.
Help and Advice for setting up Alerts or to Automate your Strategy can be found on our website.
----------
For more information on the Crypto Scalper Pro Strategy visit the link in our signature.
Good Luck and Happy Trading!

[BT] - ScalpMaster [ALERTS] v1Go easy on this script as it's my first, hopefully more to come!
ScalpMaster - V1
It's main feature is catch a bull run for volatile markets. Two main selling triggers (CCI and TSSL) with an option to only sell after fees are met (for profit).
Built in Statistics and Back-testing
I've introduced my own version of backtesting built into the main script. You can disable it if it's too much, just makes it easier to dial the settings in and compare with alert triggering. I've included this on all of my scripts.
***You will get a warning that this script repaints, however you can easily compare alerts against the labels. I'm not entirely sure, but I believe the repainting is due to the Global Stats Label at the end gets repainted to keep in the front. ***
Directions
Buy: When dialing in the script, watch the purple line above the source, when the current price crosses above this purple line then the buying trigger sets.
Sell: TSSL - Trailing Stop / Stop Limit, use available settings to manipulate behavior. It's meant to trail the bull run and sell once the price crosses the bottom tssl bar
Sell: CCI - Modify the FastMA and SlowMA settings
Sell: P+ - Above won't trigger until you are in the positive after the fees x2 are met. Great to keep your losses minimal. Combine this with a high Stop Loss for great results but might be waiting awhile for a profit.

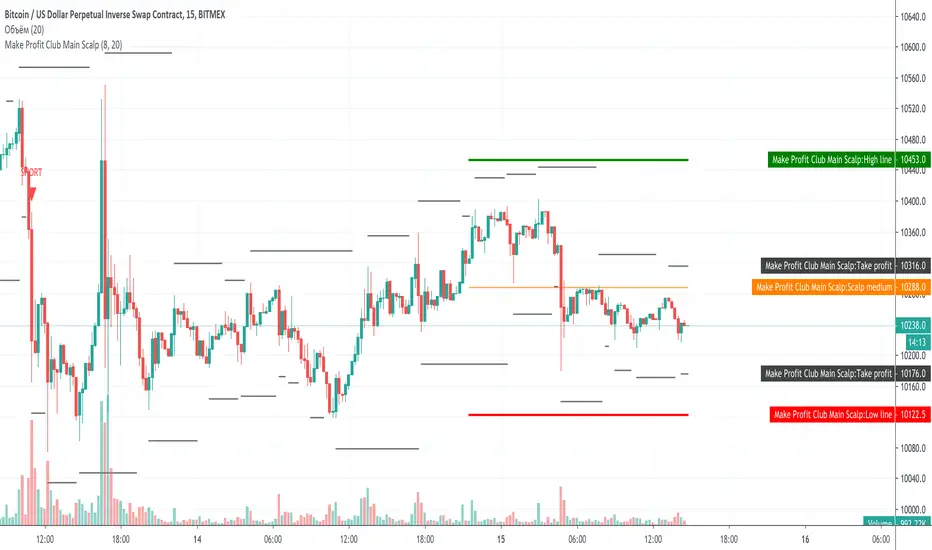
Make Profit Club Main ScalpThe main scalping indicator.
We use this indicator to trade for a short time in a TF of 5-15 minutes.
We have created takeprofit zones for you so that you can understand where we can get to and take your profit. these points are mostly very helpful.
There are basic settings that allow you to adjust the indicator individually for each situation; because of this, this indicator can be used for any exchange and any currency pair.
For Scalp trading, we use 3 different strategies available to our clients. If you enter them correctly, you can never see the minus sign.
Use the link below to obtain access to this indicator.
Trend Scalper (Expo)Trend Scalper (Expo)
DESCRIPTION
Trend Scalper (Expo) is a Scalping strategy based on RSI, Stochastic and moving averages techniques. The idea is to visualize scalping opportunities in trends.
The trend is determined by the color of the moving average called ‘TrendHolder’ The ‘Trendholer’ consists of 3 colors, green, red and orange. Green is a positive trend, red is a negative trend and orange is a neutral or no trend.
Scalping opportunities are visualized by the circles and the triangles. The circles are based on RSI calculation. The triangles are based on Stochastic calculation.
- If there is a green circle and a green triangle and ‘Trendholder’ is orange or green, Enter Long!
- If there is a red circle and a red triangle and ‘Trendholder’ is orange or red, Enter Short!
Combine the indicator with HEIKIN ASHI candlesticks.
HOW TO USE
1. Use the indicator to find scalping opportunities in trends.
I NDICATOR IN ACTION
BTCUSD
EURUSD
GOLD
The indicator works with RENKO, HEIKIN ASHI and with KAGI charts as well.
I hope you find this indicator useful, and please comment or contact me if you like the script or have any questions/suggestions for future improvements. Thanks!
I will continue to work on this indicator, so please share your experience and feedback with me so that I can continuously improve it. Thanks to everyone that have contacted me regarding my scripts. Y our feedback is valuable for future developments!
ACCESS THE INDICATOR
• Contact me on TradingView or use the links below
-----------------
Disclaimer
Copyright by Zeiierman.
The information contained in my scripts/indicators/ideas does not constitute financial advice or a solicitation to buy or sell any securities of any type. I will not accept liability for any loss or damage, including without limitation any loss of profit, which may arise directly or indirectly from use of or reliance on such information.
All investments involve risk, and the past performance of a security, industry, sector, market, financial product, trading strategy, or individual’s trading does not guarantee future results or returns. Investors are fully responsible for any investment decisions they make. Such decisions should be based solely on an evaluation of their financial circumstances, investment objectives, risk tolerance, and liquidity needs.
My scripts/indicators/ideas are only for educational purposes!

Master ScalpA unique scalpel indicator with high accuracy analyzes the market and determines the points for entering a position. Allows you to trade inside the channel. The algorithm underlying it is protected by copyright.

Scalp Master V1.1This version has added support and resistance to help traders identify the best entry and exit points.
Also, we included a linear regression band to identify the last period's trend, the prices would normally swing between the upper and lower dotted white line and it gives a good starting point for traders to identify possible bounces or rejection moments of the price.

Scalp Master V 1.0The Scalp Master is designed for new and experienced trainers to get a better understanding of sudden direction changes in the cryptocurrencies markets, by displaying just 2 basic signals: "Up" or "Down".
It combines the T.A of a group of indicators to give you the most sensitive tool to catch a Pump or Dump before it happens. It also includes one of the most basic and powerful tools to understand how the market is going to behave: Bollinger Bands, if we get an "Up" signal near the lower Bollinger band, we might be close to a good pump and if we get a "Down" signal near the top Bollinger band a dump in the price will most likely happen.
Enjoy!!!

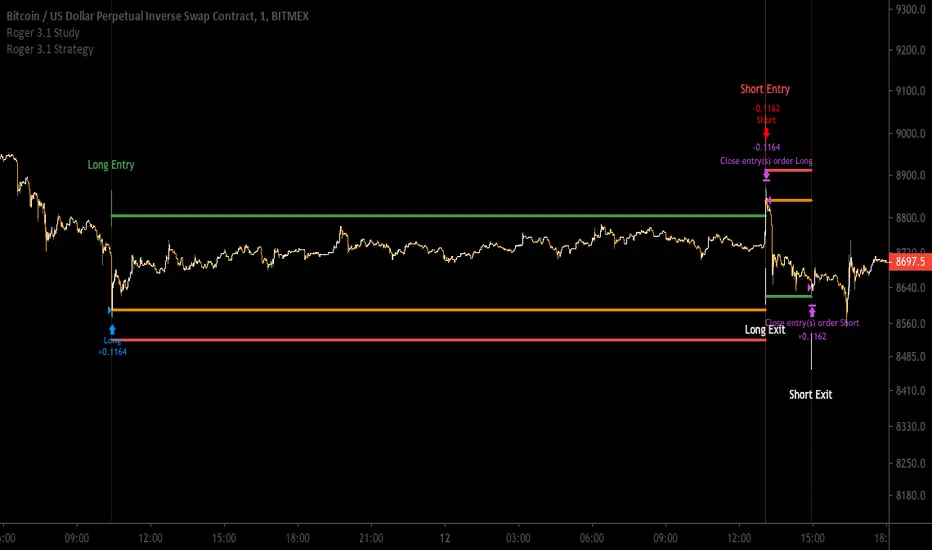
[Aill3urs V.1.1.P] Study RogerThis INVIT-ONLY study is based on Noise / Fixe TP & SL / EMA and you can optimize it with trends and work on low timeframe < 5min
Please use comment section for any feedback.
For any question DM me for any request.
## DISCLAIMER
1. I am not licensed financial advisors or broker dealers. I do not tell you when or what to buy or sell. I developed this software which enables you execute manual or automated trades multiple trades using TradingView. The software allows you to set the criteria you want for entering and exiting trades.
2. Do not trade with money you cannot afford to lose.
3. I do not guarantee consistent profits or that anyone can make money with no effort. And I am not selling the holy grail.
4. Every system can have winning and losing streaks.
5. Money management plays a large role in the results of your trading. For example: lot size, account size, broker leverage, and broker margin call rules all have an effect on results. Also, your Take Profit and Stop Loss settings for individual pair trades and for overall account equity have a major impact on results. If you are new to trading and do not understand these items, then I recommend you seek education materials to further your knowledge.
**YOU NEED TO FIND AND USE THE TRADING SYSTEM THAT WORKS BEST FOR YOU AND YOUR TRADING TOLERANCE.**
**I HAVE PROVIDED NOTHING MORE THAN A TOOL WITH OPTIONS FOR YOU TO TRADE WITH THIS PROGRAM ON TRADINGVIEW.**
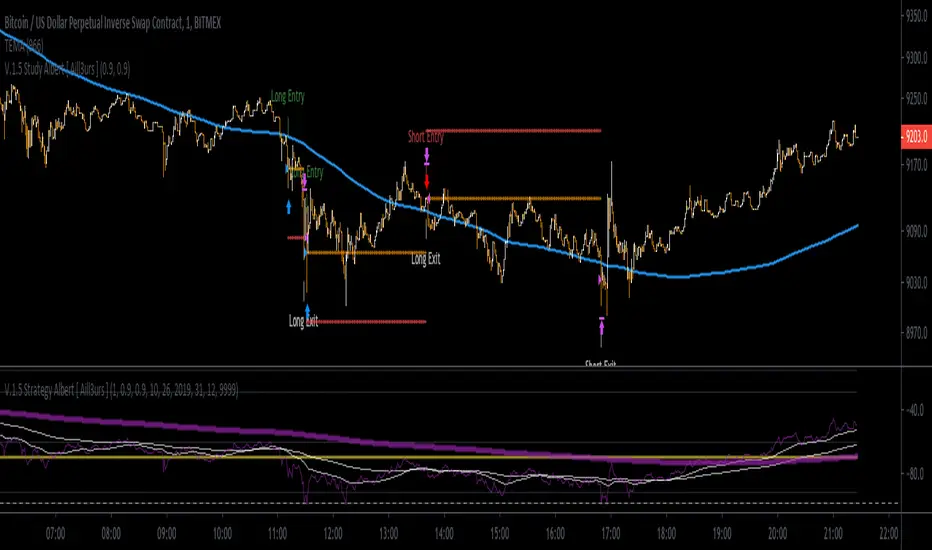
[Aill3urs V.0.5] Study AlbertIt's the Study of the this Aill3urs-V-0-4-Strategy-Albert-EMA-Level-S-R-William you can find below.
For any info DM me.
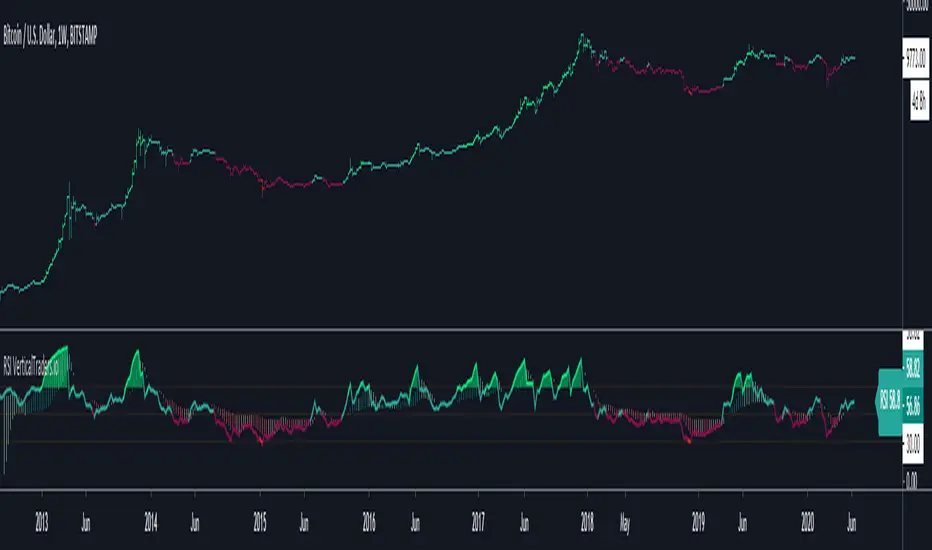
Stochastic RSIStochastic RSI
It is generally used to generate signals when crossings are made in overbought or oversold areas,
but it is important to take advantage of these signals according to the general trend, in this way we avoid false signals.
Overbought doesn't necessarily mean the price will reverse lower, just like oversold doesn't mean the price will reverse higher.
Rather the overbought and oversold conditions simply alert traders that the RSI is near the extremes of its recent readings.
So the main idea will be to use the signals as long as we are trending in the same direction,
the other crosses will be used as signals to take profits or as warning signs to check our trades.
Extra functions in this indicator:
- Trend background.
- Long and Short Labels base on trend and take profit warnings.
- Alerts for long and short entries and take profit warnings.
Take Profit / Warning Labels enable (Orange)

Heiken AshiHeikin Ashi charts are similar to candle charts, but the main difference is that a Heikin Ashi chart uses daily price averages to show the movement of the average price of an asset.
The idea is to use the heikin Ashi technique as an indicator and not as the main chart, to avoid enter or exist the market too late.
Key concepts:
- The averaged open and close help filter some of the market noise, creating a chart that tends to highlight the trend direction better than typical candlestick charts.
- The downside is that some price data is lost with averaging. The most recent price (close) may not reflect the actual price of the asset, which could affect risk.
- Long down candles with little upper shadow represent strong selling pressure. Long up candles with small or no lower shadows signal strong buying pressure.
Extra functions in this indicator:
- Trend Bar indicator, uptrend(green), downtred(red), warning or indecision (yellow).
- Long and Short Labels base on trend and Heikin Ashi entries.
- Change the color of the main chart Candlesticks as the Heikin Ashi indicators.
- Alerts for long and short entries.
- Size of Labels.
Bollinger BandsBollinger bands are calculated from a moving average, creating two curves that involve the price chart, these bands are defined by a standard deviation generally of value 2 with respect to the moving average.
Applications:
- They show the volatility of the market, when the bands are compressed, the volatility decreases, when the bands extend, the volatility increases.
- Trend, with respect to the moving average according to the location of the price corresponding to the positive or negative standard deviation.
Extra functions in this indicator:
- You can use several types of moving averages for the calculation: SMA, EMA, DEMA, TEMA, WMA, VWMA, HullMA, TMA, SMMA, SSMA, etc.
- Background: Shows the zone equivalent to a standard deviation of 1 and 2 with different color.
- Log chart: It can be used on logarithmic price scales, to avoid distortions in those charts.
- Multimeframe: so you can visualize the behavior in different timeframes without changing timeframe.
- Interpolation: Round the curves when viewing larger timeframes.
Multitimeframe example: 1D, select timeframe to Bollinger bands 1W and log chart
Same chart with interpolation

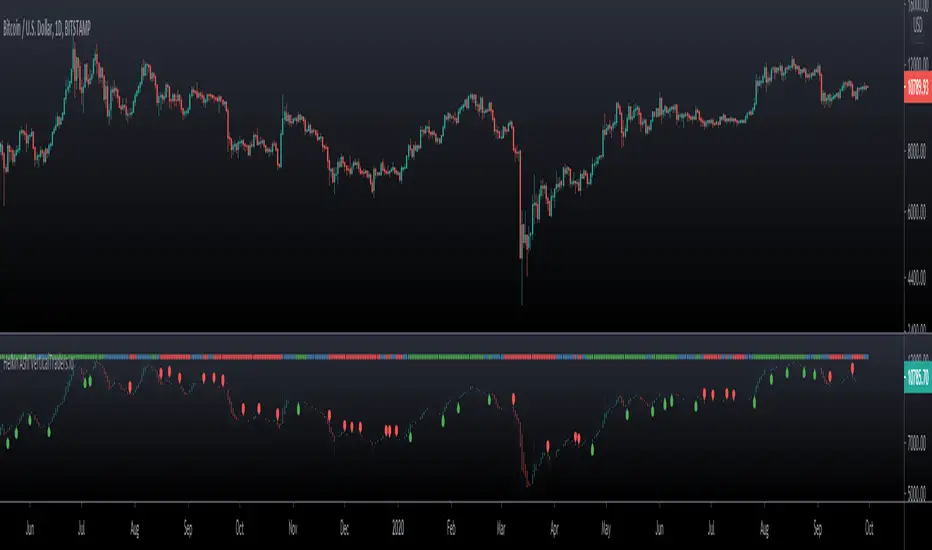
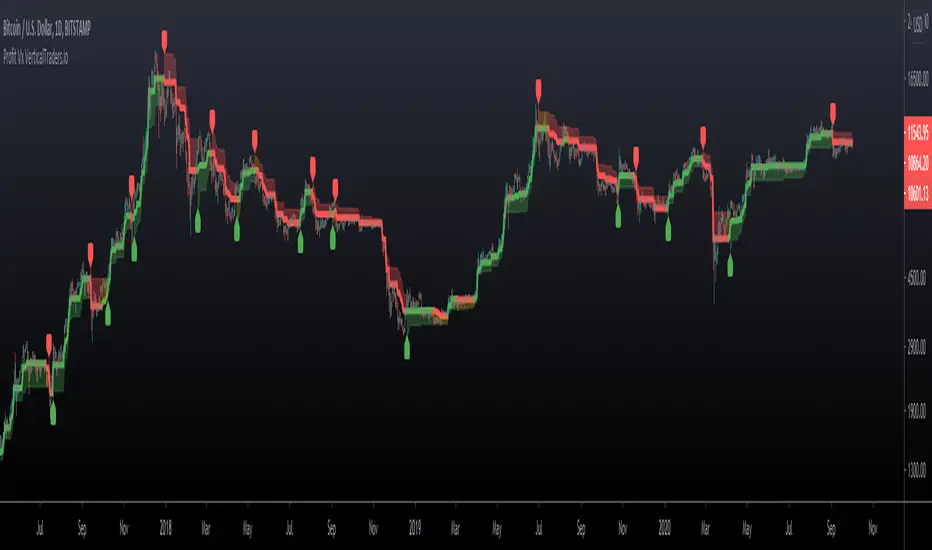
Profit VxProfit Vx
- Labels for Long and Short entries
- Take Profit point base on %
- Candlestick color, orange is warning or not trending zone
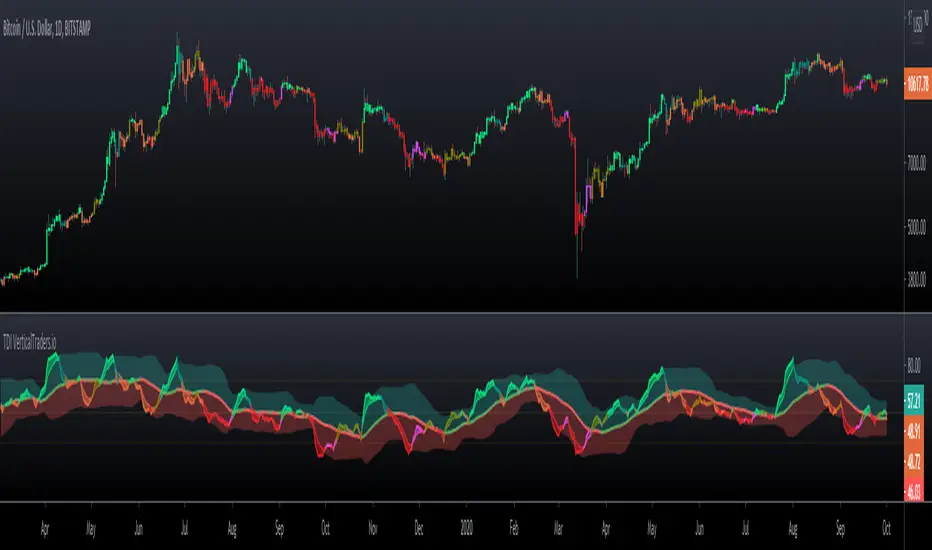
TDITDI
- Calculate strength and market direction by analyzing relative strength
- Ribbon mode, according to the TDI conditions
- Candlestick same as TDI Ribbon colors
- 6 colors to define market strength
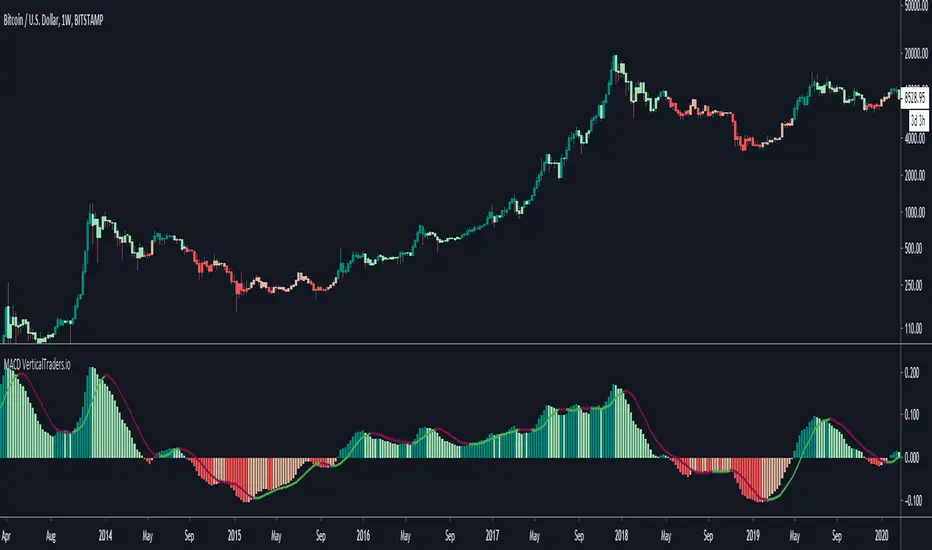
MACDMACD
- Enhanced MACD
- Shows the MACD in a simple way, to facilitate its analysis
- Histogram mode and Normal mode
- MACD color depends on its values
- Candlestick same as MACD colors
- Calculate the MACD with EMA or SMA
- Allow to use the RSI Source for calculations
- Log chart option