Volume Sampled Supertrend [BackQuant]Volume Sampled Supertrend
A Supertrend that runs on a volume sampled price series instead of fixed time. New synthetic bars are only created after sufficient traded activity, which filters out low participation noise and makes the trend much easier to read and model.
Original Script Link
This indicator is built on top of my volume sampling engine. See the base implementation here:
Why Volume Sampling
Traditional charts print a bar every N minutes regardless of how active the tape is. During quiet periods you accumulate many small, low information bars that add noise and whipsaws to downstream signals.
Volume sampling replaces the clock with participation. A new synthetic bar is created only when a pre-set amount of volume accumulates (or, in Dollar Bars mode, when pricevolume reaches a dollar threshold). The result is a non-uniform time series that stretches in busy regimes and compresses in quiet regimes. This naturally:
filters dead time by skipping low volume chop;
standardizes the information content per bar, improving comparability across regimes;
stabilizes volatility estimates used inside banded indicators;
gives trend and breakout logic cleaner state transitions with fewer micro flips.
What this tool does
It builds a synthetic OHLCV stream from volume based buckets and then applies a Supertrend to that synthetic price. You are effectively running Supertrend on a participation clock rather than a wall clock.
Core Features
Sampling Engine - Choose Volume buckets or Dollar Bars . Thresholds can be dynamic from a rolling mean or median, or fixed by the user.
Synthetic Candles - Plots the volume sampled OHLC candles so you can visually compare against regular time candles.
Supertrend on Synthetic Price - ATR bands and direction are computed on the sampled series, not on time bars.
Adaptive Coloring - Candle colors can reflect side, intensity by volume, or a neutral scheme.
Research Panels - Table shows total samples, current bucket fill, threshold, bars-per-sample, and synthetic return stats.
Alerts - Long and Short triggers on Supertrend direction flips for the synthetic series.
How it works
Sampling
Pick Sampling Method = Volume or Dollar Bars.
Set the dynamic threshold via Rolling Lookback and Filter (Mean or Median), or enable Use Fixed and type a constant.
The script accumulates volume (or pricevolume) each time bar. When the bucket reaches the threshold, it finalizes one or more synthetic candles and resets accumulation.
Each synthetic candle stores its own OHLCV and is appended to the synthetic series used for all downstream logic.
Supertrend on the sampled stream
Choose Supertrend Source (Open, High, Low, Close, HLC3, HL2, OHLC4, HLCC4) derived from the synthetic candle.
Compute ATR over the synthetic series with ATR Period , then form upperBand = src + factorATR and lowerBand = src - factorATR .
Apply classic trailing band and direction rules to produce Supertrend and trend state.
Because bars only come when there is sufficient participation, band touches and flips tend to align with meaningful pushes, not idle prints.
Reading the display
Synthetic Volume Bars - The non-uniform candles that represent equal information buckets. Expect more candles during active sessions and fewer during lulls.
Volume Sampled Supertrend - The main line. Green when Trend is 1, red when Trend is -1.
Markers - Small dots appear when a new synthetic sample is created, useful for aligning activity cycles.
Time Bars Overlay (optional) - Plot regular time candles to compare how the synthetic stream compresses quiet chop.
Settings you will use most
Data Settings
Sampling Method - Volume or Dollar Bars.
Rolling Lookback and Filter - Controls the dynamic threshold. Median is robust to outliers, Mean is smoother.
Use Fixed and Fixed Threshold - Force a constant bucket size for consistent sampling across regimes.
Max Stored Samples - Ring buffer limit for performance.
Indicator Settings
SMA over last N samples - A moving average computed on the synthetic close series. Can be hidden for a cleaner layout.
Supertrend Source - Price field from the synthetic candle.
ATR Period and Factor - Standard Supertrend controls applied on the synthetic series.
Visuals and UI
Show Synthetic Bars - Turn synthetic candles on or off.
Candle Color Mode - Green/Red, Volume Intensity, Neutral, or Adaptive.
Mark new samples - Puts a dot when a bucket closes.
Show Time Bars - Overlay regular candles for comparison.
Paint candles according to Trend - Colors chart candles using current synthetic Supertrend direction.
Line Width , Colors , and Stats Table toggles.
Some workflow notes:
Trend Following
Set Sampling Method = Volume, Filter = Median, and a reasonable Rolling Lookback so busy regimes produce more samples.
Trade in the direction of the Volume Sampled Supertrend. Because flips require real participation, you tend to avoid micro whipsaws seen on time bars.
Use the synthetic SMA as a bias rail and trailing reference for partials or re-entries.
Breakout and Continuation
Watch for rapid clustering of new sample markers and a clean flip of the synthetic Supertrend.
The compression of quiet time and expansion in busy bursts often makes breakouts more legible than on uniform time charts.
Mean Reversion
In instruments that oscillate, faded moves against the synthetic Supertrend are easier to time when the bucket cadence slows and Supertrend flattens.
Combine with the synthetic SMA and return statistics in the table for sizing and expectation setting.
Stats table (top right)
Method and Total Samples - Sampling regime and current synthetic history length.
Current Vol or Dollar and Threshold - Live bucket fill versus the trigger.
Bars in Bucket and Avg Bars per Sample - How much time data each synthetic bar tends to compress.
Avg Return and Return StdDev - Simple research metrics over synthetic close-to-close changes.
Why this reduces noise
Time based bars treat a 5 minute print with 1 percent of average participation the same as one with 300 percent. Volume sampling equalizes bar information content. By advancing the bar only when sufficient activity occurs, you skip low quality intervals that add variance but little signal. For banded systems like Supertrend, this often means fewer false flips and cleaner runs.
Notes and tips
Use Dollar Bars on assets where nominal price varies widely over time or across symbols.
Median filter can resist single burst outliers when setting dynamic thresholds.
If you need a stable research baseline, set Use Fixed and keep the threshold constant across tests.
Enable Show Time Bars occasionally to sanity check what the synthetic stream is compressing or stretching.
Link again for reference
Original Volume Based Sampling engine:
Bottom line
When you let participation set the clock, your Supertrend reacts to meaningful flow instead of idle prints. The result is a cleaner state machine, fewer micro whipsaws, and a trend read that respects when the market is actually trading.
Sampling

Volume Based Sampling [BackQuant]Volume Based Sampling
What this does
This indicator converts the usual time-based stream of candles into an event-based stream of “synthetic” bars that are created only when enough trading activity has occurred . You choose the activity definition:
Volume bars : create a new synthetic bar whenever the cumulative number of shares/contracts traded reaches a threshold.
Dollar bars : create a new synthetic bar whenever the cumulative traded dollar value (price × volume) reaches a threshold.
The script then keeps an internal ledger of these synthetic opens, highs, lows, closes, and volumes, and can display them as candles, plot a moving average calculated over the synthetic closes, mark each time a new sample is formed, and optionally overlay the native time-bars for comparison.
Why event-based sampling matters
Markets do not release information on a clock: activity clusters during news, opens/closes, and liquidity shocks. Event-based bars normalize for that heteroskedastic arrival of information: during active periods you get more bars (finer resolution); during quiet periods you get fewer bars (coarser resolution). Research shows this can reduce microstructure pathologies and produce series that are closer to i.i.d. and more suitable for statistical modeling and ML. In particular:
Volume and dollar bars are a common event-time alternative to time bars in quantitative research and are discussed extensively in Advances in Financial Machine Learning (AFML). These bars aim to homogenize information flow by sampling on traded size or value rather than elapsed seconds.
The Volume Clock perspective models market activity in “volume time,” showing that many intraday phenomena (volatility, liquidity shocks) are better explained when time is measured by traded volume instead of seconds.
Related market microstructure work on flow toxicity and liquidity highlights that the risk dealers face is tied to information intensity of order flow, again arguing for activity-based clocks.
How the indicator works (plain English)
Choose your bucket type
Volume : accumulate volume until it meets a threshold.
Dollar Bars : accumulate close × volume until it meets a dollar threshold.
Pick the threshold rule
Dynamic threshold : by default, the script computes a rolling statistic (mean or median) of recent activity to set the next bucket size. This adapts bar size to changing conditions (e.g., busier sessions produce more frequent synthetic bars).
Fixed threshold : optionally override with a constant target (e.g., exactly 100,000 contracts per synthetic bar, or $5,000,000 per dollar bar).
Build the synthetic bar
While a bucket fills, the script tracks:
o_s: first price of the bucket (synthetic open)
h_s: running maximum price (synthetic high)
l_s: running minimum price (synthetic low)
c_s: last price seen (synthetic close)
v_s: cumulative native volume inside the bucket
d_samples: number of native bars consumed to complete the bucket (a proxy for “how fast” the threshold filled)
Emit a new sample
Once the bucket meets/exceeds the threshold, a new synthetic bar is finalized and stored. If overflow occurs (e.g., a single native bar pushes you past the threshold by a lot), the code will emit multiple synthetic samples to account for the extra activity.
Maintain a rolling history efficiently
A ring buffer can overwrite the oldest samples when you hit your Max Stored Samples cap, keeping memory usage stable.
Compute synthetic-space statistics
The script computes an SMA over the last N synthetic closes and basic descriptors like average bars per synthetic sample, mean and standard deviation of synthetic returns, and more. These are all in event time , not clock time.
Inputs and options you will actually use
Data Settings
Sampling Method : Volume or Dollar Bars.
Rolling Lookback : window used to estimate the dynamic threshold from recent activity.
Filter : Mean or Median for the dynamic threshold. Median is more robust to spikes.
Use Fixed? / Fixed Threshold : override dynamic sizing with a constant target.
Max Stored Samples : cap on synthetic history to keep performance snappy.
Use Ring Buffer : turn on to recycle storage when at capacity.
Indicator Settings
SMA over last N samples : moving average in synthetic space . Because its index is sample count, not minutes, it adapts naturally: more updates in busy regimes, fewer in quiet regimes.
Visuals
Show Synthetic Bars : plot the synthetic OHLC candles.
Candle Color Mode :
Green/Red: directional close vs open
Volume Intensity: opacity scales with synthetic size
Neutral: single color
Adaptive: graded by how large the bucket was relative to threshold
Mark new samples : drop a small marker whenever a new synthetic bar prints.
Comparison & Research
Show Time Bars : overlay the native time-based candles to visually compare how the two sampling schemes differ.
How to read it, step by step
Turn on “Synthetic Bars” and optionally overlay “Time Bars.” You will see that during high-activity bursts, synthetic bars print much faster than time bars.
Watch the synthetic SMA . Crosses in synthetic space can be more meaningful because each update represents a roughly comparable amount of traded information.
Use the “Avg Bars per Sample” in the info table as a regime signal. Falling average bars per sample means activity is clustering, often coincident with higher realized volatility.
Try Dollar Bars when price varies a lot but share count does not; they normalize by dollar risk taken in each sample. Volume Bars are ideal when share count is a better proxy for information flow in your instrument.
Quant finance background and citations
Event time vs. clock time : Easley, López de Prado, and O’Hara advocate measuring intraday phenomena on a volume clock to better align sampling with information arrival. This framing helps explain volatility bursts and liquidity droughts and motivates volume-based bars.
Flow toxicity and dealer risk : The same authors show how adverse selection risk changes with the intensity and informativeness of order flow, further supporting activity-based clocks for modeling and risk management.
AFML framework : In Advances in Financial Machine Learning , event-driven bars such as volume, dollar, and imbalance bars are presented as superior sampling units for many ML tasks, yielding more stationary features and fewer microstructure distortions than fixed time bars. ( Alpaca )
Practical use cases
1) Regime-aware moving averages
The synthetic SMA in event time is not fooled by quiet periods: if nothing of consequence trades, it barely updates. This can make trend filters less sensitive to calendar drift and more sensitive to true participation.
2) Breakout logic on “equal-information” samples
The script exposes simple alerts such as breakout above/below the synthetic SMA . Because each bar approximates a constant amount of activity, breakouts are conditioned on comparable informational mass, not arbitrary time buckets.
3) Volatility-adaptive backtests
If you use synthetic bars as your base data stream, most signal rules become self-paced : entry and exit opportunities accelerate in fast markets and slow down in quiet regimes, which often improves the realism of slippage and fill modeling in research pipelines (pair this indicator with strategy code downstream).
4) Regime diagnostics
Avg Bars per Sample trending down: activity is dense; expect larger realized ranges.
Return StdDev (synthetic) rising: noise or trend acceleration in event time; re-tune risk.
Interpreting the info panel
Method : your sampling choice and current threshold.
Total Samples : how many synthetic bars have been formed.
Current Vol/Dollar : how much of the next bucket is already filled.
Bars in Bucket : native bars consumed so far in the current bucket.
Avg Bars/Sample : lower means higher trading intensity.
Avg Return / Return StdDev : return stats computed over synthetic closes .
Research directions you can build from here
Imbalance and run bars
Extend beyond pure volume or dollar thresholds to imbalance bars that trigger on directional order flow imbalance (e.g., buy volume minus sell volume), as discussed in the AFML ecosystem. These often further homogenize distributional properties used in ML. alpaca.markets
Volume-time indicators
Re-compute classical indicators (RSI, MACD, Bollinger) on the synthetic stream. The premise is that signals are updated by traded information , not seconds, which may stabilize indicator behavior in heteroskedastic regimes.
Liquidity and toxicity overlays
Combine synthetic bars with proxies of flow toxicity to anticipate spread widening or volatility clustering. For instance, tag synthetic bars that surpass multiples of the threshold and test whether subsequent realized volatility is elevated.
Dollar-risk parity sampling for portfolios
Use dollar bars to align samples across assets by notional risk, enabling cleaner cross-asset features and comparability in multi-asset models (e.g., correlation studies, regime clustering). AFML discusses the benefits of event-driven sampling for cross-sectional ML feature engineering.
Microstructure feature set
Compute duration in native bars per synthetic sample , range per sample , and volume multiple of threshold as inputs to state classifiers or regime HMMs . These features are inherently activity-aware and often predictive of short-horizon volatility and trend persistence per the event-time literature. ( Alpaca )
Tips for clean usage
Start with dynamic thresholds using Median over a sensible lookback to avoid outlier distortion, then move to Fixed thresholds when you know your instrument’s typical activity scale.
Compare time bars vs synthetic bars side by side to develop intuition for how your market “breathes” in activity time.
Keep Max Stored Samples reasonable for performance; the ring buffer avoids memory creep while preserving a rolling window of research-grade data.

Mean Price
^^ Plotting switched to Line.
This method of financial time series (aka bars) downsampling is literally, naturally, and thankfully the best you can do in terms of maximizing info gain. You can finally chill and feed it to your studies & eyes, and probably use nothing else anymore.
(HL2 and occ3 also have use cases, but other aggregation methods? Not really, even if they do, the use cases are ‘very’ specific). Tho in order to understand why, you gotta read the following wall, or just believe me telling you, ‘I put it on my momma’.
The true story about trading volumes and why this is all a big misdirection
Actually, you don’t need to be a quant to get there. All you gotta do is stop blindly following other people’s contextual (at best) solutions, eg OC2 aggregation xD, and start using your own brain to figure things out.
Every individual trade (basically an imprint on 1D price space that emerges when market orders hit the order book) has several features like: price, time, volume, AND direction (Up if a market buy order hits the asks, Down if a market sell order hits the bids). Now, the last two features—volume and direction—can be effectively combined into one (by multiplying volume by 1 or -1), and this is probably how every order matching engine should output data. If we’re not considering size/direction, we’re leaving data behind. Moreover, trades aren’t just one-price dots all the time. One trade can consume liquidity on several levels of the order book, so a single trade can be several ticks big on the price axis.
You may think now that there are no zero-volume ticks. Well, yes and no. It depends on how you design an exchange and whether you allow intra-spread trades/mid-spread trades (now try to Google it). Intra-spread trades could happen if implemented when a matching engine receives both buy and sell orders at the same microsecond period. This way, you can match the orders with each other at a better price for both parties without even hitting the book and consuming liquidity. Also, if orders have different sizes, the remaining part of the bigger order can be sent to the order book. Basically, this type of trade can be treated as an OTC trade, having zero volume because we never actually hit the book—there’s no imprint. Another reason why it makes sense is when we think about volume as an impact or imbalance act, and how the medium (order book in our case) responds to it, providing information. OTC and mid-spread trades are not aggressive sells or buys; they’re neutral ticks, so to say. However huge they are, sometimes many blocks on NYSE, they don’t move the price because there’s no impact on the medium (again, which is the order book)—they’re not providing information.
... Now, we need to aggregate these trades into, let’s say, 1-hour bars (remember that a trade can have either positive or negative volume). We either don’t want to do it, or we don’t have this kind of information. What we can do is take already aggregated OHLC bars and extract all the info from them. Given the market is fractal, bars & trades gotta have the same set of features:
- Highest & lowest ticks (high & low) <- by price;
- First & last ticks (open & close) <- by time;
- Biggest and smallest ticks <- by volume.*
*e.g., in the array ,
2323: biggest trade,
-1212: smallest trade.
Now, in our world, somehow nobody started to care about the biggest and smallest trades and their inclusion in OHLC data, while this is actually natural. It’s the same way as it’s done with high & low and open & close: we choose the minimum and maximum value of a given feature/axis within the aggregation period.
So, we don’t have these 2 values: biggest and smallest ticks. The best we can do is infer them, and given the fact the biggest and smallest ticks can be located with the same probability everywhere, all we can do is predict them in the middle of the bar, both in time and price axes. That’s why you can see two HL2’s in each of the 3 formulas in the code.
So, summed up absolute volumes that you see in almost every trading platform are actually just a derivative metric, something that I call Type 2 time series in my own (proprietary ‘for now’) methods. It doesn’t have much to do with market orders hitting the non-uniform medium (aka order book); it’s more like a statistic. Still wanna use VWAP? Ok, but you gotta understand you’re weighting Type 1 (natural) time series by Type 2 (synthetic) ones.
How to combine all the data in the right way (khmm khhm ‘order’)
Now, since we have 6 values for each bar, let’s see what information we have about them, what we don’t have, and what we can do about it:
- Open and close: we got both when and where (time (order) and price);
- High and low: we got where, but we don’t know when;
- Biggest & smallest trades: we know shit, we infer it the way it was described before.'
By using the location of the close & open prices relative to the high & low prices, we can make educated guesses about whether high or low was made first in a given bar. It’s not perfect, but it’s ultimately all we can do—this is the very last bit of info we can extract from the data we have.
There are 2 methods for inferring volume delta (which I call simply volume) that are presented everywhere, even here on TradingView. Funny thing is, this is actually 2 parts of the 1 method. I wonder how many folks see through it xD. The same method can be used for both inferring volume delta AND making educated guesses whether high or low was made first.
Imagine and/or find the cases on your charts to understand faster:
* Close > open means we have an up bar and probably the volume is positive, and probably high was made later than low.
* Close < open means we have a down bar and probably the volume is negative, and probably low was made later than high.
Now that’s the point when you see that these 2 mentioned methods are actually parts of the 1 method:
If close = open, we still have another clue: distance from open/close pair to high (HC), and distance from open/close pair to low (LC):
* HC < LC, probably high was made later.
* HC > LC, probably low was made later.
And only if close = open and HC = LC, only in this case we have no clue whether high or low was made earlier within a bar. We simply don’t have any more information to even guess. This bar is called a neutral bar.
At this point, we have both time (order) and price info for each of our 6 values. Now, we have to solve another weighted average problem, and that’s it. We’ll weight prices according to the order we’ve guessed. In the neutral bar case, open has a weight of 1, close has a weight of 3, and both high and low have weights of 2 since we can’t infer which one was made first. In all cases, biggest and smallest ticks are modeled with HL2 and weighted like they’re located in the middle of the bar in a time sense.
P.S.: I’ve also included a "robust" method where all the bars are treated like neutral ones. I’ve used it before; obviously, it has lesser info gain -> works a bit worse.
Papercuts Time Sampled Higher Timeframe EMA Without SecurityThis EMA uses a higher time sampled method instead of using security to gather higher timeframe data.
Its quite fast and worked well with the timeframes prescribed, up to 8hrs, after 8hrs, the formatting gets more complicated and i probably wouldn't use it anyway.
You can use this as a guide to avoid security and even f_security with this method.
NOTE: This includes the non repainting f_security call so that i woudl be able to check my results against what it does, thats not nessecary to keep at all.
There is some minor differences in data, but its so minor it doesnt bother me, though it would be interesting to know what the difference actually is. If anyone figures that out, leave a comment and let me know!
This is meant to be an example for others to build and learn and play with.. so enjoy!

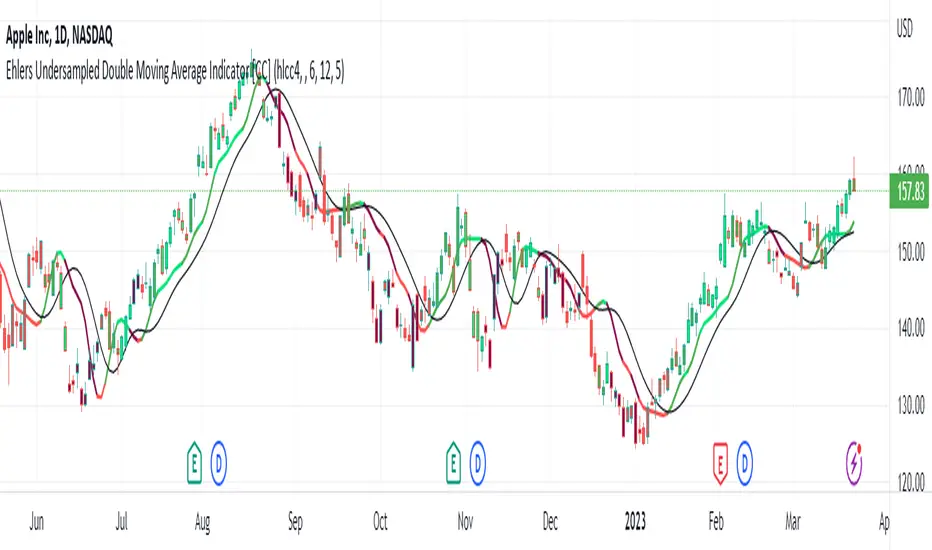
Ehlers Undersampled Double Moving Average Indicator [CC]The Undersampled Double Moving Average was created by John Ehlers (Stocks and Commodities April 2023), and this is a double moving average system which is pretty rare for John Ehlers. For those of you who would like my other take on an Ehlers double moving average, be sure to check out my previous Ehlers double moving average script . He came up with a unique idea for this indicator to create a moving average using a sample of the price data. For example, we use his suggested length of 5 only to use the price data every 5 bars. Feel free to change this, and please let me know if you find a length that works better. He then smooths the indicator using the Hann Windowed Moving Average . I color-coded the lines to show stronger signals in darker colors or standard signals in lighter colors. Buy when the line turns green and sell when it turns red.
Let me know if there is an indicator or script you would like to see me publish!
occ3aka weighted fair price
The ultimate price source for all your stuff, unless you go completely nuts.
The ultimate way to build line charts & do pattern trading, unless you go completely nuts.
Why occ3?
You need a one-point estimate for every bar, a typical price of every bar aye? But then you see that every bar has a different distribution of prices. You can drop a stat test on every bar and pick median, mean, or whatever. But that's still prone to error (imagine borderline cases).
Instead, you can transform the task into a geometric one and say, "I wanna find the center of mass of all dem ticks within a particular interval (a day, a week, a century)". But lol ofc you won't do it, so lets's estimate it:
1) a straight line from Open to Close more/less estimates a regression line if you woulda dropped regression on all the ticks within a given interval;
2) centroid always lies on regression line, so it's always in between the endpoints of regression line. So that's why (open + close) /2;
3) Then, you remember that sequence matters, + generally the volume is higher near the close, so...;
4) Voila, (open + close + close) / 3
Why "fair" price?
Take a daily bar:
1) High & low were the best prices to sell & buy;
2) Opening & closing auctions had acceptable prices, in exchange for the the biggest potential to transact serious volume;
3) "Fair" price, logically, is somewhere in between the acceptable prices;
4) Market is fractal => the same principles propagate everywhere;
4) No, POCs and VPOCs don't make much sense as fair prices.
Nothing else to say, really advise to use it as a line chart if you trade price patterns.
