[Greeny] RTH Only Naked VPOCWhat it does
Calculates and displays daily Volume Point of Control (VPOC) levels based on RTH (Regular Trading Hours) session only. Tracks which VPOCs remain "naked" (untouched) and which have been hit - but only counts hits during RTH hours, ignoring overnight/globex touches.
Key Features
One VPOC per trading day calculated from entire RTH session volume profile
RTH-only hit detection - levels only marked as hit when touched during RTH, not overnight
Works on all timeframes - daily, hourly, or any chart timeframe
Volume-based filtering - automatically skips low-liquidity sessions (pre-front-month contract data)
Visual markers - small dash on origin bar shows where each VPOC was, even after being hit
Visual Guide
Yellow dashed line - Naked VPOC (not yet touched during RTH)
White dashed line - Hit VPOC (was touched during RTH)
Small dash on candle - POC origin marker
Settings
Display options: Toggle to show only naked POCs, customize hit/naked colors, adjust line width and style (solid/dashed/dotted), enable/disable line extension and origin markers.
RTH Session: Configure start and end time in NY timezone. Default is 9:30-16:00 (US equity market hours), which equals 15:30-22:00 Budapest time.
Advanced: Adjust volume profile resolution (default 250 bins), data source timeframe for calculations (5min recommended for daily charts), and minimum volume threshold to filter out low-liquidity sessions like pre-rollover contract data (default 10% of average).
Best For
ES/MES, NQ/MNQ futures traders
Mean reversion strategies using VPOC as support/resistance
Auction Market Theory practitioners
Anyone wanting clean RTH-only volume profile levels
Note on Contract Rollovers
When using specific contract symbols (e.g., ESH2026 instead of ES1!), the script may show many naked VPOCs from months before the contract became active. This happens because futures contracts have very low liquidity before becoming the front-month, creating unreliable VPOCs with gaps that never get hit. The volume filter helps reduce this, but you may need to increase the "Min Volume % of Average" setting or simply ignore older levels when viewing back-month data.
RTH

RTH vs ETH Candle StylingRTH vs ETH Candle Styling — Clean Session-Based Candle Filters
This indicator restyles the chart’s candles based on session type:
🟩 RTH (Regular Trading Hours — 09:30 to 16:00 EST)
RTH candles display normal, full-color price action, showing momentum clearly during the primary US session.
⬛ ETH (Extended Hours Trading)
All ETH candles are converted into hollow, black-outline candles, with:
Transparent bodies
Black borders
Black wicks
This creates an immediate visual separation between overnight price action (ETH) and the high-liquidity RTH session—reducing noise and helping traders focus on true market structure.
🔥 Why Use This?
Cleaner chart during overnight chop
Easy to distinguish RTH orderflow from ETH drift
Enhances gap logic, session deviations, and liquidity mapping
Makes your main RTH setups stand out instantly
⚙ Inputs
Adjustable RTH session (default: 09:30–16:00 EST)
Adjustable timezone (default: America/New_York)
GLOBAL SETTINGS TO CHANGE-Change-settings-symbol-candles-uncheck all

Dual Session VWAPSeparate VWAP with 1 standard deviation band for the regular session as well as electronic session

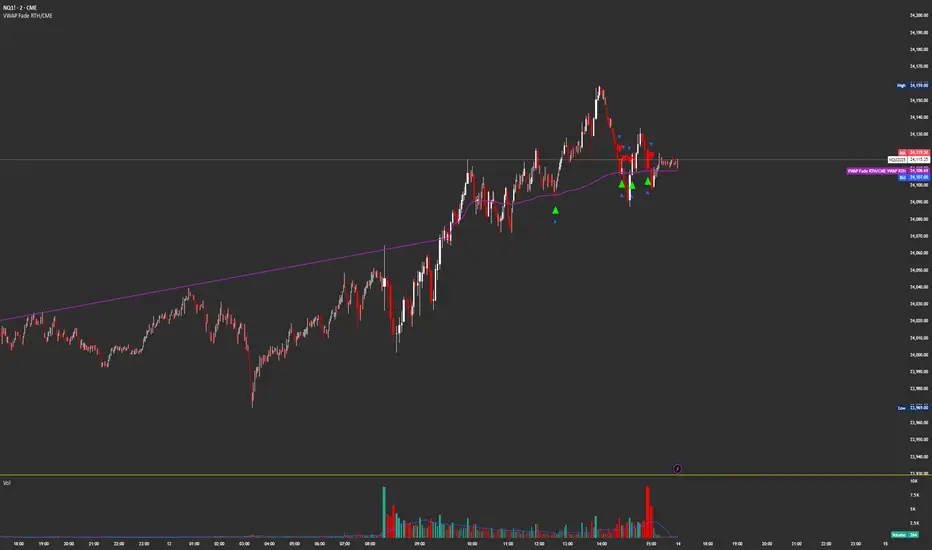
VWAP Fade RTHSame as
Except this version only updates during CME Regular Trading Hours
9:30 AM NY/EST -4 PM NY/EST
RTH Levels: VWAP + PDH/PDL + ONH/ONL + IBAlgo Index — Levels Pro (ONH/ONL • PDH/PDL • VWAP±Bands • IB • Gaps)
Purpose. A session-aware, non-repainting levels tool for intraday decision-making. Designed for futures and indices, with clean visuals, alerts, and a one-click Minimal Mode for screenshot-ready charts.
What it plots
• PDH/PDL (RTH-only) – Prior Regular Trading Hours high/low, computed intraday and frozen at the RTH close (no 24h mix-ups, no repainting).
• ONH/ONL – Prior Overnight high/low, held throughout RTH.
• RTH VWAP with ±σ bands – Volume-weighted variance, reset each RTH.
• Initial Balance (IB) – First N minutes of RTH, plus 1.5× / 2.0× extensions after IB completes.
• Today’s RTH Open & Prior RTH Close – With gap detection and “gap filled” alert.
• Killzone shading – NY Open (09:30–10:30 ET) and Lunch (11:15–13:30 ET).
• Values panel (top-right) – Each level with live distance in points & ticks.
• Right-edge level tags – With anti-overlap (stagger + vertical jitter).
• Price-scale tags – Native trackprice markers that always “stick” to the axis.
⸻
New in v6.4
• Minimal Mode: one click for a clean look (thinner lines, VWAP bands/IB extensions hidden, on-chart right-edge labels off; price-scale tags remain).
• Theme presets: Dark Hi-Contrast / Light Minimal / Futures Classic / Muted Dark.
• Anti-overlap controls: horizontal staggering, vertical jitter, and baseline offset to keep tags readable even when levels cluster.
⸻
Quick start (2 minutes)
1. Add to chart → keep defaults.
2. Sessions (ET):
• RTH Session default: 09:30–16:00 (US equities cash hours).
• Overnight Session default: 18:00–09:29.
Adjust for your market if you use different “day” hours (e.g., many use 08:20–13:30 ET for COMEX Gold).
3. Theme & Minimal Mode: pick a Theme Preset; enable Minimal Mode for screenshots.
4. Visibility: toggle PD/ON/VWAP/IB/References/Panel to taste.
5. Right-edge labels: turn Show Right-Edge Labels on. If they crowd, tune:
• Anti-overlap: min separation (ticks)
• Horizontal offset per tag (bars)
• Vertical jitter per step (ticks)
• Right-edge baseline offset (bars)
6. Alerts: open Add alert → Condition: and pick the events you want.
⸻
How levels are computed (no repainting)
• PDH/PDL: Intraday H/L are accumulated only while in RTH and saved at RTH close for “yesterday’s” values.
• ONH/ONL: Accumulated across the defined Overnight window and then held during RTH.
• RTH VWAP & ±σ: Volume-weighted mean and standard deviation, reset at the RTH open.
• IB: First N minutes of RTH (default 60). Extensions (1.5×/2.0×) appear after IB completes.
• Gaps: Today’s RTH open vs prior RTH close; “Gap Filled” triggers when price trades back to prior close.
⸻
Practical playbooks (how to trade around the levels)
1) PDH/PDL interactions
• Rejection: Price taps PDH/PDL then closes back inside → mean-reversion toward VWAP/IB.
• Acceptance: Close/hold beyond PDH/PDL with momentum → continuation to next HTF/IB target.
• Alert: PD Touch/Break.
2) ONH/ONL “taken”
• Often one ON extreme is taken during RTH. ONH Taken / ONL Taken → check if it’s a clean break or sweep & reclaim.
• Sweep + reclaim near VWAP can fuel rotations through the ON range.
3) VWAP ±σ framework
• Balanced: First tag of ±1σ often reverts toward VWAP.
• Trend: Persistent trade beyond ±1σ + IB break → target ±2σ/±3σ.
• Alerts: VWAP Cross and VWAP Reject (cross then immediate fail back).
4) IB breaks
• After IB completes, a clean IB break commonly targets 1.5× and sometimes 2.0×.
• Quick return inside IB = possible fade back to the opposite IB edge/VWAP.
• Alerts: IB Break Up / Down.
5) Gaps
• Gap-and-go: Opening drive away from prior close + VWAP support → trend until IB completion.
• Gap-fill: Weak open and VWAP overhead/underfoot → trade toward prior close; manage on Gap Filled alert.
Pro tip: Stack confluences (e.g., ONL sweep + VWAP reclaim + IB hold) and respect your execution rules (e.g., require a 5-minute close in direction, or your order-flow confirmation).
⸻
Inputs you’ll actually touch
• Sessions (ET): Session Timezone, RTH Session, Overnight Session.
• Visibility: toggles for PD/ON/VWAP/IB/Ref/Panel.
• VWAP bands: set σ multipliers (±1/±2/±3).
• IB: duration (minutes) and extension multipliers (1.5× / 2.0×).
• Style & Theme: Theme Preset, Main Line Width, Trackprice, Minimal Mode, and anti-overlap controls.
⸻
Alerts included
• PD Touch/Break — High ≥ PDH or Low ≤ PDL
• ONH Taken / ONL Taken — First in-RTH take of ONH/ONL
• VWAP Cross — Close crosses VWAP
• VWAP Reject — Cross then immediate fail back
• IB Break Up / Down — Break of IB High/Low after IB completes
• Gap Filled — Price trades back to prior RTH close
Setup: Add alert → Condition: Algo Index — Levels Pro → choose event → message → Notify on app/email.
⸻
Panel guide
The top-right panel shows each level plus live distance from last price:
LevelValue (Δpoints | Δticks)
Coloring: green if level is below current price, red if above.
⸻
Styling & screenshot tips
• Use Theme Preset that matches your chart.
• For dark charts, “Dark Hi-Contrast” with Main Line Width = 3 works well.
• Enable Trackprice for crisp axis tags that always stick to the right edge.
• Turn on Minimal Mode for cleaner screenshots (no VWAP bands or IB extensions, on-chart tags off; price-scale tags remain).
• If tags crowd, increase min separation (ticks) to 30–60 and horizontal offset to 3–5; add vertical jitter (4–12 ticks) and/or push tags farther right with baseline offset (bars).
⸻
Behavior & limitations
• Levels are computed incrementally; tables refresh on the last bar for efficiency.
• Right-edge labels are placed at bar_index + offset and do not track extra right-margin scrolling (TradingView limitation). The price-scale tags (from trackprice) do track the axis.
• “RTH” is what you define in inputs. If your market uses different day hours, change the session strings so PDH/PDL reflect your definition of “yesterday’s session.”
⸻
FAQ
Q: My PDH/PDL don’t match the daily chart.
A: By design this uses RTH-only highs/lows, not 24h daily bars. Adjust sessions if you want a different definition.
Q: Right-edge tags overlap or don’t sit at the far right.
A: Increase min separation / horizontal offset / vertical jitter and/or push tags farther with baseline offset. If you want markers that always hug the axis, rely on Trackprice.
Q: Can I change killzones?
A: Yes—edit the session strings in settings or request a version with user inputs for custom windows.
⸻
Disclaimer
Educational use only. This is not financial advice. Always apply your own risk management and confirmation rules.
⸻
Enjoy it? Please ⭐ the script and share screenshots using Minimal Mode + a Theme Preset that fits your style.

Zen FDAX Session📝 Description
OVERVIEW
The Zen FDAX Session indicator highlights periods outside the regular trading hours of the FDAX (DAX Futures) on the Xetra exchange. It shades the chart background during non-trading hours, aiding traders in distinguishing active market periods from inactive ones.
FUNCTIONALITY
Customizable Trading Hours: Users can define the session's start and end times in UTC, allowing flexibility to match personal trading schedules or account for daylight saving changes.
Visual Clarity: The indicator applies a subtle background color to non-trading hours, ensuring clear demarcation without obscuring price data.
Time Zone Awareness: Designed with UTC inputs to maintain consistency across different user time zones.
USAGE
Add the Indicator: Apply the "Zen FDAX Session" indicator to your chart.
Set Trading Hours: Input your desired session start and end times in UTC.
Interpret the Shading: Areas with shaded backgrounds represent times outside your defined trading session.
Note: This indicator does not generate buy/sell signals but serves as a visual aid to identify trading sessions.

Futures Open/High/Low TablesAdds (up to) 3 tables to a chart, displaying Open/High/Low data for today (RTH and extended hours), yesterday, and the current week / month -- to help with intraday analysis of a futures ticker.
The tables only appear on intraday charts (5min, 30min, etc). On a Daily/Weekly/etc chart they are not calculated or shown.
In addition to Open/High/Low, the "Current" table in the top-right shows a live measurement of # of points from the open, the RTH open, and the highs/lows.
Lastly, the 9:30am ET open and the 4pm RTH close are by default marked with a shaded background (on intraday charts) for easy visual reference, and also to help with adjusting the session time to accommodate time zone issues if they occur.
Tested on ES in Eastern Time Zone, but should work on any futures instrument and any time zone by adjusting the Session Time setting.

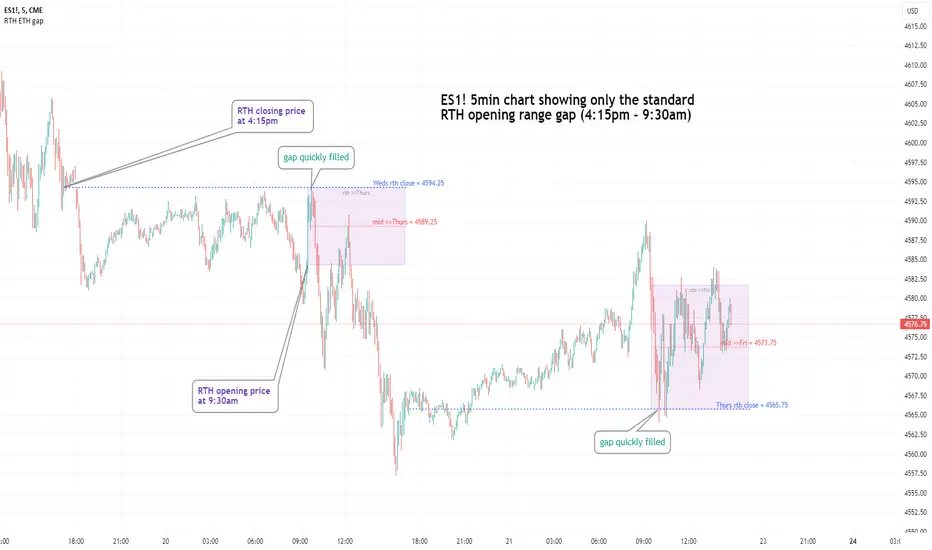
Opening Range Gap + Std Dev [starclique]The ICT Opening Range Gap is a concept taught by Inner Circle Trader and is discussed in the videos: 'One Trading Setup For Life' and 2023 ICT Mentorship - Opening Range Gap Repricing Macro
ORGs, or Opening Range Gaps, are gaps that form only on the Regular Trading Hours chart.
The Regular Trading Hours gap occurs between 16:15 PM - 9:29 AM EST (UTC-4)
These times are considered overnight trading, so it is useful to filter the PA (price action) formed there.
The RTH option is only available for futures contracts and continuous futures from CME Group.
To change your chart to RTH, first things first, make sure you’re looking at a futures contract for an asset class, then on the bottom right of your chart, you’ll see ETH (by default) - Click on that, and change it to RTH.
Now your charts are filtering the price action that happened overnight.
To draw out your gap, use the Close of the 4:14 PM candle and the open of the 9:30 AM candle.
How is this concept useful?
Well, It can be used in many ways.
---
How To Use The ORG
One of the ways you can use the opening range gap is simply as support and resistance
If we extend out the ORG from the example above, we can see that there is a clean retest of the opening range gap high after breaking structure to the upside and showing acceptance outside of the gap after consolidating within it.
The ORG High (4:14 Candle Close in this case) was used as support.
We then see an expansion to the upside.
Another way to implement the ORG is by using it as a draw on liquidity (magnet for price)
In this example, if we looked to the left, there was a huge ORG to the downside, leaving a massive gap.
The market will want to rebalance that gap during the regular trading hours.
The market rallies higher, rejects, comes down to clear the current days ORG low, then closes.
That is one example of how you can combine liquidity & ICT market structure concepts with Opening Range Gaps to create a story in the charts.
Now let’s discuss standard deviations.
---
Standard Deviations
Standard Deviations are essentially projection levels for ranges / POIs (Point of Interests)
By this I mean, if you have a range, and you would like to see where it could potentially expand to, you’d place your fibonacci retracement tool on and high and low of the range, then use extension levels to find specific price points where price might reject from.
Since 0 and 1 are your Range High and Low respectively, your projection levels would be something like 1.5, 2, 2.5, and 3, for the extension from your 1 Fib Level, and -0.5, -1, -1.5, and -2 for your 0 Fib level.
The -1 and 2 level produce a 1:1 projection of your range low and high, meaning, if you expect price to expand as much as it did from the range low to range high, then you can project a -1 and 2 on your Fib, and it would show you what ICT calls “symmetrical price”
Now, how are standard deviations relevant here?
Well, if you’ve been paying attention to ICT’s recent videos, you would’ve caught that he’s recently started using Standard Deviation levels on breakers.
So my brain got going while watching his video on ORGs, and I decided to place the fib on the ORG high and low and see what it’d produce.
The results were very interesting.
Using this same example, if we place our fib on the ORG High and Low, and add some projection levels, we can see that we rejected right at the -2 Standard Deviation Level.
---
You can see that I also marked out the EQ (Equilibrium, 50%, 0.5 of Fib) of the ORG. This is because we can use this level as a take profit level if we’re using an old ORG as our draw.
In days like these, where the gap formed was within a consolidation, and it continued to consolidate within the ORG zone that we extended, we can use the EQ in the same way we’d use an EQ for a range.
If it’s showing acceptance above the EQ, we are bullish, and expect the high of the ORG to be tapped, and vice versa.
---
Using The Indicator
Here’s where our indicator comes in play.
To avoid having to do all this work of zooming in and marking out the close and open of the respective ORG candles, we created the Opening Range Gap + Standard Deviations Indicator, with the help of our dedicated Star Clique coder, a1tmaniac.
With the ORG + STD DEV indicator, you will be able to view ORG’s and their projections on the ETH (Electronic Trading Hours) chart.
---
Features
Range Box
- Change the color of your Opening Range Gap to your liking
- Enable or disable the box from appearing using the checkbox
Range Midline
- Change the color of your Opening Range Gap Equilibrium
- Enable or disable the midline from appearing using the checkbox
Std. Dev
- Add whichever standard deviation levels you’d like.
- By default, the indicator comes with 0.5, 1, 1.5, and 2 standard deviation levels.
- Ensure that you add a comma ( , ) in between each standard deviation level
- Enable or disable the standard deviations from appearing using the opacity of the color (change to 0%)
Labels / Offset
- Adjust the offset of the label for the Standard Deviations
- Enable or disable the Labels from appearing using the checkbox
Time
- Adjust the time used for the indicators range
- If you’d like to use this for a Session or ICT Killzone instead, adjust the time
- Adjust the timezone used for the time referenced
- Options are UTC, US (UTC-4, New York Local Time) or UK (UTC+1, London Time)
- By default, the indicator is set to US

30 Second Futures Session Open RangeThis indicator displays 30 second opening ranges from Globex, Europe, and RTH sessions.
From the RTH session range, it also displays infinitely generating Price Targets based on a % of the opening range size.
I am retrieving the 30 second data using the new "request.security_lower_tf()" function.
The importance of these levels is based on the idea that when the market opens, algorithms establish their positions within the first 30 seconds.
These areas can also be seen as potential areas of support and resistance throughout the sessions.
Enjoy!

Regular vs Electronic Trading hours Gap (RTH vs ETH); 4pm-9:30am-Shows the gap between 4pm close and 9:30am open; the Regular trading hours Vs Electronic trading hours Gap (RTH vs ETH).
-Displays this as a box starting at 9:30am, whose bottom is the 9:30am open; top is previous day's 4pm close.
-Displays when chart is toggled to either of ETH or RTH.
-Useful reminder of area above/below opening bell price that price often has a tendency to want to fill in, partially or fully
--(all times here refer to America/New_York timezone)
//Options:
~Number of past boxes to show
~Extend boxes fully to the right
~Box background color, border color, and opacities
//Limitations:
-works only on timeframes 30mins or lower (works on 1,2,5,10,15,30minutes)
-will not work on non-typical low timeframes (like 4min or 7min) since they are not divisible into 30
rth vwap and midMidpoint and VWAP are often important inflection points in daytrading. I managed to find a script providing me with a 24 hour session midline by NorthStarDayTrading and a RTH VWAP script by LDBC. So I decided to merge those two to get a RTH mid and vwap.


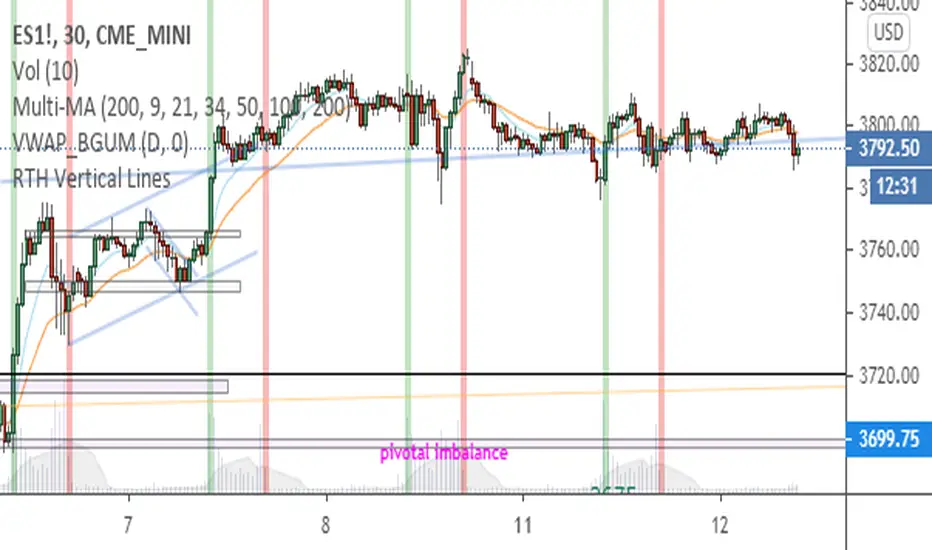
Real Trading Hours - Vertical Lines - Mark RTH for Futures 12/Jan/2021 09:15 AM AUTHOR: Brandon Gum
--
Updated script to plot vertical lines for open and close of futures.
Not sure why the 8:30 and 15:00 times had to be used over 9:30 or 16:00
Only plots for products of type futures. - Could be easily expanded to work with cryptos as well if you wanted.
======================