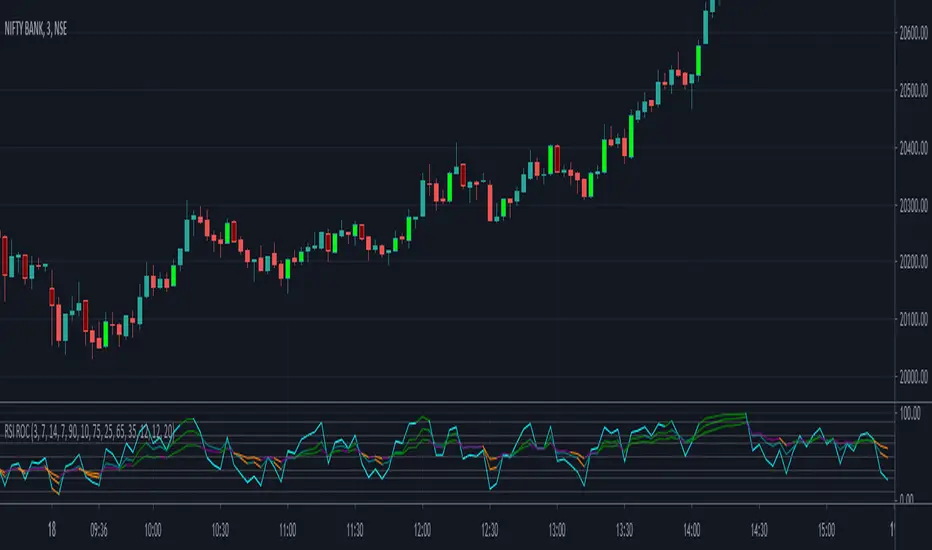
WC-Index Intraday- RSI Based Research Model🔍 Strategy Overview
This is an index-focused intraday research strategy designed around RSI behavior and multi-timeframe RSI confirmation.
The model studies intraday momentum exhaustion and pullback zones using confirmed RSI conditions, while maintaining strict time and trade discipline.
Note: EMA indicators, if displayed on the chart, are used only for visual reference and are not part of the trade entry or exit logic.
🧠 Core Logic
Trade decisions are based on:
RSI of the current timeframe
Confirmed 15-minute RSI values
Multiple internal RSI research models (BUY / SELL variants) are used to classify intraday setups
Signals are generated only after candle confirmation
A single active trade framework is enforced using a global trade lock
Automatic End-of-Day exit is applied to avoid overnight exposure
⏰ Trading Conditions
Instrument: Index (tested on intraday timeframes such as 5-minute)
Trading Style: Intraday only
Time Window: 09:15 AM to 03:15 PM (IST)
No overnight positions
No averaging or pyramiding
⚙️ Technical Integrity
Uses barstate.isconfirmed
Uses lookahead = barmerge.lookahead_off
Strategy does not repaint
Backtest results may vary depending on instrument, timeframe, market volatility, and execution conditions
⚠️ Risk & Usage Notice
This strategy is intended strictly for educational and research purposes only.
Use of this research model requires an understanding of RSI behavior, intraday volatility, and risk management.
🛡️ Disclaimer
Investment in securities market are subject to market risks. Read all the related documents carefully before investing.
This strategy does not constitute investment advice, trading advice, or a recommendation.
Backtest results are based on historical data and do not represent actual trading performance.
Past performance is not indicative of future results.
Users are solely responsible for their trading decisions and risk management.
The securities quoted here are for illustration only and are not recommendatory.
🔗 wealthconsultant.in/disclaimer/
Rsimtf

RSI Bands + Levels (Miu)This indicator was designed to plot lines from prices of overbought (OB) and oversold (OS) RSI levels in chart. It will also create a visible band between these levels.
It's main utility is to show in chart current and past prices for OB/OS RSI levels. Traditionally the RSI is considered overbought when above 70 and oversold when below 30 but you can customize these values in settings. The RSI oscillates between zero and 100.
Users can easily identify overbought and oversold prices using this indicator and then it is expected to help users to make better strategic decisions with their trades.
There are some extra options available in settings:
- Customizable RSI levels
- Customizable RSI length
- RSI Levels: if activated, it will draw lines above OB line and below OS line according to the multiplier, so it will plot sequential lines that goes in different RSI levels (e.g: RSI 72, 74, 76, 78 and 80).
- Backgroud only: it will remove these lines and keep only a backgroung color instead
- RSI 50: it will draw a line as RSI 50
- Customizable multiplier
Enjoy!

RSI MTF Ob+OsHello Traders,
This indicator use the same concept as my previous indicator "CCI MTF Ob+Os".
It is a simple "Relative Strength Index" ( RSI ) indicator with multi-timeframe (MTF) overbought and oversold level.
It can detect overbought and oversold level up to 5 timeframes, which help traders spot potential reversal point more easily.
There are options to select 1-5 timeframes to detect overbought and oversold.
Aqua Background is "Oversold" , looking for "Long".
Orange Background is "Overbought" , looking for "Short".
Have fun :)

RSI - Rate of ChangeCode based on RSI lower value crossing over higher value
RSI Rate of Change of different lengths used in all parts of code
ADX and CCI use is limited in V1.0
Script provides 3 RSIs and overbrought and oversold for each of these RSIs. When RSI cross over each other clearly Buy and Sell signals are fired.
Lime is buy and Maroon means sell. Use it along with EMA