Waldo RSI :oWaldo RSI :o Indicator Guide
The Waldo RSI :o indicator is designed to complement the "Waldo RSI Overlay :o" by providing an RSI-based analysis on TradingView, focusing on macro shifts in market trends. Here's a comprehensive guide on how to use this indicator:
Key Features:
RSI Settings:
RSI Source: Choose from ON RSI, ON HIGH, ON LOW, ON CLOSE, or ON OPEN to determine how RSI calculates pivots.
RSI Settings:
Source: Default is (H+L)/2, but you can select any price for RSI calculation.
Length: Default RSI length is 7, which can be adjusted for sensitivity.
Trend Lines:
Show Trend Lines: Option to display trend lines based on RSI pivot points.
Zigzag Length: Determines pivot point sensitivity.
Confirm Length: Validates pivot points (default is 3).
Colors: Customize colors for Higher Highs (HH), Lower Highs (LH), Higher Lows (HL), and Lower Lows (LL) on the RSI.
Label Size and Line Width: Adjust the appearance of labels and lines.
Divergences:
Classic Divergences:
Show Classic Div: Toggle to reveal divergences where RSI and price move in opposite directions.
Colors: Set different colors for bullish and bearish divergence indicators.
Transparency and Line Width: Control the visual impact of divergence signals.
Hidden Divergences:
Similar settings for identifying hidden divergences, suggest trend continuation.
Breakout/Breakdown:
Show Breakout/Breakdown: Generates signals for RSI breakouts or breakdowns, used by "Waldo RSI Overlay :o" for visual chart signals.
Overbought/Oversold Zones:
Show Overbought and OverSold Zones: Highlights when RSI goes above 70 (overbought) or below 30 (oversold).
Moving Averages on RSI:
The default Moving Average (MA) settings are tailored to capture macro shifts in market trends:
Show Moving Averages: Option to overlay two MAs on the RSI for trend confirmation:
Fast RSI MA:
RSI Period: 50 (this is the period over which the RSI is calculated).
MA Length: 50 (the number of periods used for the moving average of the RSI).
Slow RSI MA:
RSI Period: 50 (same as fast for consistency in RSI calculation).
MA Length: 200 (longer term for capturing broader trends).
Crossover Signals: The RSI changes color from red to green based on these moving average crossovers:
When the Fast MA (50 period) crosses above the Slow MA (200 period), the RSI turns green, indicating potential bullish conditions or momentum shift.
Conversely, when the Fast MA crosses below the Slow MA, the RSI turns red, suggesting bearish conditions or a shift back towards a downtrend.
This 50-period RSI crossover setting is used to identify overall macro shifts in the market, providing a clear visual cue for traders looking at longer-term trends.
Ghost Lines (Optional):
Ghost Lines: Option to limit how far RSI trend lines extend, helping to keep the chart less cluttered.
How to Use the Indicator:
Setup:
Configure RSI by choosing the source and setting the length to match your trading style.
Set the zigzag and confirm lengths for appropriate pivot detection.
Trend Analysis:
Monitor the RSI for trend changes using the colored trend lines and labels.
Divergence Detection:
Look for RSI and price divergences to anticipate potential reversals or continuations.
Breakout/Breakdown:
Use these signals in conjunction with "Waldo RSI Overlay :o" for price action confirmation.
Overbought/Oversold:
Identify when the market might be due for a correction or continued momentum.
Moving Averages:
Focus on the color changes in RSI to understand macro trend shifts with the default 50/200 period setup.
Ghost Lines:
Enable for a cleaner chart if you don't need trend lines extending indefinitely.
Usage Tips:
Combine with other indicators for confirmation, as no single tool is foolproof.
Adjust settings to suit different market conditions or trading timeframes.
Use in tandem with "Waldo RSI Overlay :o" for a full trading signal system.
Remember, trading involves significant risk, and historical data does not guarantee future performance. Use this indicator as part of a broader trading strategy.
Rsi_divergence

Waldo RSI Overlay :oWaldo RSI Overlay :o Indicator Guide
Welcome to the guide for the Waldo RSI Overlay :o indicator on TradingView. This tool enhances your trading analysis through RSI-based overlays for trend analysis, divergence detection, and breakout/breakdown signals when used with its companion indicator, Waldo RSI :o.
Key Features:
RSI Overlay:
• RSI Source: Choose from:
o ON RSI: Uses the RSI values directly to detect pivots, focusing on RSI highs and lows for trend analysis.
o ON HIGH, ON CLOSE, ON LOW, ON OPEN:
These options base pivot detection on price action at those specific points, offering an alternative market structure view.
• RSI Settings:
o Source: Default is (H+L)/2, but you can select any price for RSI calculation.
o Length: Default RSI length is 7, which you can adjust for sensitivity.
Trend Lines:
• Show Trend Lines: Toggle to display trend lines based on pivot points.
• Zigzag Length: Sets the sensitivity of pivot point detection.
• Confirm Length: Ensures the validity of pivot points (default is 3).
• Colors: Customize colors for Higher Highs (HH), Lower Highs (LH), Higher Lows (HL), and Lower Lows (LL).
• Transparency and Line Width: Control how trend lines and fills appear.
• Label Size: Adjust the size of labels identifying pivot points.
Divergences:
• Classic Divergences:
o Show Classic Div: Enable to highlight regular divergences where price and RSI move in opposite directions.
o Colors: Define colors for bullish and bearish divergence lines and labels.
o Transparency and Line Width: Adjust the visual impact of divergence signals.
• Hidden Divergences:
o Similar settings as classic, but these highlight divergences indicating trend continuation.
Breakout/Breakdown:
• Show Breakout/Breakdown: When activated, this feature signals when the price breaks through previous highs or lows. To activate these breakouts, you need the companion indicator Waldo RSI :o, select the SRC in the External section, and select the crossovers for each one.
This combination provides RSI confirmation for breakout/breakdown events.
Overbought/Oversold Zones:
• Show Overbought and Oversold Zones: Bars are colored when RSI exceeds 70 (purple) or falls below 30 (blue), indicating potential market extremes.
Moving Averages (Optional):
• Show Moving Averages: Option to overlay two moving averages for trend confirmation.
• Source, Type, Length: Customize each MA's configuration.
Ghost Lines (Optional):
• Ghost Lines: When enabled, trend lines extend for only a specified period (Ghost Length) instead of indefinitely.
How to Use the Indicator:
1. Setup:
o Configure RSI settings by choosing the RSI Source and adjusting the RSI Length to suit your trading style.
o Set the Zigzag Length and Confirm Length for trend line sensitivity based on market volatility.
2. Trend Analysis:
o Look at the colored horizontal lines and fills for HH, LH, HL, LL to discern market structure and potential reversal points.
3. Divergence Detection:
o Identify divergences where price and RSI diverge. Regular divergences might signal trend exhaustion, while hidden ones could indicate trend persistence.
4. Breakout/Breakdown Signals:
o Ensure you have both the Waldo RSI Overlay :o and Waldo RSI :o indicators applied. Green triangles below bars signal breakouts; red ones above indicate breakdowns, based on price movement with RSI confirmation from the companion indicator.
5. Overbought/Oversold:
o Use these colored zones to spot potential momentum shifts or reversal areas.
6. Moving Averages on RSI:
o If used, these can help confirm trends or identify crossover signals for additional trade confirmation.
7. Ghost Lines:
o For a less cluttered chart, enable this to limit how far trend lines extend.
Tips for Usage:
• Always combine this indicator with other analytical tools for better confirmation. No single indicator should guide all decisions.
• Adjust settings according to the asset's behavior and your trading timeframe.
• Regularly review your settings as market dynamics change.
Remember, trading involves risk, and past performance doesn't predict future outcomes. Use this indicator within a comprehensive trading strategy.

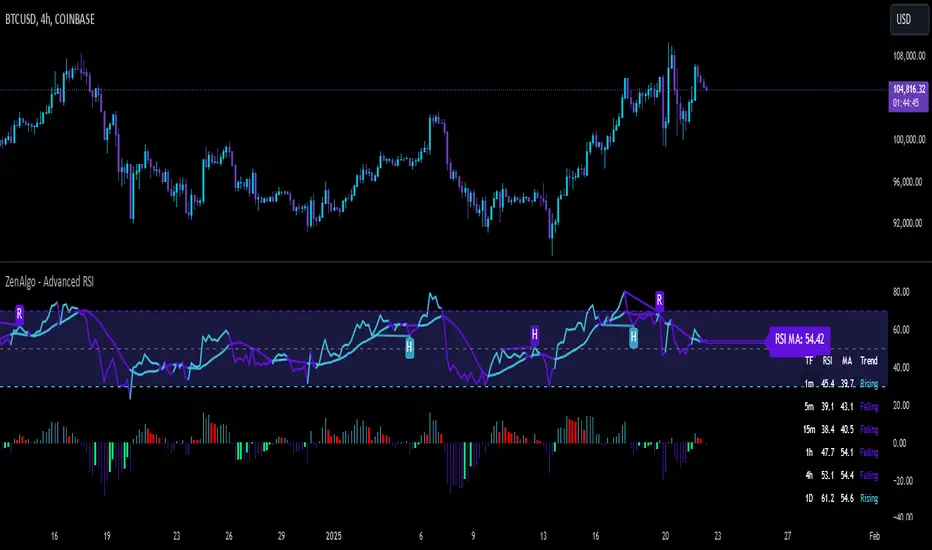
ZenAlgo - Advanced RSIZenAlgo - Advanced RSI is a technical indicator that combines the classic Relative Strength Index (RSI) with advanced tools, such as moving averages, histograms, divergence detection, and trend analysis. This integration provides traders with deeper insights into market dynamics, helping them identify critical entry and exit points. The indicator is designed to synergistically merge these features, delivering a comprehensive analytical tool that simplifies market analysis while providing actionable insights.
Additionally, it includes a Multi TimeFrame table, allowing traders to monitor RSI values and trends across six different timeframes in one view. This enhancement provides a broader perspective on market dynamics and helps traders identify consistent or diverging trends across multiple timeframes, enabling more precise decision-making.
Features
RSI with Moving Averages:
Offers five types of moving averages (SMA, EMA, WMA, SMMA, VWMA) to suit various trading styles and market conditions.
Moving averages are overlaid on RSI, allowing traders to detect support/resistance levels and momentum shifts directly on the RSI panel.
RSI Histogram:
Displays the difference between RSI and its moving average.
Positive histogram values indicate rising momentum, while negative values show declining momentum.
Automatically detects and highlights divergences with color-coded bars (red for bearish, green for bullish).
Bollinger Bands for RSI:
Adds upper and lower bands to RSI, visualizing volatility and overbought/oversold conditions.
Divergence Detection:
Identifies and visualizes both regular and hidden divergences, marking key reversal or trend continuation points.
Labels divergences with R (regular) or H (hidden) to provide clarity on their implications.
Bollinger Bands for RSI:
Adds upper and lower bands to RSI, visualizing volatility and overbought/oversold conditions.
Diamond Signals:
Marks crossovers of RSI and its moving average in overbought (RSI > 70) or oversold (RSI < 30) zones with diamond symbols, highlighting potential reversals.
Multi TimeFrame Table:
Displays RSI values for six different timeframes in a clear and intuitive table.
Calculates the trend on each timeframe based on the average direction of the last three candles. Trends are categorized as "rising" (increasing), "falling" (decreasing), or "neutral" (stable).
Provides easily interpretable insights across timeframes, allowing traders to focus on the current chart without switching timeframes manually.
Added Value: Why Is This Indicator Original/Why Shall You Pay for This Indicator?
ZenAlgo - Advanced RSI is a cohesive system where each component enhances the others. The originality and added value of the indicator come from:
1. Synergy Between Components:
Unlike standalone indicators, which can provide isolated or incomplete insights, ZenAlgo - Advanced RSI combines RSI, moving averages, and divergence detection into a unified system. For instance:
The RSI histogram integrates momentum and trend strength in a single visualization, eliminating the need for multiple separate tools.
Divergences are calculated using both price action and histogram trends, providing more reliable signals compared to divergence detection using only RSI.
2. Customization for Traders:
The ability to select from various moving averages (e.g., EMA for fast responses, SMA for smoother trends) allows users to tailor the indicator to different trading environments and strategies.
3. Actionable Visual Cues:
Diamond signals, histogram bars, and divergence markings make complex market patterns easier to interpret, reducing the cognitive load for traders.
4. Enhanced Divergence Analysis:
Built-in detection of regular and hidden divergences offers clarity and saves traders the effort of manually analyzing charts.
5. Bollinger Bands Integration:
Adding Bollinger Bands to RSI provides insights into volatility and momentum that go beyond what traditional Bollinger Bands or RSI can deliver individually.
6. Multi TimeFrame Table:
The Multi Time Frame table adds a new layer of analytical depth by consolidating RSI values and trends from multiple timeframes into a single tool. This helps traders identify consistent or diverging trends across timeframes, which is crucial for adjusting trading strategies to suit specific market conditions.
7. All-in-One Efficiency:
Instead of juggling multiple indicators, traders gain a streamlined tool that consolidates trend, momentum, and volatility analysis into a single, easy-to-read panel.
How It Works
1. RSI Calculation:
RSI is calculated using the standard formula to determine the relative strength of upward and downward price movements over a specified period.
2. Moving Averages:
Users choose from SMA, EMA, WMA, SMMA, or VWMA. The selected moving average is computed using RSI values, not price data, to better align with the indicator's momentum focus.
3. Histogram:
The histogram shows the difference between RSI and its moving average. Positive values indicate RSI is above its moving average, signaling increasing momentum; negative values indicate the opposite.
4. Divergence Detection:
Regular divergences are identified when price forms higher highs or lower lows, while RSI trends in the opposite direction.
Hidden divergences are marked when price forms higher lows or lower highs, but RSI trends differently.
Divergence is validated using both histogram and price trends for enhanced reliability.
5. Bollinger Bands for RSI:
The upper and lower bands are based on the RSI and a configurable standard deviation, highlighting moments of high volatility and overbought/oversold conditions.
6. Trend Analysis:
The indicator computes an average RSI value over last few candles to detect trend strength and direction, helping traders identify when trends are gaining or losing momentum.
7. Diamond Signals:
Signals are triggered when RSI crosses its moving average within overbought or oversold zones. These events are plotted as diamonds for quick visualization.
Please note that this indicator does not trigger any alerts or direct buy/sell signals.
8. Multi TimeFrame Table:
RSI values are calculated for six separate time frames chosen by the user (e.g., 1-minute, 5-minute, 1-hour).
The trend is determined by averaging the direction of the last three candles on each timeframe. Results are displayed as "rising," "falling," or "neutral" in the table.
The table serves as a quick-reference tool for analyzing trends and RSI values across multiple market perspectives.
Usage Examples
Tracking Trends: Use the histogram to monitor momentum: positive values indicate strengthening trends, while negative values suggest weakening trends.
Spotting Divergences: Look for regular divergences (R) to anticipate reversals and hidden divergences (H) to confirm trend continuation.
Utilizing Diamond Signals: When diamonds appear in overbought or oversold zones, they signal potential market reversals, allowing traders to act quickly.
Analyzing Volatility: Bollinger Bands on RSI highlight moments of high volatility, providing additional confirmation for potential trend changes.
Quick Assessment of RSI values: Use the Multi TimeFrame table to quickly assess RSI values and trends on different timeframes. Consistent trends (e.g., "rising" RSI on most timeframes) suggest market alignment, while diverging trends may indicate potential reversals or conflicting market signals. Use this insight to refine entries and exits.
Settings
RSI Length: Number of candles used for RSI calculation.
RSI Source: Data source for RSI calculation.
MA Type: Type of moving average (SMA, EMA, RMA, WMA, VWMA).
MA Length: Number of RSI values used for moving average calculation.
BB StdDev: Standard deviation length for Bollinger Bands calculation.
Disable / enable display of: Bullish, Bearish, Hidden Bullish and Hidden Bearish divergences.
Show table RSI & MA: display or hide Multi TimeFrame RSI table.
Table position / size: set MultiTimeFrame table position to suit your needs and keep it from obstructing other indicator views
Important Notes
This indicator is a technical analysis tool and does not guarantee trading success.
Use it in conjunction with other indicators and fundamental analysis for a more comprehensive trading strategy.
In strong trends, divergences may become less reliable as price action overrides momentum indicators.
BS | Buy&Sell Signals With EMAKey Features:
EMA Intersections: Generates clear buy and sell signals based on predefined EMA crossings.
5 EMA Lines: Visualize market trends with five distinct EMA lines plotted on the chart.
Support and Resistance Levels: Easily identify crucial support and resistance levels with our integrated marker.
Comprehensive Indicator Panel: At the bottom of the chart, track Stochastic, RSI, Supertrend, and SMA across multiple timeframes (1m, 5m, 15m, 1H, 4H, Daily, Weekly).
Fully Customizable: Almost every indicator within the tool is adjustable to suit your preferences and trading style.
Alarm Feature: Set up alarms to stay informed of important market movements.
Unlock the full potential of your trading strategy with BS | Buy&Sell Signals With EMA. Customize, analyze, and trade with confidence.
created by @bahadirsezer

GOLDEN RSI by @thejamiulGOLDEN RSI thejamiul is a versatile Relative Strength Index (RSI)-based tool designed to provide enhanced visualization and additional insights into market trends and potential reversal points. This indicator improves upon the traditional RSI by integrating gradient fills for overbought/oversold zones and divergence detection features, making it an excellent choice for traders who seek precise and actionable signals.
Source of this indicator : This indicator is based on @TradingView original RSI indicator with a little bit of customisation to enhance overbought and oversold identification.
Key Features
1. Customizable RSI Settings:
RSI Length: Adjust the RSI calculation period to suit your trading style (default: 14).
Source Selection: Choose the price source (e.g., close, open, high, low) for RSI calculation.
2. Gradient-Filled RSI Zones:
Overbought Zone (80-100): Gradient fill with shades of green to indicate strong bullish conditions.
Oversold Zone (0-20): Gradient fill with shades of red to highlight strong bearish conditions.
3. Support and Resistance Levels:
Upper Band: 80
Middle Bands: 60 (bullish) and 40 (bearish)
Lower Band: 20
These levels help identify overbought, oversold, and neutral zones.
4. Divergence Detection:
Bullish Divergence: Detects lower lows in price with corresponding higher lows in RSI, signaling potential upward reversals.
Bearish Divergence: Detects higher highs in price with corresponding lower highs in RSI, indicating potential downward reversals.
Visual Indicators:
Bullish divergence is marked with green labels and line plots.
Bearish divergence is marked with red labels and line plots.
5. Alert Functionality:
Custom Alerts: Set up alerts for bullish or bearish divergences to stay notified of potential trading opportunities without constant chart monitoring.
6. Enhanced Chart Visualization:
RSI Plot: A smooth and visually appealing RSI curve.
Color Coding: Gradient and fills for better distinction of trading zones.
Pivot Labels: Clear identification of divergence points on the RSI plot.

Comprehensive Trading Toolkit [BigBeluga]Trading Toolkit is a comprehensive indicator inspired by the trading strategies of the renowned crypto influencer Michaël van de Poppe . This tool combines RSI divergences, correction zones, and advanced support/resistance levels to provide traders with a robust framework for analyzing market movements.
🔵 Key Features:
RSI Divergences on Chart:
Automatically identifies and plots RSI divergences (bullish and bearish) directly on the main price chart.
Green lines indicate bullish divergences, suggesting potential upward reversals.
Red lines indicate bearish divergences, signaling possible downward movements.
Correction Boxes:
Traders typically define a correction as a drop in value of 10% or more. This drop can happen over a few hours or a few days. Also, it can last for less than 24 hours or many months.
This indicator visualizes corrections with blue shaded boxes, triggered by a percentage decline defined in the settings.
The boxes highlight sharp price drops, helping traders identify significant market movements quickly.
Advanced Support and Resistance Levels:
Dynamically detects key support and resistance levels based on price pivots.
When the price is above a level, it plots a green shaded area from the cross point, marking support.
When the price drops below a level, it plots a red shaded area, highlighting resistance.
Dashed lines indicate weaker levels, while solid lines represent stronger, more reliable levels.
🔵 Usage:
Identify Divergences: Use plotted RSI divergences to detect potential market reversals and align them with price action.
Analyze Correction Zones: Utilize correction boxes to evaluate significant price declines and find potential buying opportunities during these corrections.
Leverage Support and Resistance Levels: Confirm breakouts, reversals, or consolidation zones with the color-coded areas.
Enhance Risk Management: Combine divergences and correction zones to set informed stop-loss or take-profit levels.
Trading Toolkit empowers traders with actionable insights into market trends, corrections, and support/resistance dynamics, making it an invaluable tool for crypto and forex markets.

RSI and CMF V 1.0
Introduction: RSI and CMF
The Relative Strength Index (RSI) and Chaikin Money Flow (CMF) are two powerful tools for analyzing market behavior. Each serves a unique purpose and provides insights into different aspects of price action.
The RSI measures the speed and magnitude of price movements. By comparing recent gains to losses over a chosen period, it identifies overbought and oversold conditions in the market. RSI focuses solely on price and offers traders a quick glance at whether an asset is trending too high or too low relative to its recent performance.
On the other hand, the CMF evaluates market behavior by integrating both price and volume. It measures money flow to determine whether an asset is being accumulated (bullish) or distributed (bearish). Positive CMF values indicate buying pressure, while negative values signal selling pressure, making it an essential tool for volume-based analysis.
Our Innovation
Traditionally, indicators like the RSI and CMF are analyzed in separate panels, limiting their connection to the price chart itself. We’ve developed an innovative solution that combines the power of these two indicators, enabling traders to simultaneously measure both price movements and volume flow in a unified visualization. By mapping the RSI and CMF directly onto the price chart, our indicator provides a seamless way to observe and analyze how price momentum and money flow interact with the actual price action.
This integration of volume, price, and momentum into a single chart offers traders a comprehensive tool for deeper market insights and faster decision-making.
__________________________________________________________________________
Simple Settings Panel with Tooltips
Our indicator comes with an intuitive and user-friendly settings panel, designed for ease of use and full customization. Each input is accompanied by a tooltip to guide users through the settings and ensure clear understanding of their purpose.
Settings Overview
1. Enable RSI over Price:
Tooltip: "Toggle this option to enable or disable the RSI plotted on the price chart."
This setting allows users to control whether the RSI is displayed directly over the price chart.
2. RSI Length:
Default Value: 14
Tooltip: "Set the period for RSI calculation. Typical value is 14."
Adjusts the time period used for RSI calculations, affecting its sensitivity to price changes.
3. RSI Source:
Default Value: Close
Tooltip: "Choose the data source for RSI calculation, usually the closing price."
Allows users to specify which price data (e.g., close, open, high, low) is used in the RSI calculation.
4. Enable CMF over Price:
Tooltip: "Toggle this option to enable or disable the CMF mapped onto the price chart."
Controls the visibility of the CMF line on the price chart.
5. CMF Length:
Default Value: 20
Tooltip: "Set the period for CMF calculation. Typical value is 20."
Adjusts the time period used to compute the CMF, determining the volume-weighted money flow sensitivity.
Description of RSI and CMF Settings
RSI Settings:
The RSI Length determines how many periods are included in the RSI calculation. Shorter lengths make the RSI more reactive to price changes, while longer lengths smooth out fluctuations. The RSI Source provides flexibility in selecting the price input for calculation, which is typically the closing price by default.
CMF Settings:
The CMF Length defines how many periods are used to calculate the Chaikin Money Flow, enabling users to focus on short-term or long-term trends in money flow. Enabling the CMF over price ensures the relationship between volume and price action is visually evident on the price chart.
The Style Settings
panel allows users to customize the visual appearance of the indicator, ensuring clarity and alignment with their preferences. Users can independently adjust the line colors for RSI and CMF, with default settings of green for RSI and red for CMF, enabling a clear distinction between the two.
Additionally, the Fill between RSI and CMF option provides two customizable colors (Color 0 and Color 1) to represent the dynamic fill. This fill visually highlights the relationship between the RSI and CMF, enhancing the interpretability of their interaction on the price chart. The settings also include options to toggle precision, labels on the price scale, and values in the status line for added flexibility.
_______________________________________________________________________________
How to Analyze with RSI and CMF V 1.0
The RSI and CMF V 1.0 indicator provides an intuitive and integrated approach to analyzing market trends, combining momentum and volume dynamics directly on the price chart. Its innovative mapping of RSI and CMF makes it easy to spot key trends and reversals with unmatched clarity.
Key Insights:
1. Dynamic Relationship Between RSI and CMF:
The indicator maps RSI (momentum-based) and CMF (volume-based) values onto the price chart. This makes it easier to analyze how price momentum aligns with money flow.
The color-coded fill highlights the strength of their relationship:
- Blue Fill: RSI is stronger than CMF, indicating price momentum leads the movement.
- Red Fill: CMF dominates RSI, reflecting the strength of volume flow.
2. Spotting Trends:
Uptrends: Consistent blue fills paired with RSI and CMF rising together suggest bullish momentum backed by strong volume.
Downtrends: Red fills with declining RSI and CMF signal bearish pressure driven by selling volume.
3. Reversals and Divergences:
Divergences between price action and the mapped RSI/CMF lines can signal potential reversals.
For instance, if price is rising but RSI and CMF are both falling, it could indicate weakening bullish momentum.
Ease of Use:
Color Coding: The dynamic fills (blue and red) allow for immediate visual identification of trend strength and direction, reducing analysis time.
Overlay on Price: By plotting directly on the price chart, traders don’t need to switch between multiple panels, ensuring the context remains clear.
Customizable Settings: Inputs for length, source, and enable/disable toggles make it adaptable for all trading styles and timeframes.
In conclusion, this indicator offers a visually clear and easy-to-understand way to combine momentum and volume analysis, empowering traders with actionable insights at a glance.

RSI+EMA+MZONES with DivergencesFeatures:
1. RSI Calculation:
Uses user-defined periods to calculate the RSI and visualize momentum shifts.
Plots key RSI zones, including upper (overbought), lower (oversold), and middle levels.
2. EMA of RSI:
Includes an Exponential Moving Average (EMA) of the RSI for trend smoothing and confirmation.
3. Bullish and Bearish Divergences:
Detects Regular divergences (labeled as “Bull” and “Bear”) for classic signals.
Identifies Hidden divergences (labeled as “H Bull” and “H Bear”) for potential trend continuation opportunities.
4. Customizable Labels:
Displays divergence labels directly on the chart.
Labels can be toggled on or off for better chart visibility.
5. Alerts:
Predefined alerts for both regular and hidden divergences to notify users in real time.
6. Fully Customizable:
Adjust RSI period, lookback settings, divergence ranges, and visibility preferences.
Colors and styles are easily configurable to match your trading style.
How to Use:
RSI Zones: Use RSI and its zones to identify overbought/oversold conditions.
EMA: Look for crossovers or confluence with divergences for confirmation.
Divergences: Monitor for “Bull,” “Bear,” “H Bull,” or “H Bear” labels to spot key reversal or continuation signals.
Alerts: Set alerts to be notified of divergence opportunities without constant chart monitoring.

RSI BB StdDev SignalOverview
The RSI BB StdDev Signal Indicator is a powerful tool designed to enhance your trading strategy by combining the Relative Strength Index (RSI) with Bollinger Bands (BB). This unique combination allows traders to identify potential buy and sell signals more accurately by leveraging the strengths of both indicators. The RSI helps in identifying overbought and oversold conditions, while the Bollinger Bands provide a dynamic range to assess volatility and potential price reversals.
Key Features
— RSI Calculation: The indicator calculates the RSI based on user-defined parameters, allowing for customization to fit different trading styles.
— Bollinger Bands Integration: The RSI values are smoothed using a moving average, and Bollinger Bands are applied to this smoothed RSI to generate buy and sell signals.
— Divergence Detection: The indicator includes an optional feature to detect and alert on bullish and bearish divergences between the RSI and price action.
— Customizable Alerts: Users can set up alerts for buy and sell signals, as well as for divergences, ensuring they never miss a trading opportunity.
— Visual Aids: The indicator plots the RSI, Bollinger Bands, and signals on the chart, making it easy to visualize and interpret the data.
How It Works
1. RSI Calculation:
— The RSI is calculated using the change in the source input (default is close price) over a specified period.
— The RSI values are then plotted on the chart with customizable overbought and oversold levels.
2. Smoothing and Bollinger Bands:
— The RSI values are smoothed using a moving average (SMA, EMA, SMMA, WMA, VWMA) selected by the user.
— Bollinger Bands are applied to the smoothed RSI to create dynamic upper and lower bands.
3. Signal Generation:
—Buy signals are generated when the RSI crosses above the lower Bollinger Band.
—Sell signals are generated when the RSI crosses below the upper Bollinger Band.
—These signals are plotted on both the RSI pane and the main price chart for easy reference.
4. Divergence Detection:
— The indicator can detect and alert on regular bullish and bearish divergences between the RSI and price action.
— Bullish divergences occur when the price makes a lower low, but the RSI makes a higher low.
— Bearish divergences occur when the price makes a higher high, but the RSI makes a lower high.
Usage
1. Setting Up:
— Add the indicator to your TradingView chart.
— Customize the RSI length, source, and other parameters in the settings panel.
— Enable or disable the divergence detection based on your trading strategy.
2. Interpreting Signals:
— Use the buy and sell signals generated by the RSI crossing the Bollinger Bands as potential entry and exit points.
— Pay attention to divergences for additional confirmation of trend reversals.
3. Alerts:
— Set up alerts for buy and sell signals to receive notifications in real-time.
— Enable divergence alerts to be notified of potential trend reversals.
Conclusion
The RSI BB StdDev Signal Indicator is a comprehensive tool that combines the strengths of the RSI and Bollinger Bands to provide traders with more accurate and reliable signals. Whether you are a beginner or an experienced trader, this indicator can enhance your trading strategy by offering clear visual cues and customizable alerts.
Note
This indicator is provided with open-source code, allowing users to understand its logic and customize it further if needed. The detailed description and customizable settings ensure that traders of all levels can benefit from its unique features.

Adapted RSI w/ Multi-Asset Regime Detection v1.1The relative strength index (RSI) is a momentum indicator used in technical analysis. RSI measures the speed and magnitude of an asset's recent price changes to detect overbought or oversold conditions in the price of said asset.
In addition to identifying overbought and oversold assets, the RSI can also indicate whether your desired asset may be primed for a trend reversal or a corrective pullback in price. It can signal when to buy and sell.
The RSI will oscillate between 0 and 100. Traditionally, an RSI reading of 70 or above indicates an overbought condition. A reading of 30 or below indicates an oversold condition.
The RSI is one of the most popular technical indicators. I intend to offer a fresh spin.
Adapted RSI w/ Multi-Asset Regime Detection
Our Adapted RSI makes necessary improvements to the original Relative Strength Index (RSI) by combining multi-timeframe analysis with multi-asset monitoring and providing traders with an efficient way to analyse market-wide conditions across different timeframes and assets simultaneously. The indicator automatically detects market regimes and generates clear signals based on RSI levels, presenting this data in an organised, easy-to-read format through two dynamic tables. Simplicity is key, and having access to more RSI data at any given time, allows traders to prepare more effectively, especially when trading markets that "move" together.
How we calculate the RSI
First, the RSI identifies price changes between periods, calculating gains and losses from one look-back period to the next. This look-back period averages gains and losses over 14 periods, which in this case would be 14 days, and those gains/losses are calculated based on the daily closing price. For example:
Average Gain = Sum of Gains over the past 14 days / 14
Average Loss = Sum of Losses over the past 14 days / 14
Then we calculate the Relative Strength (RS):
RS = Average Gain / Average Loss
Finally, this is converted to the RSI value:
RSI = 100 - (100 / (1 + RS))
Key Features
Our multi-timeframe RSI indicator enhances traditional technical analysis by offering synchronised Daily, Weekly, and Monthly RSI readings with automatic regime detection. The multi-asset monitoring system allows tracking of up to 10 different assets simultaneously, with pre-configured major pairs that can be customised to any asset selection. The signal generation system provides clear market guidance through automatic regime detection and a five-level signal system, all presented through a sophisticated visual interface with dynamic RSI line colouring and customisable display options.
Quick Guide to Use it
Begin by adding the indicator to your chart and configuring your preferred assets in the "Asset Comparison" settings.
Position the two information tables according to your preference.
The main table displays RSI analysis across three timeframes for your current asset, while the asset table shows a comparative analysis of all monitored assets.
Signals are colour-coded for instant recognition, with green indicating bullish conditions and red for bearish conditions. Pay special attention to regime changes and signal transitions, using multi-timeframe confluence to identify stronger signals.
How it Works (Regime Detection & Signals)
When we say 'Regime', a regime is determined by a persistent trend or in this case momentum and by leveraging this for RSI, which is a momentum oscillator, our indicator employs a relatively simple regime detection system that classifies market conditions as either Bullish (RSI > 50) or Bearish (RSI < 50). Our benchmark between a trending bullish or bearish market is equal to 50. By leveraging a simple classification system helps determine the probability of trend continuation and the weight given to various signals. Whilst we could determine a Neutral regime for consolidating markets, we have employed a 'neutral' signal generation which will be further discussed below...
Signal generation occurs across five distinct levels:
Strong Buy (RSI < 15)
Buy (RSI < 30)
Neutral (RSI 30-70)
Sell (RSI > 70)
Strong Sell (RSI > 85)
Each level represents different market conditions and probability scenarios. For instance, extreme readings (Strong Buy/Sell) indicate the highest probability of mean reversion, while neutral readings suggest equilibrium conditions where traders should focus on the overall regime bias (Bullish/Bearish momentum).
This approach offers traders a new and fresh spin on a popular and well-known tool in technical analysis, allowing traders to make better and more informed decisions from the well presented information across multiple assets and timeframes. Experienced and beginner traders alike, I hope you enjoy this adaptation.

NASI +The NASI + indicator is an advanced adaptation of the classic McClellan Oscillator, a tool widely used to gauge market breadth. It calculates the McClellan Oscillator by measuring the difference between the 19-day and 39-day EMAs of net advancing issues, which are optionally adjusted to account for the relative strength of advancing vs. declining stocks.
To enhance this analysis, NASI + applies the Relative Strength Index (RSI) to the cumulative McClellan Oscillator values, generating a unique momentum-based view of market breadth. Additionally, two extra EMAs—a 10-day and a 4-day EMA—are applied to the RSI, providing further refinement to signals for overbought and oversold conditions.
With NASI +, users benefit from:
-A deeper analysis of market momentum through cumulative breadth data.
-Enhanced sensitivity to trend shifts with the applied RSI and dual EMAs.
-Clear visual cues for overbought and oversold conditions, aiding in intuitive signal identification.

RSI/MFI Divergence Finder [idahodev]Monitoring RSI (Relative Strength Index) and MFI (Money Flow Index) divergences on a stock or index chart offers several benefits to traders and analysts. Let's break down the advantages:
Comprehensive Market View: Combining both indicators provides a more complete picture of market conditions, as they measure different aspects of price movement. RSI focuses on recent gains/losses relative to price change, while MFI incorporates volume data to assess money flow in and out of a security.
Enhanced Signal Accuracy: When divergences occur simultaneously in both RSI and MFI, it may be considered a stronger signal than if only one indicator showed divergence. This can potentially lead to more reliable trading decisions.
Identification of False Breakouts: Divergences between these indicators and price action can help identify false breakouts or misleading price movements that are not supported by underlying market strength or volume.
More Nuanced Market Understanding: By examining divergent behavior between money flow (MFI) and momentum (RSI), traders gain a more detailed comprehension of the interplay between these factors in shaping market trends.
Early Warning Signs: These divergences can act as early warning signs for potential trend reversals or changes in market sentiment, allowing traders to adjust their strategies proactively.
It's important to note that RSI/MFI divergences should be used as part of a broader trading strategy rather than solely relying on them for buy/sell signals. They can serve as valuable tools for confirming trends, identifying potential turning points, or warning against overbought/oversold conditions.
When using these indicators together, traders must be cautious of false signals, especially in choppy markets or during periods of high volatility. It's crucial to combine this analysis with other technical and fundamental factors before making trading decisions.
In summary, monitoring RSI/MFI divergences may offer a way to gain insights into the underlying strengths and weaknesses of market movements.
This utility differs from other in that it allows for a choke/threshold/sensitivity setting to help weed out noisy signals. This needs to be carefully adjusted per chart.
It also allows for tuning of the MFI smoothing length (number of bars on the current chart) as well as how many previous bars it will take into consideration when calculating RSI and MFI divergences. It will signal when it sees alignment forming between RSI and MFI divergences in a direction. You will likely need to tune this script's settings every few days or at least anytime there is a change in overall market behavior or sustained volatility.
Ultimately, the goal with this script is to provide an additional level of confirmation of weakness or strength. It should be combined with other indicators such as exhaustion, pivots, supply/demand, trendline breaks or tests, and structure changes, to name a few complementary tools or strategies. It's not meant to be a standalone buy/sell signal indicator!
Here are some settings for futures that may help you get started:
ES (4m chart)
RSI Length: 26
MFI Length: 8
MFI Smoothing Length: 32
Divergence Sensitivity: 124
Left Bars for Pivot: 10
Right Bars for Pivot: 1
NQ (4m chart)
RSI Length: 14
MFI Length: 14
MFI Smoothing Length: 21
Divergence Sensitivity: 400
Left Bars for Pivot: 21
Right Bars for Pivot: 1
YM (4m chart)
RSI Length: 14
MFI Length: 14
MFI Smoothing Length: 21
Divergence Sensitivity: 810
Left Bars for Pivot: 33
Right Bars for Pivot: 1

Divergence Indicator Multi [TradingFinder] MACD AO RSI DIV Chart🔵 Introduction
🟣 What is Divergence in Financial Markets?
Divergence in technical analysis happens when the price of a stock moves in a direction opposite to certain indicators. This is a crucial concept in financial markets as it can signal either a trend reversal or a continuation of the current correction in the trend. Understanding divergence helps traders and analysts make more informed decisions.
🟣 Positive Regular Divergence (RD+)
A positive regular divergence occurs at the end of a downtrend, where two price lows form. This divergence appears when the price chart shows a new low, but the indicator does not follow, signaling potential buying opportunities.
Positive divergence indicates increased buying pressure and reduced selling pressure, making it a useful signal for forecasting price increases.
🟣 Negative Regular Divergence (RD-)
A negative regular divergence is seen during an uptrend when two price highs form. The price chart records a new high, but the indicator does not reflect this change, suggesting that a market downturn is likely.
This type of divergence shows strong selling pressure and weaker buying activity, which can help identify selling opportunities.
Both positive and negative divergences are powerful tools for identifying potential trend reversals and key support and resistance levels. For example, when an indicator trends upward while the price moves downward, this creates divergence, warning traders to reconsider their investment strategy.
🟣 Different Types of Divergence in Trading
1. Regular Divergence :
o Positive Regular Divergence (RD+)
o Negative Regular Divergence (RD-)
2. Hidden Divergence :
o Positive Hidden Divergence (HD+)
o Negative Hidden Divergence (HD-)
3.Time Divergence.
Note : This guide focuses specifically on Regular Divergence.
🟣 What is Regular Divergence?
Regular Divergence, often referred to as convergence, occurs when price action and indicators show conflicting patterns, usually signaling the end of a trend. Detecting regular divergence helps traders anticipate potential trend reversals or the formation of reversal patterns.
🔵 How to Use
To optimize the detection of divergence, you can adjust the Fractal Period to specify the length of time for identifying divergence patterns.
Additionally, with the Divergence Detection Method, you can select oscillators like the MACD, RSI, or AO to base divergence detection on.
Divergence in MACD :
MACD divergence occurs when the price chart forms an opposite pattern compared to the MACD line, indicating a potential price reversal.
Divergence in RSI :
In a downtrend, if the price chart forms two consecutive lows with the second lower than the first, but the RSI shows two lows with the second higher, this indicates positive regular divergence, which is a buy signal.
On the other hand, during an uptrend, if the price forms two highs with the second higher than the first, but the RSI shows the second high lower, this points to negative regular divergence, indicating a sell signal.
Divergence in AO (Awesome Oscillator) :
The AO indicator calculates histograms using the difference between 5-period and 34-period simple moving averages. It compares peaks and troughs of these histograms with price movements, detecting divergence and plotting lines and arrows to signal divergence.
🔵 Table
The following table breaks down the main features of the oscillator. It covers four critical categories: Exist, Consecutive, Divergence Quality, and Change Phase Indicator.
Exist : If divergence is detected, a "+" will appear in this row.
Consecutive: Shows the number of consecutive divergences that have formed in a short period.
Divergence Quality : Evaluates the quality of the divergence based on the number of occurrences. One is labeled "Normal," two are "Good," and three or more are considered "Strong."
Change Phase Indicator : If a phase change is detected between two oscillation peaks, this is marked in the table.

RSI & Volume Impact Analyzer Ver.1.00Description:
The RSI VOL Score indicator combines the Relative Strength Index (RSI) and volume data through a mathematical calculation to assist traders in identifying and confirming potential trend reversals and continuations. By leveraging both momentum (RSI) and volume data, this indicator provides a more comprehensive view of market strength compared to using RSI or volume alone.
How It Works:
This indicator calculates a score by comparing the RSI against its moving average, adjusted by the volume data. The resulting score quantifies market momentum and strength. When the score crosses its signal line, it may indicate key moments where the market shifts between bullish and bearish trends, potentially helping traders spot these changes earlier.
Calculation Methods:
The RSI VOL Score allows users to select between several calculation methods to suit their strategy:
SMA (Simple Moving Average): Provides a balanced smoothing approach.
EMA (Exponential Moving Average): Reacts more quickly to recent price changes, offering faster signals.
VWMA (Volume Weighted Moving Average): Emphasizes high-volume periods, focusing on stronger market moves.
WMA (Weighted Moving Average): Applies greater weight to recent data for a more responsive signal.
What the Indicator Plots:
Score Line: Represents a combined metric based on RSI and volume, helping traders gauge the overall strength of the trend.
Signal Line: A smoothed version of the score that helps traders identify potential trend changes. Bullish signals occur when the score crosses above the signal line, while bearish signals occur when the score drops below.
Key Features:
Trend Identification: The score and signal line crossovers can help confirm emerging bullish or bearish trends, allowing traders to act on upward or downward momentum.
Customizable Settings: Traders can adjust the lengths of the RSI and signal line and choose between different moving averages (SMA, EMA, VWMA, WMA) to tailor the indicator to their trading style.
Timeframe-Specific: The indicator works within the selected timeframe, ensuring accurate trend analysis based on the current market context.
Practical Use Cases:
Trending Markets: In trending markets, this indicator helps confirm bullish or bearish signals by validating price moves with volume. Traders can use the crossover of the score and signal line as a guide for entering or exiting trades based on trend strength.
Ranging Markets: In ranging markets, the indicator helps filter out false signals by confirming if price movements are backed by volume, making it a useful tool for traders looking to avoid entering during weak or uncertain market conditions.
Interpreting the Score and Signal Lines:
Bullish Signal: A bullish signal occurs when the score crosses above the signal line, indicating a potential upward trend in momentum and price.
Bearish Signal: A bearish signal is generated when the score crosses below the signal line, suggesting a potential downward trend or weakening market momentum.
By mathematically combining RSI and volume data into a single trend score, the RSI VOL Score indicator provides traders with a powerful tool for identifying trend shifts early and making more confident trading decisions.
Important Note:
The signals generated by this indicator should be interpreted in conjunction with other analysis tools. It is always advisable to confirm signals before making any trading decisions.
Disclaimer:
This indicator is designed to assist traders in their decision-making process and does not provide financial advice. The creators of this tool are not responsible for any financial losses or trading decisions made based on its signals. Trading involves significant risk, and users should seek professional advice or conduct their own research before making any trading decisions.

Daksh RSI POINT to ShootHere are the key points and features of the Pine Script provided:
### 1. **Indicator Settings**:
- The indicator is named **"POINT and Shoot"** and is set for non-overlay (`overlay=false`) on the chart.
- `max_bars_back=4000` is defined, indicating the maximum number of bars that the script can reference.
### 2. **Input Parameters**:
- `Src` (Source): The price source, default is `close`.
- `rsilen` (RSI Length): The length for calculating RSI, default is 20.
- `linestylei`: Style for the trend lines (`Solid` or `Dashed`).
- `linewidth`: Width of the plotted lines, between 1 and 4.
- `showbroken`: Option to show broken trend lines.
- `extendlines`: Option to extend trend lines.
- `showpivot`: Show pivot points (highs and lows).
- `showema`: Show a weighted moving average (WMA) line.
- `len`: Length for calculating WMA, default is 9.
### 3. **RSI Calculation**:
- Calculates a custom RSI value using relative moving averages (`ta.rma`), and optionally uses On-Balance Volume (`ta.obv`) if `indi` is set differently.
- Plots RSI values as a green or red line depending on its position relative to the WMA.
### 4. **Pivot Points**:
- Utilizes the `ta.pivothigh` and `ta.pivotlow` functions to detect pivot highs and lows over the defined period.
- Stores up to 10 recent pivot points for highs and lows.
### 5. **Trend Line Drawing**:
- Lines are drawn based on pivot highs and lows.
- Calculates potential trend lines using linear interpolation and validates them by checking if subsequent bars break or respect the trend.
- If the trend is broken, and `showbroken` is enabled, it draws dotted lines to represent these broken trends.
### 6. **Line Management**:
- Initializes multiple lines (`l1` to `l20` and `t1` to `t20`) and uses these lines for drawing uptrend and downtrend lines.
- The maximum number of lines is set to 20 for uptrends and 20 for downtrends, due to a limit on the total number of lines that can be displayed on the chart.
### 7. **Line Style and Color**:
- Defines different colors for uptrend lines (`ulcolor = color.red`) and downtrend lines (`dlcolor = color.blue`).
- Line styles are determined by user input (`linestyle`) and use either solid or dashed patterns.
- Broken lines use a dotted style to indicate invalidated trends.
### 8. **Pivot Point Plotting**:
- Plots labels "H" and "L" for pivot highs and lows, respectively, to visually indicate turning points on the chart.
### 9. **Utility Functions**:
- Uses helper functions to get the values and positions of the last 10 pivot points, such as `getloval`, `getlopos`, `gethival`, and `gethipos`.
- The script uses custom logic for line placement based on whether the pivots are lower lows or higher highs, with lines adjusted dynamically based on price movement.
### 10. **Plotting and Visuals**:
- The main RSI line is plotted using a color gradient based on its position relative to the WMA.
- Horizontal lines (`hline1` and `hline2`) are used for visual reference at RSI levels of 60 and 40.
- Filled regions between these horizontal lines provide visual cues for potential overbought or oversold zones.
These are the main highlights of the script, which focuses on trend detection, visualization of pivot points, and dynamic line plotting based on price action.

Multi-Asset Cross Timeframe Divergence Ind. (MACDI) // AlgoFyreThe Multi-Asset Cross Timeframe Divergence Indicator (MACDI) identifies divergences in momentum like RSI across multiple assets and timeframes. It visually highlights lagging correlated asset momentum divergences, helping traders spot inefficiencies and potential trade opportunities in the following asset.
🔶 KEY FEATURES
🔸Average Momentum Trendline for Each Timeframe
The Average Momentum Trendline feature calculates the average momentum of multiple assets over specified timeframes. It uses smoothed values to determine the momentum trend for each timeframe on the average aggregated momentum of both assets. This trendline helps traders identify the overall direction of the market momentum, providing a clearer picture of potential price movements.
🔸Real-time Divergence Indication and Alert Table
The Real-time Divergence Indications and Alert Table feature visualizes detected divergences between the momentum values of the two assets across different timeframes. It identifies both bullish and bearish divergences, signaling lagging reversals in the the following asset and potential trading opportunities. When a divergence is detected, the system generates real-time visual indications on the chart and in an overview table for traders to act promptly. The alert table provides a comprehensive overview of all detected divergences, making it easier for traders to monitor and respond to market changes.
🔸Color and Size Based Labels on Price Chart based on Divergence Type
The Color and Size Based Labels feature visually represents divergences directly on the price chart. Bullish and bearish divergences are marked with distinct colors and sizes, making them easily identifiable at a glance. Larger labels indicate higher timeframes and thus generally more significance.
🔶 INSTRUCTION GUIDELINES
🔸Identify Divergence Clusters
The more divergences align, the higher the probability of a potential trend reversal in the asset. When multiple multi-timeframe divergences occur in both lower and higher timeframes within a local cluster, the probability of a reversal increases. This is valid for both for bullish and bearish divergences.
🔸Spot Low Probability Divergences
To further increase the probability, analyze the current state of the average momentum trendline. For a bullish reversal, a relatively low level of the average momentum trendline is preferred, whereas for a bearish reversal, a relatively high level is preferred.
🔶 INDIVIDUAL CONFIGURATION
🔸Leading Asset
This input allows the user to select the leading asset for the divergence analysis.
🔸Following Asset
This input allows the user to select the following asset for the divergence analysis.
🔸Higher Timeframe
This input sets the higher timeframe for the analysis.
🔸Lower Timeframe
This input sets the lower timeframe for the analysis.
🔸Show RSI Divergence
This input enables or disables the display of RSI divergence signals.
🔸RSI Length
This input sets the length of the RSI calculation.
🔸RSI Source
This input sets the source data for the RSI calculation (e.g., close price).
🔸RSI Smoothing Length
This input sets the length of the smoothing applied to the RSI values.
🔸Smoothing Method
This input sets the method used for smoothing the RSI values.
🔶 CONCLUSION
The Multi-Asset Cross Timeframe Divergence Indicator (MACDI) is a powerful tool for identifying momentum divergences across multiple assets and timeframes. Its visual cues and customizable table make it easy to use and interpret, providing valuable insights for trading decisions.

RSI Divergence and GradientThe RSI Divergence and Gradient Indicator simplifies the process of identifying the relationship between price action and the Relative Strength Index (RSI). By integrating RSI data directly into the price chart, traders no longer need to open a separate pane to monitor RSI or manually compare price action and RSI.
This indicator allows traders to easily spot overbought or oversold conditions and detect divergences between price and RSI. These signals can help identify potential reversal points and more effectively assess trend strength.
Features
RSI Divergences: The script identifies and plots bullish and bearish RSI divergences, which can signal potential reversals. Bullish divergences are indicated by an upward triangle below the price bars, while bearish divergences are indicated by a downward triangle above the price bars.
Overbought/Oversold Gradient: The script uses a color gradient to highlight overbought and oversold conditions on the chart, helping traders visualize momentum and trend strength. The gradient dynamically adjusts based on RSI values, transitioning through different colors to represent the intensity of overbought or oversold conditions.
Customizable Gradient: The gradient is customizable, allowing traders to set their own thresholds for overbought and oversold levels, and to choose the colors that best suit their trading style. This flexibility ensures the indicator can be tailored to individual preferences.
How It Works
RSI Calculation: The indicator calculates RSI using the standard 14-period length by default, but this can be adjusted to suit the trader's needs.
Divergence Detection: The script identifies divergences by comparing the highest and lowest points of the RSI with the corresponding price levels over the RSI period length. When a divergence is detected, it is plotted on the chart to indicate a potential reversal.
Gradient Coloring: The gradient coloring system changes the bar colors based on RSI levels. The color transitions from a neutral tone to specified start and end colors as RSI approaches overbought or oversold thresholds, providing a visual cue for potential overextended market conditions.
Intended Use
This indicator is particularly useful for traders who want to combine momentum analysis with divergence signals to identify potential reversal points or confirm trend strength. The visual gradient aids in quickly assessing market conditions, making it easier to spot high-probability trading opportunities.

Super RSI: Multi-Timeframe, Multi-RSI-MA, Multi Symbol [DucTri]█ Overview
RSI is a very popular indicator that almost every trader knows about. I created this indicator with the goal of helping you use RSI more conveniently and effectively.
█ Uses
Monitor the RSI of 10 currency pairs simultaneously.
The first column shows the RSI of the current currency pair.
RSI below 30 will have a Red background, and above 70 will have a Green background.
Display multiple RSI lines with different lengths (or timeframes).
Displays 3 RSI with 3 different lengths 7, 14 and 21
Displays two RSI lines with two different timeframes. The purple line shows RSI (14) for the 1H timeframe, and the blue line shows RSI (14) for the 4H timeframe.
Display MA and Bollinger Band lines for RSI.
Shows the RSI line along with two MA lines of the RSI: EMA (9) in blue and WMA (45) in red.
Identify RSI Divergence with custom settings
█ Input
- You can have up to three RSI lines, with customizable lengths and timeframes.
- You also have up to three RSI-MA lines, where you can customize the MA type and length.
- You can track RSI for up to 10 currency pairs at the same time.
- Additionally, you can change how the top (or bottom) is determined when identifying divergence.
█ Alerts
Send alerts when two RSI lines cross. For example, when the RSI 14 crosses above the RSI 21, or the RSI on the 1H timeframe crosses above the RSI on the 4H timeframe.*
Send alerts when RSI crosses above or below the RSI-MA line.
Send alerts when two RSI-MA lines cross. For example, when the RSI-EMA (9) crosses above the RSI-WMA (45).*
Send alerts when Divergence (Convergence) appears.
Send alerts when any currency pair in the monitored list shows an Overbought or Oversold signal.

Supply and Demand Zones with Enhanced SignalsThis Pine Script indicator combines supply and demand zone analysis with dynamic buy/sell signals to enhance trading strategies. It provides a robust framework for identifying optimal trading opportunities and managing existing trades.
Key Features:
Supply and Demand Zones: The indicator identifies significant supply and demand zones based on recent price action. These zones are plotted as horizontal lines to help traders visualize potential reversal points.
Exponential Moving Average (EMA): A 21-period EMA is used to determine the prevailing trend and generate buy and sell signals.
Relative Strength Index (RSI): The 14-period RSI is utilized to filter buy and sell signals, providing additional context on overbought and oversold conditions.
Signal Generation:
Buy Signal: Triggered when the price crosses above the EMA and RSI indicates that the market is not overbought.
Sell Signal: Triggered when the price crosses below the EMA and RSI indicates that the market is not oversold.
Enhanced Exit Signals:
Exit Buy Signal: Generated if an opposite sell signal occurs or the higher timeframe RSI indicates overbought conditions.
Exit Sell Signal: Generated if an opposite buy signal occurs or the higher timeframe RSI indicates oversold conditions.
Trade Management:
Tracks active trades and provides exit signals based on the occurrence of opposite trading signals. This helps in managing positions more effectively and reducing potential losses.
Usage:
Supply and Demand Zones: Look for price action around these zones to identify potential trading opportunities.
EMA and RSI: Use buy and sell signals in conjunction with EMA and RSI to validate trading decisions.
Higher Timeframe RSI: Utilize this for additional confirmation and exit signals.
Plotting:
Supply Zone: Plotted as a red horizontal line.
Demand Zone: Plotted as a green horizontal line.
EMA: Plotted as a blue line.
Buy and Sell Signals: Indicated by green and red triangle shapes, respectively.
Exit Signals: Indicated by blue and orange X shapes.
This indicator is designed to help traders make informed decisions by combining technical analysis with strategic trade management.

VWAP with RSIVWAP with RSI Indicator
Overview
The VWAP with RSI Indicator is a powerful tool that combines the Volume Weighted Average Price (VWAP) with the Relative Strength Index (RSI) to provide traders with comprehensive insights into price trends, volume-weighted price levels, and market momentum. This dual-indicator setup enhances your trading strategy by offering a clearer understanding of the market conditions, potential entry and exit points, and trend reversals.
Key Features
VWAP (Volume Weighted Average Price):
Calculation: The VWAP is calculated using the high, low, and close prices, weighted by trading volume over a specified period.
Purpose: VWAP provides an average price that reflects the trading volume at different price levels, helping traders identify the true average price over a given period.
Visualization: The VWAP line is plotted in blue on the price chart, indicating the volume-weighted average price.
RSI (Relative Strength Index):
Calculation: RSI is based on the average gains and losses over a specified period (default is 14 periods) and ranges from 0 to 100.
Purpose: RSI measures the speed and change of price movements, identifying overbought or oversold conditions in the market.
Overbought/Oversold Levels:
Overbought: RSI above 70 (red line).
Oversold: RSI below 30 (green line).
Midline: RSI at 50 (gray dashed line).
Visualization: The RSI line changes color based on its value (purple for normal, red for overbought, green for oversold) and is plotted below the price chart.
Background Fill for RSI:
Overbought Area: Shaded red when RSI is above 70.
Oversold Area: Shaded green when RSI is below 30.
Bullish and Bearish Divergence Detection:
Bullish Divergence: Occurs when price forms a lower low, but RSI forms a higher low, indicating potential upward reversal.
Visualization: Bullish divergence points are marked with a green line and labeled "Bull."
Bearish Divergence: Occurs when price forms a higher high, but RSI forms a lower high, indicating potential downward reversal.
Visualization: Bearish divergence points are marked with a red line and labeled "Bear."
Alerts: Conditions for bullish and bearish divergences trigger alerts.
Settings
VWAP Settings:
hideonDWM: Option to hide VWAP on daily or higher timeframes.
src: Source for VWAP calculation (default is hlc3 - (high + low + close)/3).
offset: Offset for plotting the VWAP.
RSI Settings:
rsiLengthInput: Period length for RSI calculation (default is 14).
rsiSourceInput: Source for RSI calculation (default is close price).
maTypeInput: Type of moving average applied to RSI (options: SMA, EMA).
maLengthInput: Length of the moving average applied to RSI.
How to Use
Trend Identification: Use VWAP to identify the average price level and market trend. If the price is above VWAP, it suggests an uptrend, and if below, it suggests a downtrend.
Overbought/Oversold Conditions: Use RSI to identify potential reversal points. RSI above 70 indicates overbought conditions, and below 30 indicates oversold conditions.
Divergence: Look for bullish or bearish divergences between price and RSI to anticipate potential trend reversals.
Conclusion
By combining VWAP and RSI, this indicator provides a robust framework for analyzing market conditions, identifying trends, and making more informed trading decisions. Enhance your trading strategy today with the VWAP with RSI Indicator!

RSI - Made EasyThis indicator is a visually improved version of RSI. It makes it much easier to see what's happening by simplifying those confusing, intersecting lines. With this, you can detect the RSI direction more clearly. All the features are also explained in the tooltips of the input fields. Some extra features are included, such as average top and bottom calculation, standard deviation and divergences.
Color legend:
Green: RSI Above MA and Rising
Light Green: RSI Above MA and Falling
Red: RSI Below MA and Falling
Light Red: RSI Below MA and Rising
Blue: RSI Crossover MA
Orange: RSI Crossunder MA
Blue Arrow: Bullish Divergence
Orange Arrow: Bearish Divergence
Divergence Scaner 3D Dynamic_tHello MY friend
divergence scanner 3D dynamic
It is a dynamic 3D scanner for identifying positive and negative divergences in 10 indicators.
This indicator can identify the types of Regular_Hidden_Exaggerated divergences for bullish and bearish states in the following indicators.
(MACD_L, MACD_H, RSI, Stochastic, Volume, CCI, MFI, Momentum, OBV, ADX)
This indicator is able to identify the mentioned divergences in the desired price source and in the desired settings for each indicator.
This can be done in up to 3 scans with different sensitivities at the same time. Therefore, the chances of identifying different price points are increased.
Also, the price point for each scan is determined and drawn separately.
This is a dynamic indicator.
That is, the divergence is not misdiagnosed at any moment, and it expresses the presence or absence of divergence for each indicator, and at the first moment of divergence in each sweep, it informs the user of its existence. And if the divergence disappears at the first instant, the label text is corrected.
That is why we say it is dynamic.
This indicator can calculate and identify the divergence with the percentage of allowed deviation both in the price and in the indicator if the user needs.
This indicator has an alert function to inform about the formation of divergence in one scan with desired settings for all divergence modes and for all 10 indicators.
This indicator can label the last 5 divergences for positive and negative divergences and for all three scans. Also display the Fibonacci level for the last divergence.
According to your needs, you can activate only a number of scans that you want or activate only a number of indicators that you want.
The logic of calculation and identification of divergence in the indicator:
As you know, divergences are more valid if they occur between two consecutive peaks and valleys.
In this indicator, three scans are considered, and the user can identify tiny and small pivots according to his needs and strategy by entering different degrees of sensitivity for each scan.
The indicator identifies the desired divergences for 2 consecutive valleys and 2 consecutive peaks in each scan separately and displays them to the user.
Important note:
This indicator is not limited to identifying the indicator points only in line with the price points, that is, the price points and the indicator may not be in the same line.
The higher the sensitivity of your scan, the smaller waves will be detected, and the lower the selection number, the larger waves will be detected.
By enabling pints you can see detected pivots and also by enabling Fibonacci you can see the value of the Fibonacci number for the last detected divergence.
You can see the deviations with the allowed deviation rate if needed and You can also get midpoint error and midline error.(More details are given in the clip.)
This indicator can be customized according to your needs and will identify the divergences of your choice for active scans.
For better display in label printing, the indicator tries to print the output of all active scans in one label, provided that the label printing location is the same.
Note that divergence label printing is done only with the lowest and highest price.
However, drawing the divergence line and printing the point labels depends on the price source you select in each scan.
You can see the scan number written in front of the marker name on the printed label to identify which scan this divergence is for.
Also, before the name of the indicator, an abbreviation related to the type of divergence is also written so that you can understand the type of divergence. For example, H stands for HD divergence.
It is better to consider a color for each scan so that it remains easily in your mind and you can easily recognize the points of each scan.
It is better to adjust the detection sensitivity in scans so that small and large spots are detected simultaneously to increase the performance of the marker.
last word :
Due to the capability of three simultaneous scans as well as dynamics at any moment, we think that the error in detecting the divergence in this indicator is below 1% and also the error in finding the divergence is below 3%. Also, the chances of identifying different price points are increased.
This can be said. It is a very good implementation. You can experience it in back test and forward test.
I tried to show you the full explanation with details in the form of a few clips. You can refer to my YouTube channel for a better introduction of the indicator and to know how to set the settings correctly.
Be careful to experience better execution speed ,Run the indicator when the market is open.
thank you

RSI AcceleratorThe Relative Strength Index (RSI) is like a fitness tracker for the underlying time series. It measures how overbought or oversold an asset is, which is kinda like saying how tired or energized it is.
When the RSI goes too high, it suggests the asset might be tired and due for a rest, so it could be a sign it's gonna drop. On the flip side, when the RSI goes too low, it's like the asset is pumped up and ready to go, so it might be a sign it's gonna bounce back up. Basically, it helps traders figure out if a stock is worn out or revved up, which can be handy for making decisions about buying or selling.
The RSI Accelerator takes the difference between a short-term RSI(5) and a longer-term RSI(14) to detect short-term movements. When the short-term RSI rises more than the long-term RSI, it typically refers to a short-term upside acceleration.
The conditions of the signals through the RSI Accelerator are as follows:
* A bullish signal is generated whenever the Accelerator surpasses -20 after having been below it.
* A bearish signal is generated whenever the Accelerator breaks 20 after having been above it.
