Momentum ScopeOverview
Momentum Scope is a Pine Script™ v6 study that renders a –1 to +1 momentum heatmap across up to 32 lookback periods in its own pane. Using an Augmented Relative Momentum Index (ARMI) and color shading, it highlights where momentum strengthens, weakens, or stays flat over time—across any asset and timeframe.
Key Features
Full-Spectrum Momentum Map : Computes ARMI for 1–32 lookbacks, indexed from –1 (strong bearish) to +1 (strong bullish).
Flexible Scale Gradation : Choose Linear or Exponential spacing, with adjustable expansion ratio and maximum depth.
Trending Bias Control : Apply a contrast-style curve transform to emphasize trending vs. mean-reverting behavior.
Duotone & Tritone Palettes : Select between two vivid color styles, with user-definable hues for bearish, bullish, and neutral momentum.
Compact, Overlay-Free Display : Renders solely in its own pane—keeping your price chart clean.
Inputs & Customization
Scale Gradation : Linear or Exponential spacing of intervals
Scale Expansion : Ratio governing step-size between successive lookbacks
Scale Maximum : Maximum lookback period (and highest interval)
Trending Bias : Curve-transform bias to tilt the –1 … +1 grid
Color Style : Duotone or Tritone rendering modes
Reducing / Increasing / Neutral Colors : Pick your own hues for bearish, bullish, and flat zones
How to Use
Add to Chart : Apply “Momentum Scope” as a separate indicator.
Adjust Scale : For exponential spacing, switch your indicator Y-axis to Logarithmic .
Set Bias & Colors : Tweak Trending Bias and choose a palette that stands out on your layout.
Interpret the Heatmap :
Red tones = weakening/bearish momentum
Green tones = strengthening/bullish momentum
Neutral hues = indecision or flat momentum
Copyright © 2025 MVPMC. Licensed under MIT. For full license see opensource.org
Rmi

ARSIXARSIX
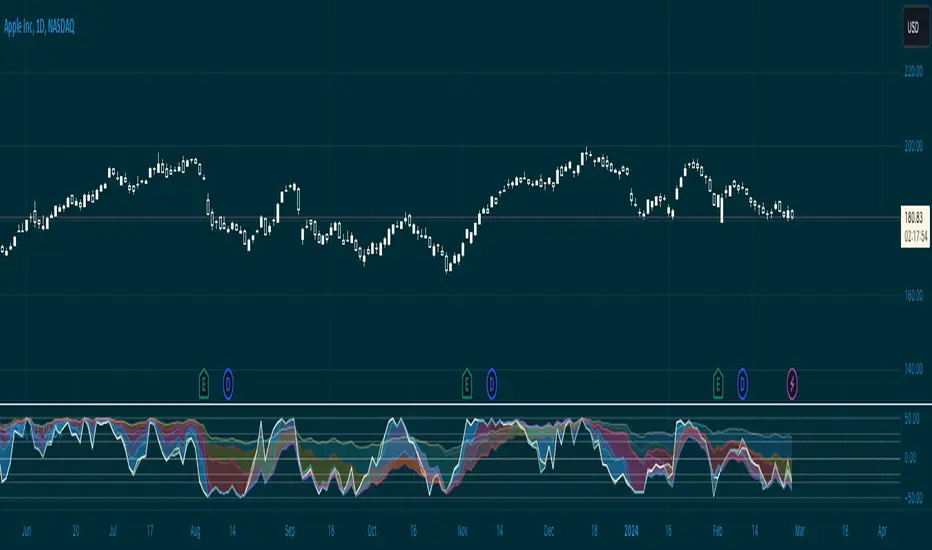
I have written this indicator after two years of continuous experience in writing and backtesting for several different indicators, and I believe that this indicator with its high capabilities can show you the best point of entry into the market as well as exit from it. arsix should work with any time frame and any instrument used.
This indicator has many points to understand so that you can make the best possible use of it, in the following I will try to bring you some of the most important points:
First, we will have an introduction of the different parts of the indicator:
The above line is a relatively simple but very useful formula to determine the momentum of chart. To understand the exact formula, you can refer to the source of the program itself, and its two colors are used to determine the direction of movement.
At the bottom, we have three opposing elements.
The first is the RSI14 line with dark blue color, the second is the RMA or Relative Momentum Index(RMI20) line with the number 20 for Momentum , which will significantly help us understand the overall momentum of the chart, this part is also made in two colors to increase or It will show the decline of the overall momentum of the chart.
And finally, we have a bar chart that is again created in two colors, and this histogram also calculates the momentum chart with a different formula.
And now let's talk about how to interpret these tools and how to use them for Trading:
At first, you may have the question that all these different indicators are not excessive to determine the momentum chart and are all of them necessary? In response, I must say that yes, each of these parts has been selected and made with great care and with my previous experience, the full explanation of each of these parts is beyond the scope of this article, and I will try to explain it in short words. I will give you a general understanding of each one of them and the rest is up to you to find out their capabilities by working more with these tools.
The main thing is to know that none of these tools alone will bring you success and it is their teamwork together that will help you achieve success.
For the sake of simplicity, I will tell you when to open a buy position with this indicator And you can then use this definition of the main thread to interpret the rest of the capabilities of this indicator.
To open a buy position, first the upper indicator should turn light blue, at the same time, the RMI indicator should also turn light blue, and you should also see that this RMI indicator shows the momentum of the overall chart in order to increase. in this case you will be almost sure that the general trend of the chart is towards the rise of the price. In the next step, to determine the exact point of the Entry, you have to wait until the RSI indicator passes the number 50 in this state and at the same time, make sure that the histogram also turns green and shows the increasing direction of momentum in the market, when the RSI is in This state crossed the number 50, you can enter the buy position, it should be noted that due to a series of restrictions, I have moved the RSI indicator down by 50 numbers, so as a result, the number 50 for RSI here is equivalent to The same number zero.
This was an example of how to work with this indicator, I hope that it helped you to understand how to use this indicator. In the end, I would like to point out again that the main topic is understanding the group and mutual behavior of each of the indicators' tools together. For example, if the RSI indicator crosses the number 50 here, but the histogram does not grow or shows a small growth, this indicates that the movement will be low, or for another example, if the RSI indicator cross over From the RMI indicator, This means that the market is very high, and as a result, it is a great opportunity to hold a buy position. In the same way, other parts of this indicator can also be interpreted in opposition to each other.
I hope this indicator will help you in better trades. I look forward to your constructive comments. Thanks Hamid Moradi.

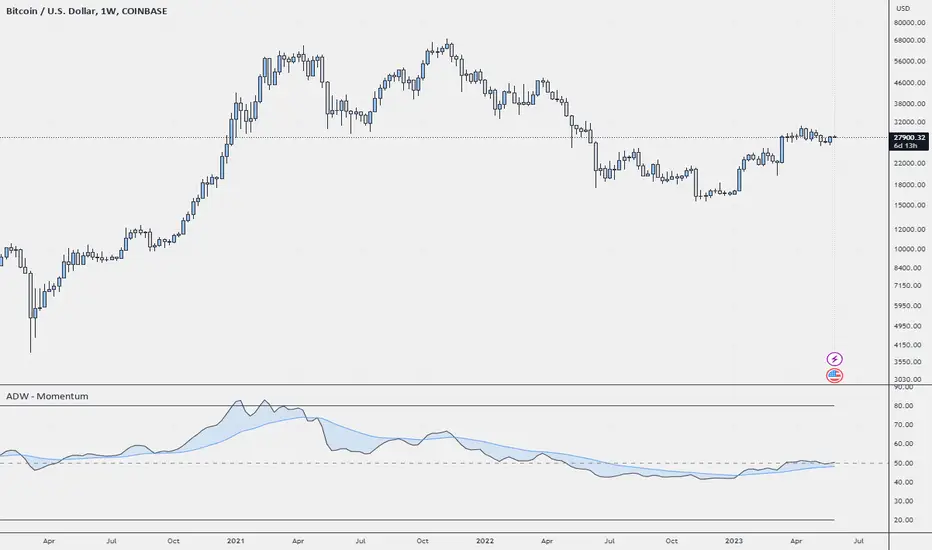
ADW - MomentumADW - Momentum is a trading indicator based on the Relative Momentum Index (RMI) and Exponential Moving Averages (EMAs). This indicator plots the RMI along with its EMAs and highlights regions where RMI crosses its slow EMA. Additionally, it provides alerts when the momentum flips bullish or bearish.
Key Features:
The RMI helps to identify momentum in the market.
Three EMAs (Fast, Standard, and Slow) were calculated on the RMI. These can be utilized to analyze the momentum trend over different periods.
Highlighted regions and colour coding to indicate when RMI crosses its Slow EMA, signalling potential momentum shifts.
Customizable parameters: Users can specify the lengths of the RMI and EMAs, boundaries for RMI, and colours for various components of the plot.
Alerts: The script can alert users when the momentum has flipped bullish or bearish.
The script is organized into several sections:
Inputs: The user can customize several parameters including the RMI averaging length, momentum lookback, RMI boundaries, and the EMA lengths. In addition, users can also specify the colours for the RMI line, Slow EMA line, and the fill colour.
RMI Calculation: The script calculates the RMI based on the user-provided length and momentum lookback. This is done by first calculating two EMAs - one for the positive differences between closing prices (emaInc), and one for the negative differences (emaDec). Then, the RMI is computed using these EMAs.
Plotting: The script plots the RMI line, Slow EMA line, and two horizontal lines indicating the RMI boundaries. In addition, it also fills the region between the RMI and Slow EMA lines.
Conditions: The script computes the conditions for bullish and bearish momentum flips. These are defined as when the RMI crosses above or below the Slow EMA respectively.
Alerts: Finally, the script sets up two alert conditions based on the bullish and bearish conditions. These alert the user when the momentum has flipped bullish or bearish, with a message that includes the current RMI value.
Williams %R & RSI with Multiple PeriodsDESCRIPTION
1. Calculates %R and RSI with multiple period lengths.
1 period length value is defined by User.
8 period length values follow User's selection of classic number sequences, e.g. Fibonacci, Leonardo, Lucas, Narayana, etc.
2. User selects which indicator and periods to display or hide.
DEFAULTS
%R default custom period: 10.
RSI default custom period: 14.
%R & RSI default number sequence periods: Lucas numbers 11, 18, 29, 47, 76, 123, 199, 322.
CALCULATIONS
%R = (period high - most recent period's close price)/(period high - period low)
RSI = 100 - 1 / (100 + RS), where RS = SMMA(up, period) / SMMA(down, period)
PURPOSE
1. Identify price trends.
CREDITS
1. Williams %R technical analysis momentum oscillator by Larry Williams.
2. Wilder's Relative Strength Index technical analysis momentum oscillator by J. Welles Wilder.
3. "Solarized" color scheme by Ethan Schoonover.
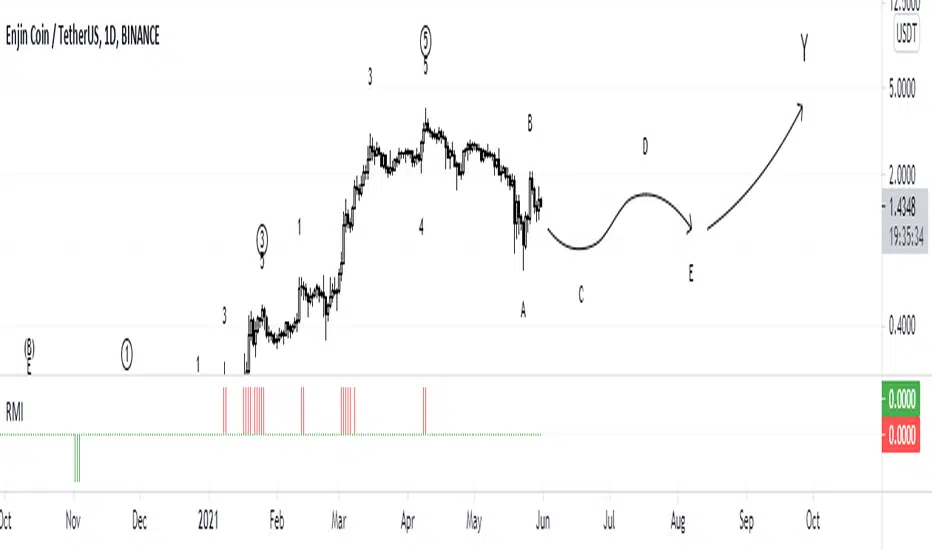
RMIRMI is a combination of RSI and MFI oscillators which considers money flow and strength of supply or demand together.
It estimates that the money of which side is being ran out.
So the power of trends can be predictable approximately.
Where the green columns appear, it means demand is very high and it can fall because buyers may withdraw and sell their assets.
And when red columns appear, it means supply is very high and sellers or new buyers may enter into new deals which may increase the price of a asset.
I would be glad if I hear your feedbacks.
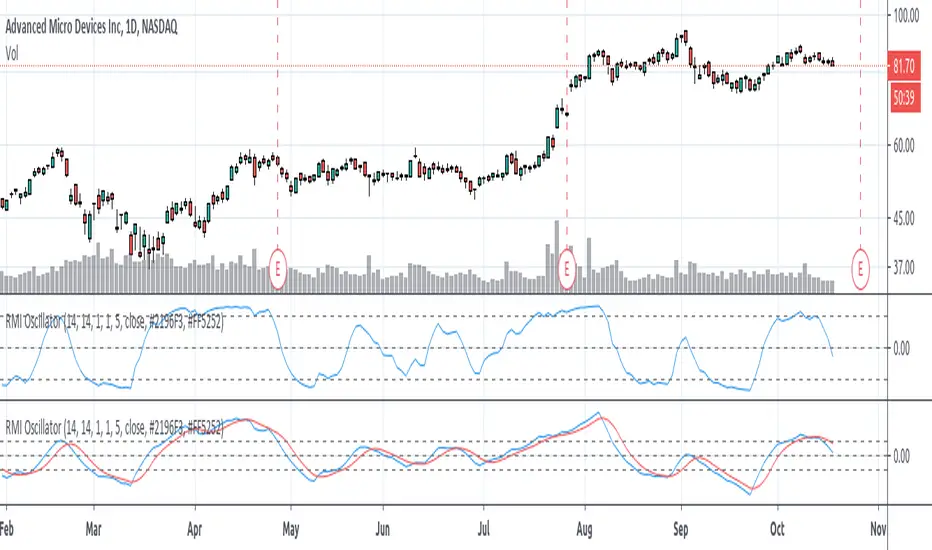
Relative Momentum Index (RMI) OscillatorThe Relative Momentum Index (RMI) is a sibling to the RSI. Where the RSI measures trend based on the average (RMA) of gains and draws over a length of time , the RMI measures based on the SUM of gains and draws . Myself and many others have found that the RMI oscillates better than the RSI does.
I paired the RMI with the oscillation method the Fisher Transformation uses to oscillate the value from -1.0 to 1.0 instead of the Stochastic way of 0 to 100. This way you can enable the Fisher transform, if desired. But I also just prefer the appearance of that.
Some options and features I have coded in-
RMI Length: This is the length of the Relative Momentum Index itself. Like the length of RSI, default 14
Oscillation Length: This is your oscillation length, like a Stochastic. If you put the length at 1 it will turn the indicator into the straight up RMI indicator. (If you select to use the Fisher Transform, the overbought/oversold lines will not show nicely)
Source Pre-Smoothing: The option of smoothing out the source, ie close, before you even run it through the RMI, oscillation, and/or transform
Oscillator Post-Smoothing: The option of smoothing the output of the script
Trailing MA: If desired, you can check the box to Use a Trailing Signal, and enter the length of lookback for a Simple Moving Average (SMA) of the RMI Osc value
Use Fill Colors on MA: If enabled, it will fill the area between the RMI Osc and the trailing MA. I chose to use colors that are similar to some educational ideas I have published, whereby nearing the bottom of the oscillation you get Green to signal Accumulation, and near the top you get Red to signal Distribution. Following red is Black, where you typically get late signal sellers that Capitulate and sell stops trigger. Blue is where traders tend to Chase price up.
The most primitive way of using this indicator would be sell when the value exceeds the overbought/top line and buy when it falls below the oversold/bottom line. You can find ways to use the fill colors, or MA crossovers, rising lows or rising highs, etc. for signals.
Here's a comparison of this indicator to the Stochastic RSI, using similar values-
Here's showing the indicator on intraday values at defaults with some pre- and post-smoothing-
Same thing, but with Fisher Transform enabled-
And an example of the fill bands in action-
Please feel free to use any part of this code as desired.
🐮 🆚 🐻 [Alerts]It's a remake of the previous script but for use in reverse positions at the same time.
In this script the reality could be even better than the Backtest, because, only close the position with profit, so profitability should be 100%, and Longs and Shorts don't mix because they are independent.
In real trade, you need an exchange that allows you to go in reverse positions at the same time or where you can have two independent sub-accounts: one for long and one for short and with margin trading. Although, if TP is small and does not mix with other inverse positions, it's not necessary. (With this script, you can go long and short at the same time and with independent configurations)
Settings for ETH at 5 minutes. (If you find good settings please comment)
Enjoy!

ONLY LONG V4 [Alerts]Let's try the Version 4 ...
This script is only for long positions.
It's based on the conjunction of RMI + ADX + RSI for entries and only with Take Profit to close the position.
It doesn't have security (), nor Heikin Ashi, so the Backtest is Real.
Use always 'Once per bar'.
It doesn't repaint absolutely nothing at all.
Timeframe: 15 minutes
Have fun improving it ...
Enjoy!
Tips ...
BTC: 3LEUP3WjQctdbFjBavcmRGUVRBje8bptCd
ETH: 0x518AAD4746912ae506c82B747488306186c4d546

Relative Momentum IndexRelative Momentum Index indicator script. This indicator was originally developed by Roger Altman (Stocks & Commodities V. 11:2 (57-60)).
RMI with momentum period of 1 will be equal to an RSI when they have the same period and source price.

CMYK VRMI◊ Introduction
This script indicates the relative movement of price x volume.
◊ Origin
Based on 'The Relative Momentum Index' by Roger Altman : February, 1993 issue of Technical Analysis of Stocks & Commodities magazine.
While RSI counts up and down days from close to close, the Relative Momentum Index counts up and down days from the close relative to a close x number of days ago.
This results in an RSI that is smoother. The input has been changed to the change of a smoothed close multiplied by a smoothed volume.
The polarity of VRMI indicates bearish/bullish movement.
◊ Adjustments
CMYK color theme applied.
◊ Usage
VRMI indicates the force the market moves with.
◊ Future Prospects
-
◊ ◊ ◊ ◊ ◊ ◊ ◊ ◊ ◊ ◊ ◊ ◊ ◊ ◊ ◊ ◊ ◊ ◊ ◊ ◊ ◊ ◊ ◊ ◊ ◊ ◊ ◊ ◊ ◊ ◊ ◊ ◊ ◊ ◊ ◊ ◊ ◊ ◊ ◊ ◊ ◊ ◊ ◊ ◊ ◊ ◊ ◊ ◊ ◊ ◊ ◊ ◊ ◊ ◊ ◊ ◊ ◊ ◊ ◊ ◊ ◊ ◊ ◊ ◊ ◊ ◊ ◊ ◊ ◊ ◊ ◊ ◊ ◊ ◊ ◊ ◊ ◊ ◊ ◊ ◊ ◊ ◊ ◊ ◊ ◊ ◊ ◊ ◊ ◊ ◊ ◊ ◊ ◊ ◊ ◊ ◊ ◊ ◊ ◊ ◊ ◊ ◊ ◊ ◊ ◊ ◊

CMYK VRMI RAYS ◊ Introduction
Introducing VRMI in this script, an RMI based on price movement and volume, to indicate bullish and bearish trends.
This script marks the background depending on RMI <> VRMI , VRMI polarity and large buy/sell sprees.
◊ Origin
Based on 'The Relative Momentum Index' by Roger Altman : February, 1993 issue of Technical Analysis of Stocks & Commodities magazine.
While RSI counts up and down days from close to close, the Relative Momentum Index counts up and down days from the close relative to a close x number of days ago.
This results in an RSI that is smoother.
In addition VRMI reacts quick, it is used to cut off latency from RMI, and it's polarity indicates the beginning and end of a trend.
Large buy sell sprees and detected in their proportion with an sma on the volume
◊ Adjustments
CMYK color theme applied.
◊ Usage
This indicator can be used to detect trends and mark reversals.
◊ Prospects
◊ ◊ ◊ ◊ ◊ ◊ ◊ ◊ ◊ ◊ ◊ ◊ ◊ ◊ ◊ ◊ ◊ ◊ ◊ ◊ ◊ ◊ ◊ ◊ ◊ ◊ ◊ ◊ ◊ ◊ ◊ ◊ ◊ ◊ ◊ ◊ ◊ ◊ ◊ ◊ ◊ ◊ ◊ ◊ ◊ ◊ ◊ ◊ ◊ ◊ ◊ ◊ ◊ ◊ ◊ ◊ ◊ ◊ ◊ ◊ ◊ ◊ ◊ ◊ ◊ ◊ ◊ ◊ ◊ ◊ ◊ ◊ ◊ ◊ ◊ ◊ ◊ ◊ ◊ ◊ ◊ ◊ ◊ ◊ ◊ ◊ ◊ ◊ ◊ ◊ ◊ ◊ ◊ ◊ ◊ ◊ ◊ ◊ ◊ ◊ ◊ ◊ ◊ ◊ ◊ ◊

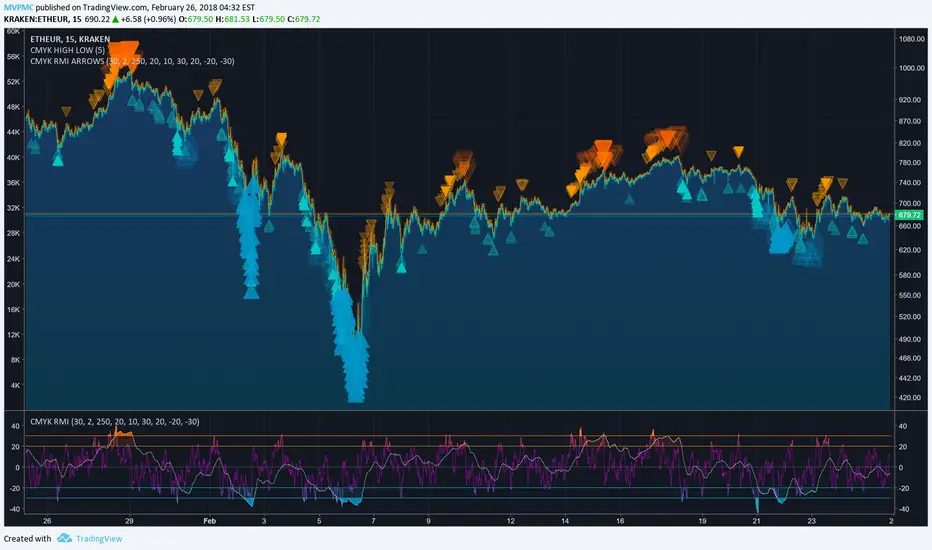
CMYK RMI ARROWS◊ Introduction
I started using this script because of its fast reaction, and good tell for buy/sell moments.
For larger timescales, the overall trend should be taken into account regarding the levels.
In the future i will update this indicator, to automatically adjust those.
This is the Overlay expansion of the Indicator Linked below.
◊ Origin
The Relative Momentum Index was developed by Roger Altman and was introduced in his article in the February, 1993 issue of Technical Analysis of Stocks & Commodities magazine.
While RSI counts up and down days from close to close, the Relative Momentum Index counts up and down days from the close relative to a close x number of days ago.
This results in an RSI that is smoother.
◊ Adjustments
CMYK color theme applied.
Four levels to indicate intensity.
Two Timescales, to overview the broader trend, and fast movements.
◊ Usage
RMI indicates overbought and oversold zones, and can be used for divergence and trend analysis.
◊ Future Prospects
Self adjusting levels, relative to an SMA trend.
Alternative RMI, which functions as an overlay.
◊ ◊ ◊ ◊ ◊ ◊ ◊ ◊ ◊ ◊ ◊ ◊ ◊ ◊ ◊ ◊ ◊ ◊ ◊ ◊ ◊ ◊ ◊ ◊ ◊ ◊ ◊ ◊ ◊ ◊ ◊ ◊ ◊ ◊ ◊ ◊ ◊ ◊ ◊ ◊ ◊ ◊ ◊ ◊ ◊ ◊ ◊ ◊ ◊ ◊ ◊ ◊ ◊ ◊ ◊ ◊ ◊ ◊ ◊ ◊ ◊ ◊ ◊ ◊ ◊ ◊ ◊ ◊ ◊ ◊ ◊ ◊ ◊ ◊ ◊ ◊ ◊ ◊ ◊ ◊ ◊ ◊ ◊ ◊ ◊ ◊ ◊ ◊ ◊ ◊ ◊ ◊ ◊ ◊ ◊ ◊ ◊ ◊ ◊ ◊ ◊ ◊ ◊ ◊ ◊ ◊
░▒▓█ CMYK ◊ RMI █▓▒░
CMYK RMI◊ Introduction
I started using this script because of its fast reaction, and good tell for buy/sell moments on a short timescale.
For larger timescales, the overall trend should be taken into account regarding the levels.
In the future i will update this indicator, to automatically adjust those.
◊ Origin
The Relative Momentum Index was developed by Roger Altman and was introduced in his article in the February, 1993 issue of Technical Analysis of Stocks & Commodities magazine.
While RSI counts up and down days from close to close, the Relative Momentum Index counts up and down days from the close relative to a close x number of days ago.
This results in an RSI that is smoother.
◊ Adjustments
CMYK color theme applied.
Four levels to indicate intensity.
Two Timescales, to overview the broader trend, and fast movements.
◊ Usage
RMI indicates overbought and oversold zones, and can be used for divergence and trend analysis.
◊ Future Prospects
Self adjusting levels, relative to an SMA trend.
Alternative RMI, which functions as an overlay.
◊ ◊ ◊ ◊ ◊ ◊ ◊ ◊ ◊ ◊ ◊ ◊ ◊ ◊ ◊ ◊ ◊ ◊ ◊ ◊ ◊ ◊ ◊ ◊ ◊ ◊ ◊ ◊ ◊ ◊ ◊ ◊ ◊ ◊ ◊ ◊ ◊ ◊ ◊ ◊ ◊ ◊ ◊ ◊ ◊ ◊ ◊ ◊ ◊ ◊ ◊ ◊ ◊ ◊ ◊ ◊ ◊ ◊ ◊ ◊ ◊ ◊ ◊ ◊ ◊ ◊ ◊ ◊ ◊ ◊ ◊ ◊ ◊ ◊ ◊ ◊ ◊ ◊ ◊ ◊ ◊ ◊ ◊ ◊ ◊ ◊ ◊ ◊ ◊ ◊ ◊ ◊ ◊ ◊ ◊ ◊ ◊ ◊ ◊ ◊ ◊ ◊ ◊ ◊ ◊ ◊

Relative Momentum Index Strategy The Relative Momentum Index (RMI) was developed by Roger Altman. Impressed
with the Relative Strength Index's sensitivity to the number of look-back
periods, yet frustrated with it's inconsistent oscillation between defined
overbought and oversold levels, Mr. Altman added a momentum component to the RSI.
As mentioned, the RMI is a variation of the RSI indicator. Instead of counting
up and down days from close to close as the RSI does, the RMI counts up and down
days from the close relative to the close x-days ago where x is not necessarily
1 as required by the RSI). So as the name of the indicator reflects, "momentum" is
substituted for "strength".
WARNING:
- This script to change bars colors.

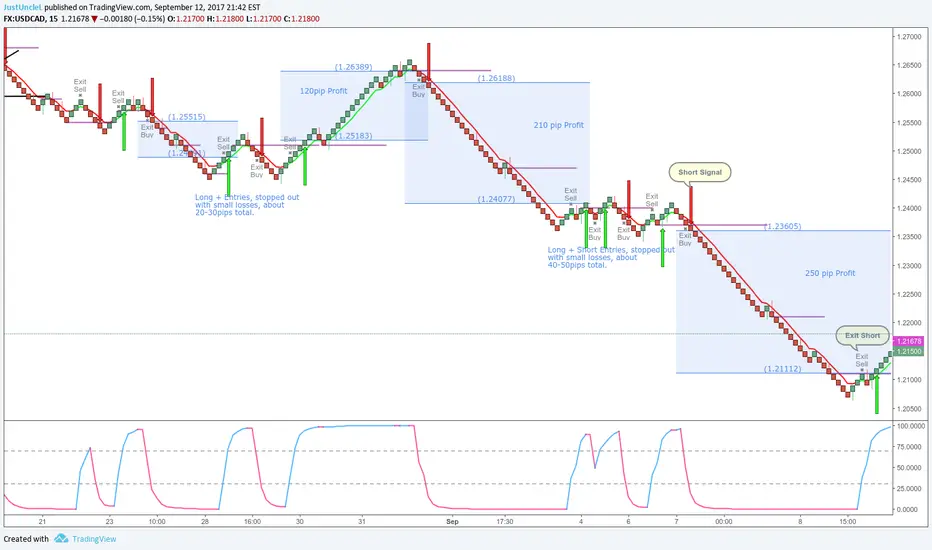
Renko+Moving Average+RMI Alert R3 by JustUncleLThis script idea is designed to be used with 10pip brick (recommended) Renko charts. It combines the Renko price action with a directional coloured EMA (default length 6) and a RMI (instead of the usual RSI) indicator to provide entry and exit signals. RMI is bit like RSI with a built-in momentum factor and works well with Renko.
Signals can optionally be filtered by Daily or Weekly Open, where by only trade long above open and short below open (this option is enabled by default). Exit occur when EMA or RMI reverses direction, or optionally (disabled by default) when the Renko prints a brick in the reverse direction. Each Entry and Exit signal creates an Alertcondition that can be picked up by the TradingView Alarm system.
TIP: To get 10pip Bricks set Renko to "Traditional" type bricks and 0.001 for non-JPY currency pairs, and 0.1 for JPY currency pairs. Also set chart Time frame to 5min or 15mins.
References:
TheLark Relative Momentum Index (RMI)
Relative Momentum Index The Relative Momentum Index (RMI) was developed by Roger Altman. Impressed
with the Relative Strength Index's sensitivity to the number of look-back
periods, yet frustrated with it's inconsistent oscillation between defined
overbought and oversold levels, Mr. Altman added a momentum component to the RSI.
As mentioned, the RMI is a variation of the RSI indicator. Instead of counting
up and down days from close to close as the RSI does, the RMI counts up and down
days from the close relative to the close x-days ago where x is not necessarily
1 as required by the RSI). So as the name of the indicator reflects, "momentum" is
substituted for "strength".
