trailing_drawdown
Description:
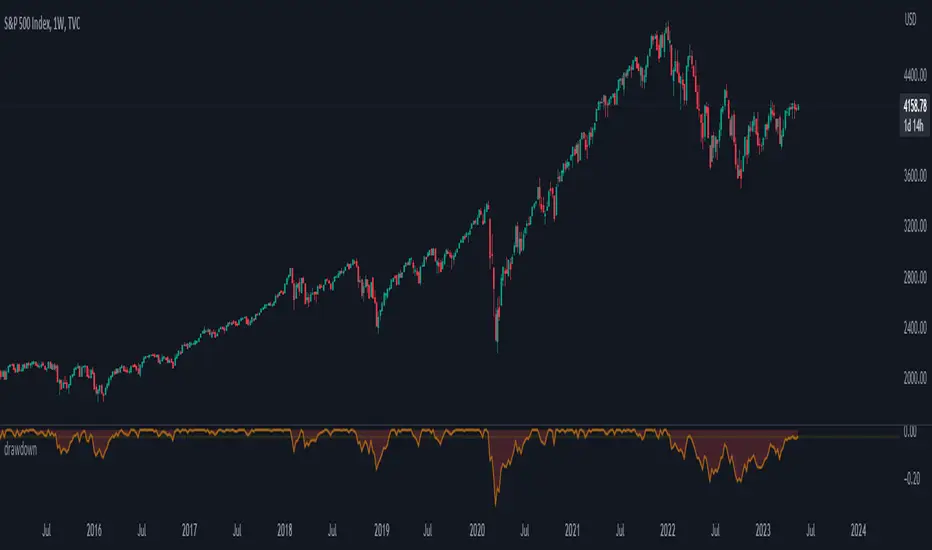
Drawdown was a tool to measure historical risk, derived from measuring current wealth from its previous peak, casually from portfolio construction (weights allocation), will consider to having a minimum drawdown. In this indicator, the drawdown for individual assets is utilized to measure its value or percentage from its trailing peak (default to 1-yr period).
Drawdown:
drawdown = (price/peaks)-1
Feature:
Static: display drawdown as percentage
Dynamic: display drawdown as value
Pine Script® göstergesi