ADR in 0.5 / 1 / 3 / 5top of the morning!
This indicator is a tiny bit different then the previous one i published.
As per my little study into the ATR, i have decided to remove it out of my indicator and instead put in a half an ADR in dollar vallue.
For me, i can use this value to check at what level i would like my stop. The next evolvement of this indicator might be a total new one since i'd be one for a lower timeframe with the 0.5 and 0.3 adr down from current high otd.
Hope you enjoy it,
Peace
Risk!!!

Bitcoin Risk Long Term indicatorOBJECTIVE:
The purpose of this indicator is to synthesize via an average several indicators from a wide choice with in order to simplify the reading of the bitcoin price and that on a long term vision.
Useful for those who want to see things simply, typically to make a smart DCA based on risk.
I originally used this script as a sandbox to understand and test the usefulness of several indicators, and to develop my PineScript skills, but finally the Risk Indicator output seems relevant so I decided to share it.
USAGE:
The selected indicators are the ones that I think give the best market bottoms, but the idea here is that anyone can try and use any set of indicators based on those preferences (post in comments if you find a relevant config)
Most of the indicator inputs are configurable. And some are not taken into account in the calculation of the Risk indicator because I consider them not relevant, this script is also a test more than a final version.
NOTES :
If you have any idea of adding an indicator, modification, criticism, bug found: share them, it is appreciated!
In the future I will create another more versatile Risk indicator that will not be focused on bitcoin in weekly. (this indicator is still usable on other assets and timeframe)
THANKS:
to Benjamin Cowen for inspiring me with his Bitcoin Risk metric
to Lazybear for his Wavetrend Indicator and all the scripts he shares
to Mabonyi for his Bitcoin Logarithmic Growth Curves & Zones script
to VuManChu for his VMC Cypher B Divergence
to the Trading view team for developing TV and PineScript
And to all the community for all the published codes that allowed me to progress and create this script
---- FR ----
OBJECTIF :
L'objectif de cet indicateur est de synthétiser via une moyenne plusieurs indicateurs parmi un large choix avec afin de simplifier la lecture du cours de bitcoin et cela sur une vision longue terme.
Utile pour ceux qui veulent voir les choses simplement, typiquement faire un DCA intelligent en fonction du risque.
À la base j'ai utilisé ce script comme un bac à sable pour comprendre puis tester l'utilité de plusieurs indicateurs, et développer mes compétences PineScript, mais finalement l'output Risk Indicateur me semble pertinent donc autant le partager.
UTILISATION :
Les indicateurs sélectionnés sont ceux qui permettent selon moi d'avoir les meilleurs point bas de marché, mais l'idée ici est que chacun puisse essayer et utiliser n'importe quel ensemble d'indicateur en fonction de ces préférences (poster en commentaire si vous trouvez une configuration pertinente)
La plupart des inputs indicateurs sont paramétrables. Et certains ne sont pas pris en compte dans le calcul du Risk indicateur car je les estime non pertinent, ce script est aussi un essai plus qu'une version finale.
NOTES :
Si vous avez la moindre idée d'ajout d'indicateur, modification, critique, bug trouvé : partagez-les, c'est apprécié !
à l'avenir je créerais un autre Risk indicator plus polyvalent qui ne sera pas focalisé sur bitcoin en weekly. (cet indicateur est tout de même utilisable sur d'autre actif et timeframe)
REMERCIEMENT :
à Benjamin Cowen pour m'avoir inspiré avec son Bitcoin Risk metric
à Lazybear pour son Wavetrend Indicator et globalement tout les scripts qu'il partage
à Mabonyi pour son script Bitcoin Logarithmic Growth Curves & Zones
à VuManChu pour son VMC Cypher B Divergence
à l'équipe Trading view pour avoir développé TV et PineScript
Et à toute la communauté pour tous les codes publiés qui m'ont permis de progresser et de créer ce script

VIX Strategy : Risk-ON, Risk-OFF
VRatio is the ratio of VIX3M and VIX. This ratio rises above 1.1; in a bear market, it decreases and goes below 1. VRatio=VIX3M/VIX. More details in Part 2.
VRatio > 1: Risk-On signal
Contango is the ratio of VX2 (first back-month contract) and VX1 (front-month contract) minus one. In a bull market, this indicator rises above 5%’ in a downtrend market, this indicator goes below -5%. More details in Part 2.
Contango > -5%: Risk-On signal
Contango Roll is the ratio of VX2 first back-month contract) and the VIX minus one. In a bull market, this indicator rises above 10%’ in a downtrend market, this indicator goes below -10%. More details in Part 2.
Contango Roll > 10%: Risk-On signal
Volatility Risk Premium (VRP) compares the implied volatility to the recent realized volatility; it attempts to quantify how much “extra” premium (in volatility term) S&P500 option sellers are charging investors for the protection of their portfolio. It can be seen as an insurance premium. A simple way to compute the VRP is VRP= VIX -HV10 where HV10 is the 10-day historical volatility of S&P500. Some people also look at the 5-day moving average of the VRP to smooth this indicator.
VRP > 0: Risk-On signal
Fast Volatility Risk Premium (FVRP) is a variant of the VRP. FVRP=EMA(VIX,7)-HV5 where HV5 the 5-day historical volatility of S&P500.
FVRP > 0: Risk-On signal
Volatility Momentum compares today’s VIX to last 50 days. It has, therefore, quite a bit of lag but it is a useful measure when combined with other indicators. Volatility Momentum=SMA(VIX,50) -VIX.
Volatility Momentum > 0: Risk-On signal
VIX Mean Reversion looks at today’s VIX compared to certain thresholds. We avoid investing in the S&P500 when the VIX is too high (above 20) or too low (below 12).
VIX Mean Reversion > 12 and VIX Mean Reversion < 20: Risk-On signal
VIX3M Mean Reversion works the same way as VIX Mean Reversion.
VIX3M Mean Reversion > 12 and VIX3M Mean Reversion < 20: Risk-On signal

Position Sizing CalculatorThis is an intuitive risk management tool with a minimalist design.
This calculator will determine your position size per trade, profit, loss, risk/reward ratio and leverage if any.
It will calculate your leverage if you are trading financial instruments e.g. Mini Futures , Turbo Warrants etc. that have a financing level.
Tip: Use this as a complement to the Long/Short Position tool.
Provide the following inputs to get a calculation:
- Position type
- Account balance
- Risk per trade percentage
- Financing level (if any for leveraged instruments), else let it be 0
- Entry price
- Target price
- Stopp loss price
You can also choose the color of the output text, its background and position in the chart window.
Enjoy!

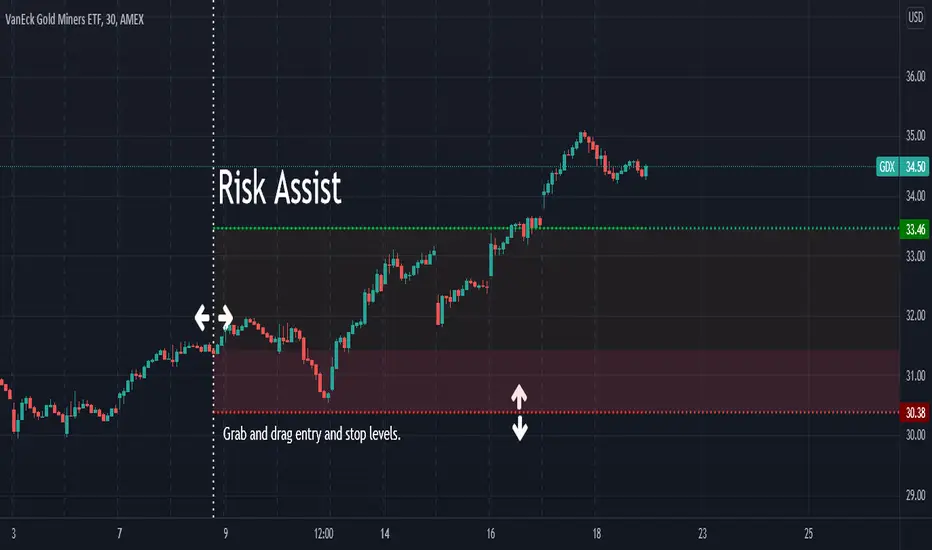
Risk AssistAs the profit level increases, the amount of profit taking required to avoid risk asymptotically reaches zero.
This indicator displays the % of the established position required to exit in order to ensure the trade is not a loss if the stop is hit.
Values in green (at or below 100%) indicate a winning position.
Values in red (above 100%) indicate a losing position.
Alert Examples:
If you are intent on "selling half" to avoid risk, you can set an alert on the value of this indicator for 50.
If you are intent on "selling a 3rd" to avoid risk, you can set an alert on the value of this indicator for 33.3.
Market Risk IndicatorThere are many tools for swing traders. Position traders have not as much, perhaps because they live in the fringe zone between fundamental analysis and trend following.
In order to bridge this gap between fundamental analysis and technical analysis on large timeframes, we decided to work on building a market indicator that assesses its risk and quantifies it on a single dimension number.
The challenge is to consider as input different assets, that individually are themselves often market driving forces, and collectively, more often than not, are sufficient to determine the market status quo.
We came up with DXY , US10Y , HYG and WTI. The latter, the bigger the better; the former, vice versa.
Each asset is evaluated against its recent max/min range, percentually. The positive ones add up and vice versa.
This is still ongoing work. the math and code are simple. the heart of the matter is selecting the proper assets and processing them even better.
Thank you.

TDR (Trend Direction & Risk) IndicatorIntroduction
The TDR (Trend Direction & Risk) Indicator combines two of my previous indicators into one. TDR helps to visually identify price trends and also measures the risk of entering a position during that trend. This indicator is a combination of Ichimoku cloud techniques, particularly the Kijun-Sen and the percentage price oscillator (PPO) to measure a risk score.
Using the TDR Indicator
There are two main indicator lines, the blue line represents a moving average which can act as support or resistance and the orange and red line is called the trend base. When price crosses the trend base and the moving average also crosses then a change in trend direction is confirmed. This is confirmed with either a Buy or Sell signal.
In between these signals there are also Dollar Cost Average and Take Profit signals based on the current trend direction. Each of these signals gives a warning, indicated with an x above or below the candle accompanied with a b for (buy) or an (s) for sell. The next candle will display a small triangle as confirmation of this signal. These signals are based on a cross of the Advance Signal Price which is show at the current price candle.
The future base level can be set to show a larger macro trend than the current timeframe. An example of this is the 3 day timeframe which I use to determine if Bitcoin is in either a bull or bear market.
The Dollar Cost Average and Take Profit signals recommend to buy or remove a percentage of your position at these points. This percentage is completely down to personal preference.
Risk & Information Box
At the bottom right of the chart there is an information box which contains some Information. It shows the current recommended position based on the signals mentioned above. It also shows a risk score which ranges from -100 to 100. This can be used in combination with the signals and trend above for additional entry points. There are three levels, Low, Neutral and High. Buying a percentage of a position at a low risk level and selling a percentage of a position at a high risk level in combination with the trend signals is recommended.
S/R and Base Percentage
These boxes show the price percentage distance from the blue S/R line and the Trend Base Line. These larger these percentages the more likely a snap back in price towards these lines is likely. In my testing once these get above 20% or -20% the chance the price will move back towards those lines is more likely.
Users who have access to my other scripts will be given access to this one and those old ones will no longer me maintained or updated.

Market Hedge RatioRatio of crypto (total, Bitcoin, or Ethereum market cap) to major stable coins.
A low ratio suggests a lot of people are sitting in cash (sidelined if crypto rallies).
A high ratio suggests possible demand saturation.

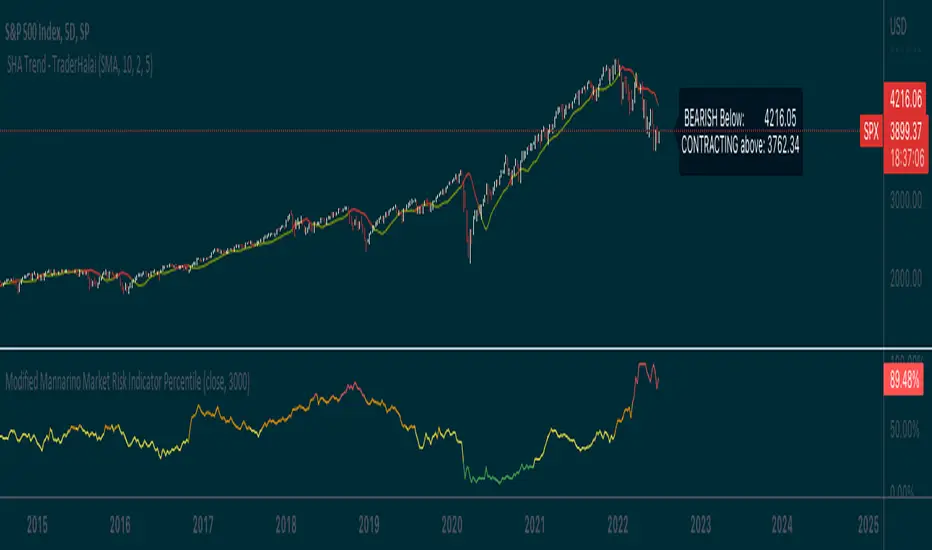
Modified Mannarino Market Risk IndicatorThis indicator is meant to give an overall indication of risk and a very basic implementation of the modified mannarino market risk indicator. I take no credit for the original formula, and just decided to hack this together so that it could be useful to the community
Zeal Trade HelperOnce you have mastered a trading strategy, risk management is the most important aspect of trading that will enable and long and successful trading career. The Zeal Trade Helper is based on Van Tharp's theory of R. It provides an immediate visual trading plan, as well as sizing parameters for trading equity and options (.25 and .50 deltas) based on a number of inputs to help you avoid needing to do quick mental math in the moment of taking a trade.
HOW TO USE
- First, you will need to input your R value. To find your R value, divide your **average green day** by the **average number of trades you take in a day**. Once you have this number, enter it into the "Your R Value" field in the indicator settings.
- The indicator settings then provides you with 5 different setup entries. When you have your watchlist ready for the day, simply go through and choose the specific stock, enter your entry price, stop loss, target, and setup type (build, short, bounce, or reject).
OUTPUTS
**Trading Plan**
The indicator will display a visual trading plan based on the inputs you entered on each individual stock's chart. The trading plan will have a green box and red box to represent your entry, target, and stop loss.
**Risk Parameters**
The indicator will also display text outlining what your risk parameters and sizing should be for the trade based on your R value. You will see 3 different lines: the first line showing the number of shares you can trade, the second line showing the number of option contracts you can trade at .50 delta, and the third line showing the number of option contracts you can trade at .25 delta. For reference, at the money options are .50 deltas. Even if you aren't trading exactly .50 or .25 deltas, these values will still help as a frame of reference in the moment of putting on the trade.
**Note that you can toggle the appearance of either of these outputs by checking/un-checking the boxes next to "Display trading plan" and "Display risk parameters" in the indicator settings.
Examples:
1. "**240 shares with $1.25 risk**" means you can take 240 shares and risk $1.25 on the share's price based on your R value
2. "**4.8 Cons @ .50 delta with $0.62 risk**" means you can take either 4 or 5 at the money option contracts and risk $0.62 **on the option contract's value** based on your R value
3. "**9.8 Cons @ .50 delta with $0.31 risk**" means you can take either 9 or 10 option contracts that have a .25 delta (a bit out of the money) and risk $0.31 **on the option contract's value** based on your R value
Happy Trading!

Value-at-Risk Value-at-Risk is a risk measurement tool widely used by banks and institutions.
This script uses historical simulation method for the calculation of VaR. The default settings are 250-days period. 1 percentile (or 99 percentile confidence level.)
This means the daily loss for the past 250 days should not exceed the risk measure 99% of the time.
traders can calculate the desired level of risk by converting the timeframe OR by multiplying the square root (expected holding period) to find out the VaR value for 5 days, 25 days, 250 days etc.
Do take note that the default assumes a long position, if you are taking a short position, the percentile value has to be adjusted accordingly (to find the worst 1 percent loss for shorts will require changing the input to 99)

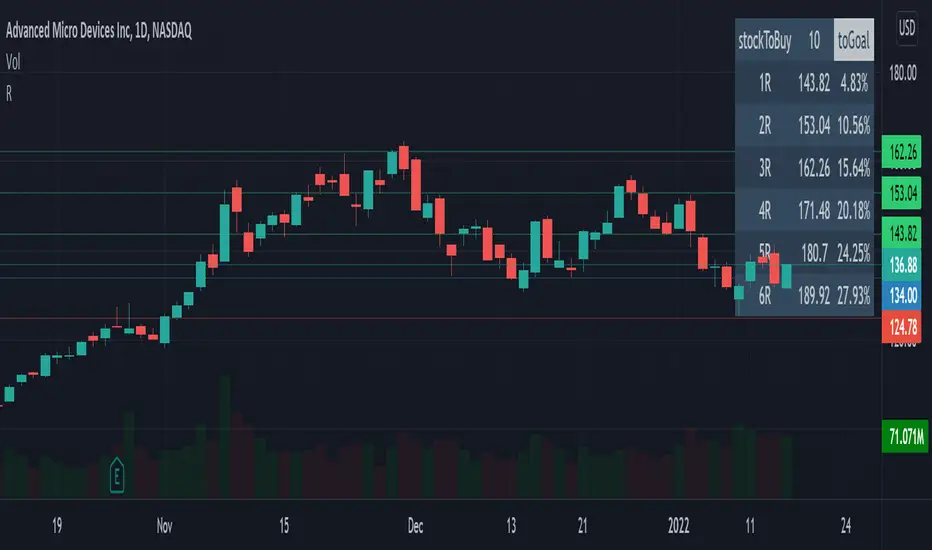
R-Calculator
Visualise your possible 1R to 6R prices, based on your Risk($), entry and stoploss price, and see the distance until the goal is fulfilled.
It also provides you with a suggested amount of stocks to buy, so if you lose, it will match -1R.
SignalsThis script allows you to calculate position size, and future profit, loses.
- You can add 3 target values and 1 stop loss
- Optionally you can display table, position it as you like, and see risk ratio
Plans:
- add profit loss to the labels

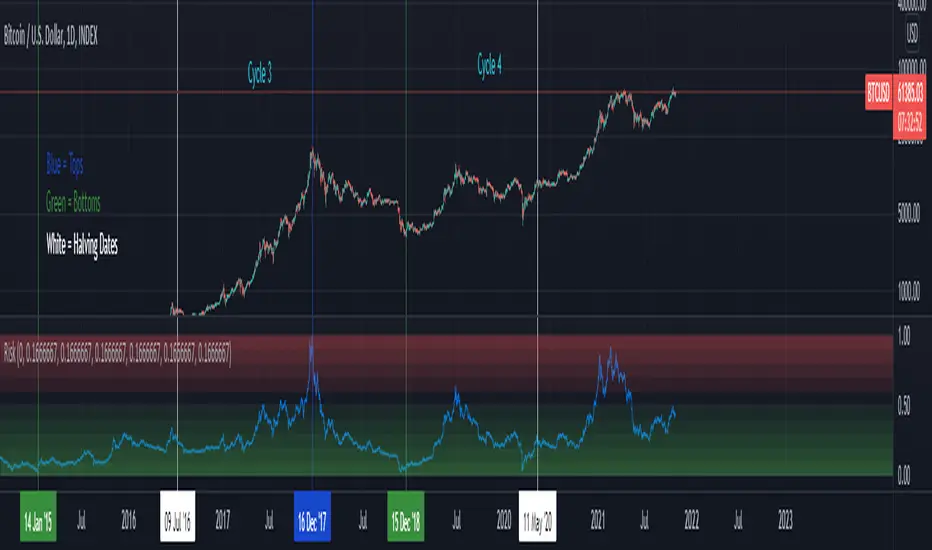
BTC Risk Metric - Estimates the risk of BTC price versus the USD
- To be used on the daily timeframe
- Works best on a BTC pair that has a lot of bars, e.g. The Bitcoin All Time History Index
- 0 is the lowest risk, 1 is the highest risk
- Historically, buying when the risk was low and selling when the risk was high would have yielded good ROI
- The risk bands are 0.1 in width and are highlighted on the plot
Typical Strategy:
- weighted DCA into the market when risk <0.5, do nothing between 0.5-0.6 and weighted DCA out of the market when risk >0.6
- x = buy amount per DCA interval
- y = 1/10th total BTC held by the user
- if 0 ≤ Risk < 0.1 then buy 5x
- if 0.1 ≤ Risk < 0.2 then buy 4x
- if 0.2 ≤ Risk < 0.3 then buy 3x
- if 0.3 ≤ Risk < 0.4 then buy 2x
- if 0.4 ≤ Risk < 0.5 then buy x
- if 0.5 ≤ Risk < 0.6 then do nothing
- if 0.6 ≤ Risk < 0.7 then sell y
- if 0.7 ≤ Risk < 0.8 then sell 2y
- if 0.8 ≤ Risk < 0.9 then sell 3y
- if 0.9 ≤ Risk ≤ 1.0 then sell 4y

Position size FX and CryptoThis indicator I am using to calculate the position size to order for Forex and Crypto Future

Risk adjusted returns data (volatility optimised)RAR - risk adjusted returns. This methodology could be helpful in portfolio creation and position size risk management. We can set our own preference of risk tolerance via the X variable which is the exponent of volatility in our calculations. This gives an unlimited set of example portfolios on a given time-frame that can be sorted from return oriented to volatility reduction oriented as X increases. RARs are to be compared against eachother.

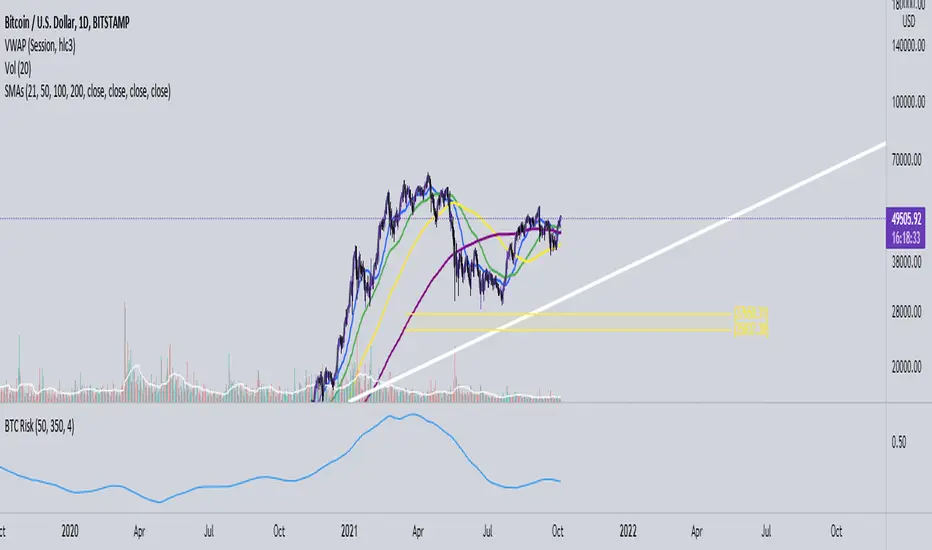
BTCUSD Risk Oscillator- To be used with the BTCUSD All Time History Index (on the daily)
- Estimates the current risk of BTCUSD
- The risk model oscillates between 0 and 1 (0 is the lowest risk, 1 is the highest)
- Historically, buying when the risk is low and selling when the risk is high yields good ROI
- User inputs generally do not need to be changed, they are used to create integers for the normalization process
cowen risk indexThis is my attempt at remaking the cowen risk index. It's definitely not correct, but should give a rough estimate of where his indicator is at. I am taking the price divided by the 400sma to get an oscillator, then we need to account for diminishing returns so I just made an exponentially increasing variable and mutliplying that by the oscillator value. Then I normalized the data as best as I could. Not sure exactly how to do that so if anyone has any suggestions, please let me know.
This only works on the daily and weekly timeframe. You will need to edit the code if you want to have it work for other timeframes.

Bjorgum AutoTrailOne Time Trade Risk Management
Incorporating the new interactive feature, this script is meant as a one time trailing stop for the active trader to manage positional risk of an ongoing trade. As a crypto trader or Fx trader, many may find themselves in a position late into the evening, or perhaps daily life is calling while a trade progresses in their favor. Adding a trailing stop to a position thats trending can help to keep you in the trade and lock in gains if things turn around when you are unable to react.
To use the trail, the user would add the script to the chart. Once added, a set of crosshairs will appear allowing the user to choose a point to begin. Often choosing to start a trail from a swing high/ low can be an ideal option. This tends to provide some protection for a stop by placing it under support for a long trade or above resistance for a short trade.
Price based trail
The trail will automatically plot and the offset is a factor of the distance from price action selected by the crosshairs. If placed above price action the script will plot a short trail, if placed below it will trail for a long position.
Additionally, there are several other trail types other than price based. There is also percent based, which offsets the trail as a percent from close. A hard stop is placed at the cross hair value, then once the distance is exceeded by the percentage specified, the trail begins.
There are 2 more volatility based trails. There is a PSAR trail which can provide quicker and tighter stops that accelerate with the trend locking in gains faster, and an ATR trail that keeps a distance from price action as a function of volatility. Volatility levels can be adjusted from the menu.
Volatility based trail (ATR)
Volatility based trail (PSAR)
Lastly, within the code for more the more technical savvy, is some starting setups for string alerts to be sent to exchanges via 3rd party or custom API applications. Some string manipulation is required for specific providers to meet their requirements, but there is some building block alerts that will take the ticker symbol, recognize the asset your trading (Fx, Crypto, etc) and take input quantity or exchange names from the settings via inputs.
Complex strings can be built to perform almost any trade related task when to comes to alerts via web hook. A little setup this way with some technology to back your system can mean a semi-automated half man, half machine setup that actually manages your trail stop while you cannot. For those that don’t go this far, there is some basic alert functionality that well trigger when a trail is hit so you can react and make a decision.
Please note that for now, interactive mode is engaged only when the script is added to the chart. Additional stops, or for adjustments to be made it is best to add a new version. Also as real trades could be at play managing an actual position, alerts are designed to go off only once to ensure no duplicate orders are sent meaning alerts are not reoccurring. Once an alert is triggered, a new trail is to be set up.
A modified version of the TradingView built in SAR equation was used in this script. To provide the value of the SAR on the stop candle, it was necessary to alter the equation to extract this value as the regular SAR “flips” at this point. Thank you to TradingView for supplying access to the built in formula so that this SAR could behave the same as the built-in function outside of these alterations
Example of SAR value maintained in trigger candle
Cheers and happy trading.

Bitcoin Risk Indicator (Daily)This indicator calculates the risk of buying and selling BTC, if the risk is reaching the upper boundaries of 0.8 to 1 then BTC is either getting close to a market cycle top or is far over extended.
If BTC is below 0.4 then this inidicates the least amount of Risk to buy BTC.
Mavara Market Mood"Mavara Market Mood" is a fundamental-based Indicator that shows the overall mood of the financial markets.
When people are willing to buy USD as a reserve currency against other instruments and feel uncertain and don't want to risk their trades, the Market Mood is Risk-OFF.
Conversely, When the traders are optimistic about the economic situation and are willing to sell USD against other instruments, the Market Mood is Risk-ON.
While DXY is trending up and US500 is trending down, the indicator shows a risk-OFF mood with red and refers to the traders' eagerness to make riskier trades.
While DXY is trending down and US500 is trending up, the indicator shows a risk-ON mood with green and refers to the traders' reluctance to make riskier trades.
When you find the histogram below zero, the market is on a high-risk-Off mode. Conversely, When you find the histogram above zero, the market is in a high-risk-ON mood.
In summary, you can buy USDCAD in a risk-OFF mood and sell it in the risk-on mood.

Risk Management Tool [LuxAlgo]Good money management is one of the fundamental pillars of successful trading. With this indicator, we propose a simple way to manage trading positions. This tool shows Profit & Loss (P&L), suggests position size given a certain risk, sets stop losses and take profit levels using fixed price value/percentage/ATR/Range, and can also determine entries from crosses with technical indicators which is particularly handy if you don't want to set an entry manually.
1. Settings
Position Type: Determines if the position should be a "Long" or "Short".
Account Size: Determines the total capital of the trading account.
Risk: The maximum risk amount for a trade. Can be set as a percentage of the account size or as a fixed amount.
Entry Price: Determines the entry price of the position.
Entry From Cross: When enabled, allows to set the entry price where a cross with an external source was produced.
1.1 Stop Loss/Take Profit
Take Profit: Determines the take profit level, which can be determined by a value or percentage.
Stop Loss: Determines the stop loss level, which can be determined by a value or percentage.
2. Usage
One of the main usages of position management tools is to determine the position size to allocate given a specific risk amount and stop-loss. 2% of your capital is often recommended as a risk amount.
Our tool allows setting stop losses and take profits with different methods.
The ATR method sets the stop loss/take profit one ATR away from the entry price, with the ATR period being determined in the drop-down menu next to the selected methods. The range method works similarly but instead of using the ATR, we use a rolling range with a period determined in the drop-down menu next to the selected methods as well.
Unlike the available position management tool on TradingView, the entry can be determined from a cross between the price an an external source. The image above shows entries from the Volatility Stop indicator. This is particularly useful if you set positions based on trailing stops.

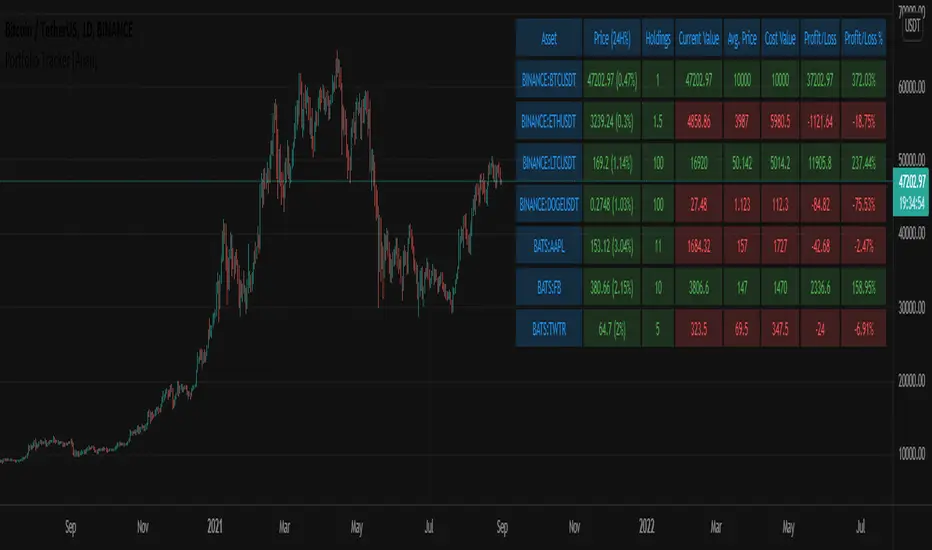
Portfolio Tracker [Anan]█ OVERVIEW
A simple Portfolio Tracker to track your Profit/Loss for any ticker in any market (stock, futures, index, forex, crypto, fund, dr.).
You just need to input (Asset / Quantity / Avg. Buy/Sell Price) and the script will calculate everything.
Also, you can use it for paper trading, or even what-if cases..
█ FEATURES
- Up to 10 positions
- Track your position real-time price and 24H change %
- Calculate your position current value
- Calculate your position cost value
- Calculate Profit/Loss
- Calculate Profit/Loss %
- Change every color in the table as you like.