Kram Dollar Risk SizingFlat-Based Risk Sizing Table
Quick, reliable contract counts for any fixed per-point risk—no math required.
---
Overview
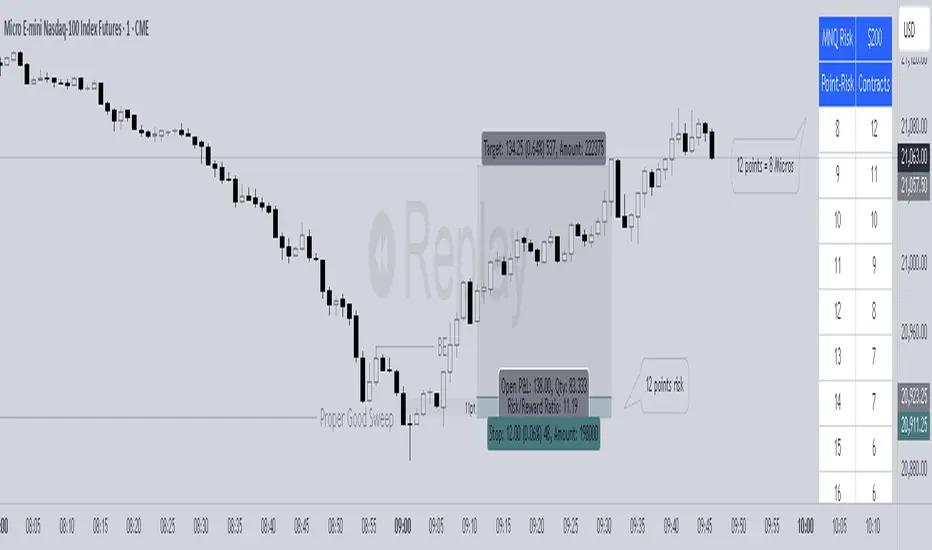
This indicator draws an on-chart lookup table showing exactly how many micro-E-mini contracts to trade for a given index-point stop distance. Simply pick your market (MNQ or MES) and your target dollar-risk tier (200 USD, 300 USD or 400 USD); the script handles the rest. Perfect for pre-trade sizing at a glance.
---
Key Benefits
Instant Sizing : See “Point Risk → # Contracts” without ever opening a calculator.
Error-Proof : Table size adapts automatically so you’ll never hit an “out of bounds” error.
Consistent Execution : Apply the same risk grid every time and eliminate second-guessing.
Custom Look : Match your chart’s theme by adjusting colors, fonts, borders and placement.
---
Inputs & Settings
Data Inputs
1. Instrument
Choose **MNQ** (Micro-Nasdaq) or **MES** (Micro-S\&P).
2. Price Tier
Select the total dollar-risk you want each grid to represent: **200**, **300** or **400** USD.
3. Table Position
Anchor the table in any corner or midpoint of your chart.
Appearance Settings
Title Background Color and Text Color
Header Background Color and Text Color
Body Background Color and Text Color
Font Size (tiny ▶ large)
Column Widths (set character-based widths for each column)
Border Width and Frame Width (outline thickness)
---
How to Use
1. Add the Script
Add the indicator to your chart.
2. Configure Data
Set Instrument to MNQ or MES.
Set Price Tier to the dollar-risk level you want.
Choose a Table Position that doesn’t block your price action.
3. Style to Your Taste
Tweak all appearance settings so the table blends in or stands out as you prefer.
4. Read & Trade
Left Column lists your stop-distance in index-points (e.g. 8.0, 12.0, 25.0).
Right Column shows exactly how many contracts match your chosen dollar-risk.
Find the row matching your planned stop and place your order with confidence.
---
Tips & Reminders
Points, Not Ticks : Always enter your stop in full index-points (e.g. “8.0”), even though the market moves in 0.25-point ticks.
Validate Your Data : If you ever edit the dollar-risk tiers or add new ones, be sure each contract count equals
“floor( tier ÷ (pointRisk × \$/point) )”
---
Disclaimer:
This tool is provided “as-is” for guidance. Always verify contract counts against live tick values before trading. Trade responsibly!
Credit
Credit to Tempo Trades for the formula that this indicator is based on
Risk!!!
Kram Risk PercentStreamline Your Trading with Instant, Percent-Based Position Sizing
Take the guesswork—and the calculator—out of your risk management. This on-chart tool turns your account size and chosen risk percentage into exact contract counts across a range of stop-distances, so you can focus on the market, not the math.
---
What It Does for You
Your Risk, Your Rules
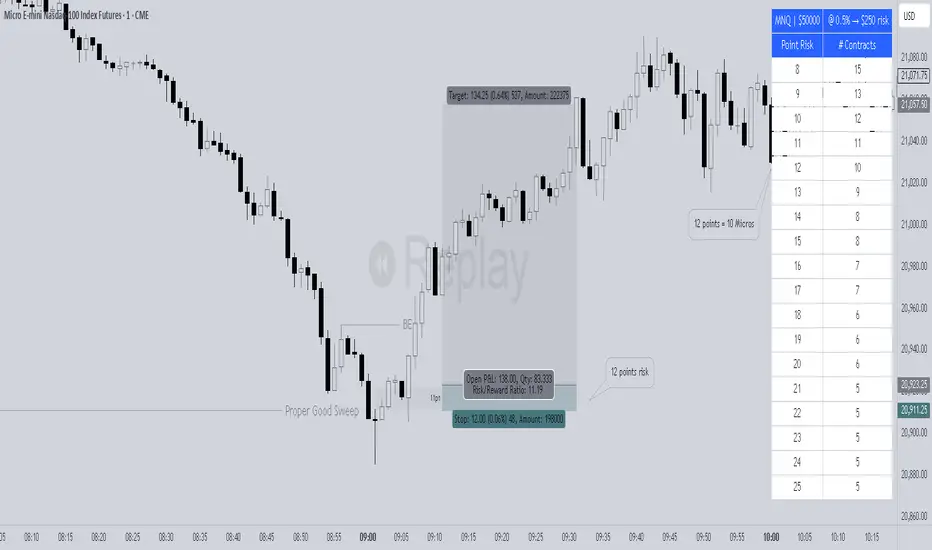
Enter your total account value (e.g. $50 000) and the exact percent you’re willing to risk (e.g. 1.0 %). The script immediately calculates your dollar-risk (in this case, $500).
Market-Specific Pricing
MNQ (Micro-Nasdaq) : $2 per index-point (each 0.25 pt “tick” = $0.50).
MES (Micro-S\&P) : $5 per index-point (each 0.25 pt “tick” = $1.25)
Point-Risk to Contracts
You get a clean table that lists **Index-Point Stop (e.g. 2.0 pts)** → **# of Contracts**. No confusion between “ticks” and “points”: you choose your stop in full index-points, and the script does the rest.
At-a-Glance Summary
The table header reminds you:
MNQ | $50 000 @ 1.0 % → $500 risk
so you always know exactly what you’re sizing.
Fully Customizable Look
Pick your background and text colors, font size, column widths, table border thickness—and place it in any corner or edge of your chart.
---
Step-by-Step Usage
1. Add the Indicator
Apply “Percent Risk Sizing Table” to your chart in TradingView.
2. Enter Your Parameters
Instrument**: MNQ or MES
Account Size : Your total equity in dollars
Risk % : The percent of your account you’ll risk (e.g. 0.5 %, 2 %)
3. Read the Table
Column 1 : Stop-distance in index-points (1.0, 1.5, 2.0…)
Column 2 : How many contracts you should trade to risk exactly your chosen dollar amount.
4. Customize Appearance
Use the style inputs to match your chart theme:
Colors : Title, header, body
Font size : tiny → large
Column widths : narrow → wide
Border & frame : subtle → bold
Position : any corner or middle edge
5. Execute with Confidence
No manual math. No guessing. Just scan to the row matching your planned stop-distance and place your order.
---
Tips for Best Results
Think in Points, Not Ticks
Always enter your stop as a whole number of index-points (e.g. 2.0 points), even though the market moves in 0.25-point ticks.
Adjust on the Fly
Change your risk % or switch instruments and watch the table update instantly.
---
Add this indicator now and make every trade sized precisely to your rules—because consistent risk control is the foundation of consistent profits.
🛡️ Disclaimer
This script is educational and provided “as-is.” Always verify contract counts with your broker’s live tick values before executing real orders. Trade responsibly and keep your risk in check!
MVRV Ratio [Alpha Extract]The MVRV Ratio Indicator provides valuable insights into Bitcoin market cycles by tracking the relationship between market value and realized value. This powerful on-chain metric helps traders identify potential market tops and bottoms, offering clear buy and sell signals based on historical patterns of Bitcoin valuation.
🔶 CALCULATION The indicator processes MVRV ratio data through several analytical methods:
Raw MVRV Data: Collects MVRV data directly from INTOTHEBLOCK for Bitcoin
Optional Smoothing: Applies simple moving average (SMA) to reduce noise
Status Classification: Categorizes market conditions into four distinct states
Signal Generation: Produces trading signals based on MVRV thresholds
Price Estimation: Calculates estimated realized price (Current price / MVRV ratio)
Historical Context: Compares current values to historical extremes
Formula:
MVRV Ratio = Market Value / Realized Value
Smoothed MVRV = SMA(MVRV Ratio, Smoothing Length)
Estimated Realized Price = Current Price / MVRV Ratio
Distance to Top = ((3.5 / MVRV Ratio) - 1) * 100
Distance to Bottom = ((MVRV Ratio / 0.8) - 1) * 100
🔶 DETAILS Visual Features:
MVRV Plot: Color-coded line showing current MVRV value (red for overvalued, orange for moderately overvalued, blue for fair value, teal for undervalued)
Reference Levels: Horizontal lines indicating key MVRV thresholds (3.5, 2.5, 1.0, 0.8)
Zone Highlighting: Background color changes to highlight extreme market conditions (red for potentially overvalued, blue for potentially undervalued)
Information Table: Comprehensive dashboard showing current MVRV value, market status, trading signal, price information, and historical context
Interpretation:
MVRV ≥ 3.5: Potential market top, strong sell signal
MVRV ≥ 2.5: Overvalued market, consider selling
MVRV 1.5-2.5: Neutral market conditions
MVRV 1.0-1.5: Fair value, consider buying
MVRV < 1.0: Potential market bottom, strong buy signal
🔶 EXAMPLES
Market Top Identification: When MVRV ratio exceeds 3.5, the indicator signals potential market tops, highlighting periods where Bitcoin may be significantly overvalued.
Example: During bull market peaks, MVRV exceeding 3.5 has historically preceded major corrections, helping traders time their exits.
Bottom Detection: MVRV values below 1.0, especially approaching 0.8, have historically marked excellent buying opportunities.
Example: During bear market bottoms, MVRV falling below 1.0 has identified the most profitable entry points for long-term Bitcoin accumulation.
Tracking Market Cycles: The indicator provides a clear visualization of Bitcoin's market cycles from undervalued to overvalued states.
Example: Following the progression of MVRV from below 1.0 through fair value and eventually to overvalued territory helps traders position themselves appropriately throughout Bitcoin's market cycle.
Realized Price Support: The estimated realized price often acts as a significant
support/resistance level during market transitions.
Example: During corrections, price often finds support near the realized price level calculated by the indicator, providing potential entry points.
🔶 SETTINGS
Customization Options:
Smoothing: Toggle smoothing option and adjust smoothing length (1-50)
Table Display: Show/hide the information table
Table Position: Choose between top right, top left, bottom right, or bottom left positions
Visual Elements: All plots, lines, and background highlights can be customized for color and style
The MVRV Ratio Indicator provides traders with a powerful on-chain metric to identify potential market tops and bottoms in Bitcoin. By tracking the relationship between market value and realized value, this indicator helps identify periods of overvaluation and undervaluation, offering clear buy and sell signals based on historical patterns. The comprehensive information table delivers valuable context about current market conditions, helping traders make more informed decisions about market positioning throughout Bitcoin's cyclical patterns.

Position Size CalculatorPosition Size Calculator - User Guide
A simple tool to calculate optimal position size based on your risk preferences, visualize trade levels, and automatically determine trade direction.
Introduction
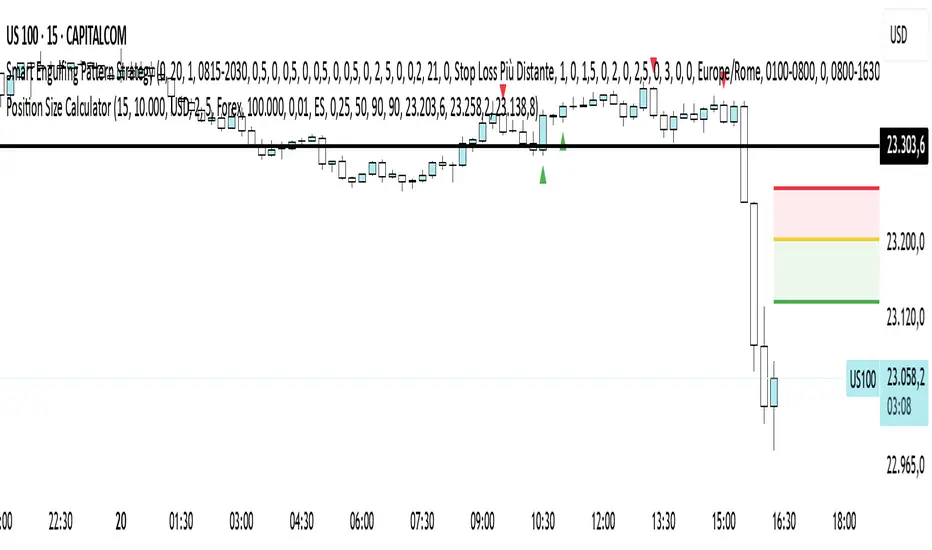
The Position Size Calculator is a TradingView indicator designed to help traders calculate the optimal position size for their trades based on account size and risk tolerance. This tool visually represents entry, stop loss, and take profit levels while automatically calculating the appropriate position size to maintain consistent risk management.
Getting Started
Setting Up Your Account Parameters
Setting Price Levels
Understanding the Visual Elements
Adjusting Your Trade on the Chart
Reading the Information Panel
1. Getting Started
After adding the indicator to your chart, you'll see three horizontal lines representing:
Yellow line: Entry price
Green line: Take profit price
Red line: Stop loss price
The indicator automatically detects whether you're planning a Long or Short trade based on the position of your take profit relative to your entry.
2. Setting Up Your Account Parameters
In the "Position Calculator" settings group:
Account Size : Enter your total account balance
Account Currency : Set your account currency (USD, EUR, etc.)
Risk (%) : Enter the percentage of your account you're willing to risk per trade (e.g., 2%)
Instrument Type : Select your trading instrument (Forex, Futures, Stocks, or Crypto)
Value per 0.01 lot per tick : Enter the value of 0.01 lots per tick (for most Forex pairs, this is $1 per pip for 0.01 lot)
Minimum Lot Size : Set the minimum lot size allowed by your broker (usually 0.01 for Forex)
3. Setting Price Levels
In the "Price Levels" section:
Entry Price : The price at which you plan to enter the trade
Stop Loss Price : Where you'll exit if the trade goes against you
Take Profit Price : Your target price where you'll take profits
If you set Entry Price to 0, it will default to the current price. If Stop Loss or Take Profit are set to 0, they'll default to 5% below or above entry price respectively.
4. Understanding the Visual Elements
Yellow line : Your entry price
Green line : Your take profit level
Red line : Your stop loss level
Green zone : The profit zone (between entry and take profit)
Red zone : The loss zone (between entry and stop loss)
Information panel : Shows all calculations and trade details
5. Adjusting Your Trade on the Chart
The beauty of this tool is its interactivity:
You can drag any of the lines directly on the chart to adjust entry, stop loss, or take profit
If you drag the take profit above the entry , the indicator automatically sets up for a Long trade
If you drag the take profit below the entry , it automatically configures for a Short trade
All calculations and visuals update in real-time as you adjust the lines
This means you can quickly test different scenarios and see how they affect your position size and potential profit/loss.
6. Reading the Information Panel
The information panel displays:
Account details : Your account size and currency
Risk information : Your percentage risk and the equivalent monetary amount
Position Size : The optimal lot size calculated based on your risk parameters
Price levels : Entry, Stop Loss, and Take Profit with distances in ticks
Risk/Reward ratio : Shown as 1:X (where X is the reward relative to 1 unit of risk)
Potential outcomes : The exact amount you stand to gain or lose on this trade
Trade direction : Whether this is a Long or Short trade
Visual Settings
You can customize the appearance in the "Visual" settings group:
Adjust colors for profit and loss zones
Change the transparency of colored zones
Toggle the filling of spaces between lines
Adjust how far the lines extend beyond the last candle
Practical Tips
Always double-check your "Value per 0.01 lot per tick" setting for the specific instrument you're trading
For Forex major pairs, the standard is usually $1 per pip for 0.01 lots
For other instruments, consult your broker's specifications
The indicator works best when you place your stop loss at a logical market level (support/resistance, swing high/low) rather than a fixed percentage
Final Thoughts
This Position Size Calculator helps remove emotion from your trading by objectively calculating your position size based on your predefined risk parameters. It ensures that you maintain consistent risk across all your trades, regardless of the stop loss distance, which is a key component of successful risk management.
Remember: The most important goal in trading is capital preservation. This tool helps you ensure that each trade risks only what you've decided is acceptable for your trading strategy.
Avg Session & Daily Volatility (Pips) - Forex/CFDS🔍 Overview
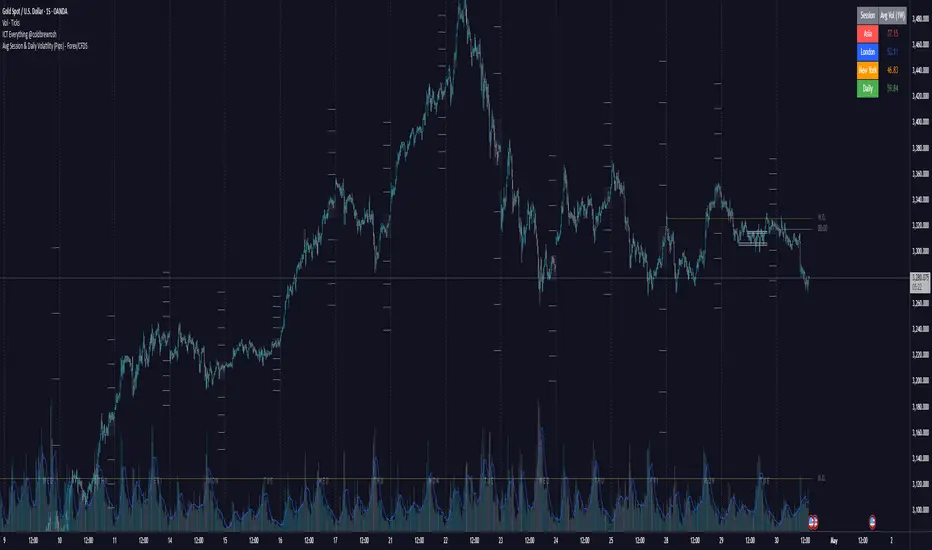
The Avg Session & Daily Volatility (Pips) indicator measures the average High–Low range (volatility) of three major Forex sessions—Asia, London, New York—and the entire trading day, then displays the results in a compact overlay table.
⚙️ Key Features
Session Windows
Asia: Default 23:00 – 07:00 server time
London: 07:00 – 16:00
New York: 13:00 – 22:00
Daily Range
– Tracks the full High–Low from midnight to midnight.
Flexible Lookback
– Choose 1W / 2W / 4W / 8W (≈ 5 / 10 / 20 / 40 trading days)
Pip Conversion
Forex Pairs: 1 pip = 0.0001 → (ticks / mintick) / 10
XAU/USD (Gold): 1 pip = 1 USD → direct price difference
Custom Styling
– Pick your own colors per session & daily
– Table position: Left/Center/Right × Top/Middle/Bottom
📈 Benefits & Use Cases
Optimal Stop-Loss & Take-Profit
Gauge each session’s typical movement to size SL/TP appropriately.
Intraday Performance Check
Compare your real-time trade swings against historical averages.
Risk Management
Align position sizes with average volatility to control risk.
Multi-Asset Support
Works seamlessly for major Forex pairs and Gold (XAU/USD) thanks to smart pip logic.
🚀 How It Works
Session Scanning – Continuously tracks the session’s high and low.
Array Storage – At session close, calculates range in pips and pushes it into a rolling buffer.
Averaging – Computes the arithmetic mean of the last N values (your chosen lookback).
Visualization – Paints the four averages in a neat 2×5 table overlay.
👍 Pro Tips
Check Your Time Zone – Make sure chart timezone matches your broker’s session times.
Tweak Lookback – Use shorter windows (1W) to react quickly; longer (4–8W) to smooth out outliers.
Combine Indicators – Pair with volume or trend tools for deeper insights.
Happy Trading,
Riseofatrader
NQ/MNQ Position Sizing
Despite having my own position sizing calculator in an excel sheet, the manual process of having to identify my next trade, switch tabs/screens, input my values into the sheet, go back into TV, input the trade parameters with appropriate contract sizing, has always really gotten to me. I also found that I would often miss ideal entries due to the delay this caused.
I searched TV for position sizing calculators but almost all the ones I found seemed to be similar: based on some form of manual input for the entry and stop parameters, many of which had way more settings and parameters than I needed, also over complicated things.
I just needed something that would allow me to dynamically set my entry and stop levels directly on the chart, and spit out the appropriate contracts I should be using, either on NQ or MNQ, to maintain my desired level of risk, so I could quickly execute the necessary trade.
So, I coded my own and it's been a huge help to me already, so I thought I may as well publish the script as can't imagine there aren't others out there that also hate the manual data entry process of calculating risk.
Upon first load, the script will ask you to set your Entry and Stop levels, before drawing respective lines for these on the chart, and calculating contract sizing based on your risk settings, which you can update directly. The reset values may be buggy, will be easier to just remove the script and re-apply it to your chart if you ever lose track of the levels you've set.
Hope it's useful.
Live Risk On/Off Sentiment Big Basket🔥 Live Risk On/Off Sentiment Indicator 🔥
This indicator provides a clear and immediate assessment of global market risk sentiment by combining multiple key financial instruments across various asset classes. It helps traders quickly gauge whether the market is currently in a risk-on or risk-off environment.
📈 Included Assets:
- Risk-off indicators:** VIX, Gold, US Dollar Index (DXY), US10Y Treasury Yields, TLT (Treasury Bonds)
- Risk-on indicators:** S&P 500 (SPY), Bitcoin (BTC), High Yield Bonds (HYG), AUD/JPY (Forex), Copper/Gold ratio, and Oil (WTI)
🛠️ How it Works:
The indicator calculates a weighted Z-score for each asset, dynamically capturing its performance relative to recent history. Positive values (green) indicate a risk-on sentiment, while negative values (red) suggest a risk-off sentiment.
🚨 Features:
- Fully customizable asset selection and weighting
- Easy-to-understand visual signals
- Adaptable lookback period for short-term and long-term market analysis
💡 How to Use:
- Identify market phases quickly (bullish or bearish sentiment).
- Enhance your decision-making for entries and exits based on broader market conditions.
- Incorporate into any trading strategy to improve alignment with global risk sentiment.
Harness the power of macro analysis and elevate your trading performance!
Enjoy and trade smart! 📊📈
Riseofatrader

OverUnder Yield Spread🗺️ OverUnder is a structural regime visualizer , engineered to diagnose the shape, tone, and trajectory of the yield curve. Rather than signaling trades directly, it informs traders of the world they’re operating in. Yield curve steepening or flattening, normalizing or inverting — each regime reflects a macro pressure zone that impacts duration demand, liquidity conditions, and systemic risk appetite. OverUnder abstracts that complexity into a color-coded compression map, helping traders orient themselves before making risk decisions. Whether you’re in bonds, currencies, crypto, or equities, the regime matters — and OverUnder makes it visible.
🧠 Core Logic
Built to show the slope and intent of a selected rate pair, the OverUnder Yield Spread defaults to 🇺🇸US10Y-US2Y, but can just as easily compare global sovereign curves or even dislocated monetary systems. This value is continuously monitored and passed through a debounce filter to determine whether the curve is:
• Inverted, or
• Steepening
If the curve is flattening below zero: the world is bracing for contraction. Policy lags. Risk appetite deteriorates. Duration gets bid, but only as protection. Stocks and speculative assets suffer, regardless of positioning.
📍 Curve Regimes in Bull and Bear Contexts
• Flattening occurs when the short and long ends compress . In a bull regime, flattening may reflect long-end demand or fading growth expectations. In a bear regime, flattening often precedes or confirms central bank tightening.
• Steepening indicates expanding spread . In a bull context, this may signal healthy risk appetite or early expansion. In a bear or crisis context, it may reflect aggressive front-end cuts and dislocation between short- and long-term expectations.
• If the curve is steepening above zero: the world is rotating into early expansion. Risk assets behave constructively. Bond traders position for normalization. Equities and crypto begin trending higher on rising forward expectations.
🖐️ Dynamically Colored Spread Line Reflects 1 of 4 Regime States
• 🟢 Normal / Steepening — early expansion or reflation
• 🔵 Normal / Flattening — late-cycle or neutral slowdown
• 🟠 Inverted / Steepening — policy reversal or soft landing attempt
• 🔴 Inverted / Flattening — hard contraction, credit stress, policy lag
🍋 The Lemon Label
At every bar, an anchored label floats directly on the spread line. It displays the active regime (in plain English) and the precise spread in percent (or basis points, depending on resolution). Colored lemon yellow, neither green nor red, the label is always legible — a design choice to de-emphasize bias and center the data .
🎨 Fill Zones
These bands offer spatial, persistent views of macro compression or inversion depth.
• Blue fill appears above the zero line in normal (non-inverted) conditions
• Red fill appears below the zero line during inversion
🧪 Sample Reading: 1W chart of TLT
OverUnder reveals a multi-year arc of structural inversion and regime transition. From mid-2021 through late 2023, the spread remains decisively inverted, signaling persistent flattening and credit stress as bond prices trended sharply lower. This prolonged inversion aligns with a high-volatility phase in TLT, marked by lower highs and an accelerating downtrend, confirming policy lag and macro tightening conditions.
As of early 2025, the spread has crossed back above the zero baseline into a “Normal / Steepening” regime (annotated at +0.56%), suggesting a macro inflection point. Price action remains subdued, but the shift in yield structure may foreshadow a change in trend context — particularly if follow-through in steepening persists.
🎭 Different Traders Respond Differently:
• Bond traders monitor slope change to anticipate policy pivots or recession signals.
• Equity traders use regime shifts to time rotations, from growth into defense, or from contraction into reflation.
• Currency traders interpret curve steepening as yield compression or divergence depending on region.
• Crypto traders treat inversion as a liquidity vacuum — and steepening as an early-phase risk unlock.
🛡️ Can It Compare Different Bond Markets?
Yes — with caveats. The indicator can be used to compare distinct sovereign yield instruments, for example:
• 🇫🇷FR10Y vs 🇩🇪DE10Y - France vs Germany
• 🇯🇵JP10Y vs 🇺🇸US10Y - BoJ vs Fed policy curves
However:
🙈 This no longer visualizes the domestic yield curve, but rather the differential between rate expectations across regions
🙉 The interpretation of “inversion” changes — it reflects spread compression across nations , not within a domestic yield structure
🙊 Color regimes should then be viewed as relative rate positioning , not absolute curve health
🙋🏻 Example: OverUnder compares French vs German 10Y yields
1. 🇫🇷 Change the long-duration ticker to FR10Y
2. 🇩🇪 Set the short-duration ticker to DE10Y
3. 🤔 Interpret the result as: “How much higher is France’s long-term borrowing cost vs Germany’s?”
You’ll see steepening when the spread rises (France decoupling), flattening when the spread compresses (convergence), and inversions when Germany yields rise above France’s — historically rare and meaningful.
🧐 Suggested Use
OverUnder is not a signal engine — it’s a context map. Its value comes from situating any trade idea within the prevailing yield regime. Use it before entries, not after them.
• On the 1W timeframe, OverUnder excels as a macro overlay. Yield regime shifts unfold over quarters, not days. Weekly structure smooths out rate volatility and reveals the true curvature of policy response and liquidity pressure. Use this view to orient your portfolio, define directional bias, or confirm long-duration trend turns in assets like TLT, SPX, or BTC.
• On the 1D timeframe, the indicator becomes tactically useful — especially when aligning breakout setups or trend continuations with steepening or flattening transitions. Daily views can also identify early-stage regime cracks that may not yet be visible on the weekly.
• Avoid sub-daily use unless you’re anchoring a thesis already built on higher timeframe structure. The yield curve is a macro construct — it doesn’t oscillate cleanly at intraday speeds. Shorter views may offer clarity during event-driven spikes (like FOMC reactions), but they do not replace weekly context.
Ultimately, OverUnder helps you decide: What kind of world am I trading in? Use it to confirm macro context, avoid fighting the curve, and lean into trades aligned with the broader pressure regime.

RiskCalc FX & GoldRiskCalc FX & Gold is a multi-market position sizing tool designed to help you manage risk quickly and accurately. With this script, simply enter your account capital, the percentage of risk you wish to take, and your stop in ticks. Depending on the selected market—Forex or XAUUSD—the script automatically adjusts its calculations:
Forex: Assumes 1 lot equals 100,000 units.
XAUUSD: Assumes 1 lot equals 100 ounces.
The script calculates your risk in dollars and, using a fixed value of 1 USD per tick per lot, determines the ideal position size in both lots and total contracts. Results are displayed in a clear, centralized table at the top of the chart for real-time decision-making.
Perfect for traders operating across multiple markets who need an automated and consistent approach to risk management.

Backtesting Stats (Altrady)Track and analyze your backtesting results directly on your chart.
This indicator simplifies manual backtesting by summarizing your trades in a clear, structured table. Enter your R-values (one per line) in the text area, and instantly see:
✅ Trade list – All entries displayed with color-coded wins/losses.
✅ Key stats – Total trades, win rate, and RR sum in the top row.
✅ Quick insights – Spot trends, refine your strategy, and track performance without spreadsheets.
How to Use
1️⃣ Open settings and enter R-values, one per line (e.g., 2.5, -1, 3.2) along with short comments (bad entry, counter trend, etc)
2️⃣ View the table in the top-right corner of your chart.
3️⃣ Analyze your results, adjust your strategy, and improve consistency.
Perfect for manual backtesters who want a fast, no-spreadsheet solution. 🚀

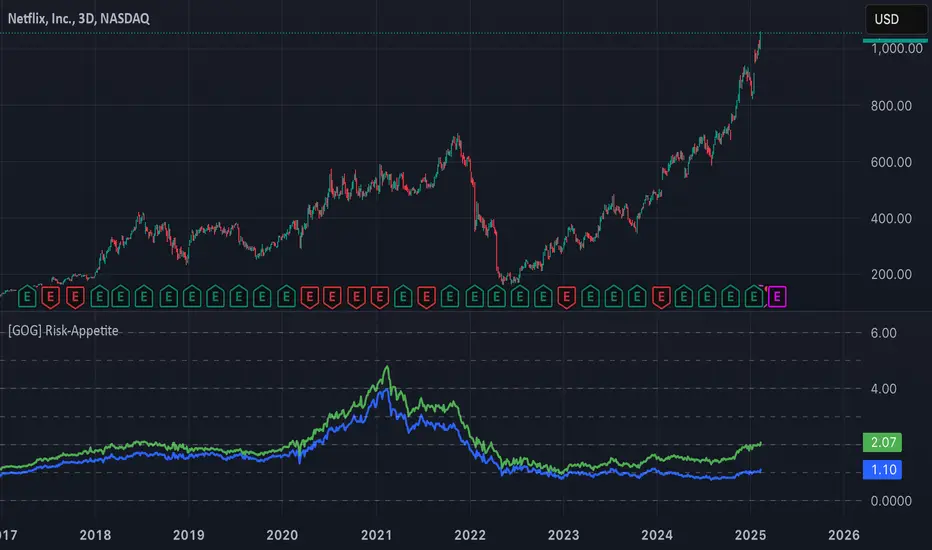
[GOG] Risk-Appetite IndicatorOverall tradfi risk appetite indicator. Plotting ARKK/SPX and ARKW/SPX. Look for divergences to your risk assets to look for entries and exits. Also generally useful to compare to past peaks to spot euphoria.
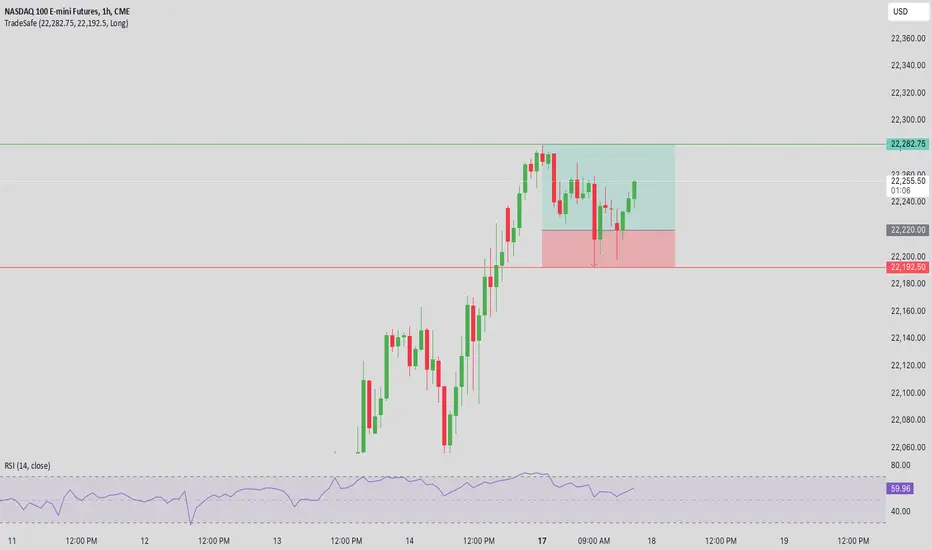
Trade SafeTrade Safe: The Ultimate Discipline Tool for Traders
Are you tired of overtrading, revenge trading, or letting emotions ruin your trading plan? Trade Safe is here to transform your trading psychology and help you achieve consistent profitability. Unlike traditional indicators that focus solely on market analysis, Trade Safe addresses the number one reason traders fail: lack of discipline.
With its innovative features, Trade Safe enforces strict trading rules, prevents emotional decision-making, and helps you stick to your plan—no matter how volatile the markets get. If you're serious about becoming a disciplined and profitable trader, this is the tool you've been waiting for.
Enforces Trading Discipline:
Trade Safe ensures you stick to your daily trading plan by visually blocking your charts after a predetermined number of trades or a stop-loss, Take profit event.
No more overtrading or deviating from your strategy—Trade Safe keeps you in check.
Eliminates Emotional Trading:
The screen block feature prevents you from seeing the candles after a loss, helping you avoid the emotional spiral of "tilt" and revenge trading.
This unique approach focuses on the psychological side of trading, which is often overlooked by other tools.
Simple and Intuitive Interface:
Easily set your stop-loss and take-profit level with the red line marker for stop-loss and green for take-profit and choose between long or short positions with just a few clicks.
Trade Safe is designed to be user-friendly, so you can focus on trading without distractions.
Customizable for All Trading Styles:
Whether you're a scalper, swing trader, or long-term investor, Trade Safe can be tailored to fit your strategy.
Set your stop-loss and take-profit, and let Trade Safe handle the rest.
Prevents Revenge Trading:
By locking your screen after a stop-loss, Trade Safe eliminates the temptation to "make back" losses through impulsive trades.
This helps you break the cycle of emotional trading and stay focused on your long-term goals.
Builds Healthy Trading Habits:
Trade Safe encourages you to walk away after a loss, reinforcing the importance of patience and discipline.
MTF Signal XpertMTF Signal Xpert – Detailed Description
Overview:
MTF Signal Xpert is a proprietary, open‑source trading signal indicator that fuses multiple technical analysis methods into one cohesive strategy. Developed after rigorous backtesting and extensive research, this advanced tool is designed to deliver clear BUY and SELL signals by analyzing trend, momentum, and volatility across various timeframes. Its integrated approach not only enhances signal reliability but also incorporates dynamic risk management, helping traders protect their capital while navigating complex market conditions.
Detailed Explanation of How It Works:
Trend Detection via Moving Averages
Dual Moving Averages:
MTF Signal Xpert computes two moving averages—a fast MA and a slow MA—with the flexibility to choose from Simple (SMA), Exponential (EMA), or Hull (HMA) methods. This dual-MA system helps identify the prevailing market trend by contrasting short-term momentum with longer-term trends.
Crossover Logic:
A BUY signal is initiated when the fast MA crosses above the slow MA, coupled with the condition that the current price is above the lower Bollinger Band. This suggests that the market may be emerging from a lower price region. Conversely, a SELL signal is generated when the fast MA crosses below the slow MA and the price is below the upper Bollinger Band, indicating potential bearish pressure.
Recent Crossover Confirmation:
To ensure that signals reflect current market dynamics, the script tracks the number of bars since the moving average crossover event. Only crossovers that occur within a user-defined “candle confirmation” period are considered, which helps filter out outdated signals and improves overall signal accuracy.
Volatility and Price Extremes with Bollinger Bands
Calculation of Bands:
Bollinger Bands are calculated using a 20‑period simple moving average as the central basis, with the upper and lower bands derived from a standard deviation multiplier. This creates dynamic boundaries that adjust according to recent market volatility.
Signal Reinforcement:
For BUY signals, the condition that the price is above the lower Bollinger Band suggests an undervalued market condition, while for SELL signals, the price falling below the upper Bollinger Band reinforces the bearish bias. This volatility context adds depth to the moving average crossover signals.
Momentum Confirmation Using Multiple Oscillators
RSI (Relative Strength Index):
The RSI is computed over 14 periods to determine if the market is in an overbought or oversold state. Only readings within an optimal range (defined by user inputs) validate the signal, ensuring that entries are made during balanced conditions.
MACD (Moving Average Convergence Divergence):
The MACD line is compared with its signal line to assess momentum. A bullish scenario is confirmed when the MACD line is above the signal line, while a bearish scenario is indicated when it is below, thus adding another layer of confirmation.
Awesome Oscillator (AO):
The AO measures the difference between short-term and long-term simple moving averages of the median price. Positive AO values support BUY signals, while negative values back SELL signals, offering additional momentum insight.
ADX (Average Directional Index):
The ADX quantifies trend strength. MTF Signal Xpert only considers signals when the ADX value exceeds a specified threshold, ensuring that trades are taken in strongly trending markets.
Optional Stochastic Oscillator:
An optional stochastic oscillator filter can be enabled to further refine signals. It checks for overbought conditions (supporting SELL signals) or oversold conditions (supporting BUY signals), thus reducing ambiguity.
Multi-Timeframe Verification
Higher Timeframe Filter:
To align short-term signals with broader market trends, the script calculates an EMA on a higher timeframe as specified by the user. This multi-timeframe approach helps ensure that signals on the primary chart are consistent with the overall trend, thereby reducing false signals.
Dynamic Risk Management with ATR
ATR-Based Calculations:
The Average True Range (ATR) is used to measure current market volatility. This value is multiplied by a user-defined factor to dynamically determine stop loss (SL) and take profit (TP) levels, adapting to changing market conditions.
Visual SL/TP Markers:
The calculated SL and TP levels are plotted on the chart as distinct colored dots, enabling traders to quickly identify recommended exit points.
Optional Trailing Stop:
An optional trailing stop feature is available, which adjusts the stop loss as the trade moves favorably, helping to lock in profits while protecting against sudden reversals.
Risk/Reward Ratio Calculation:
MTF Signal Xpert computes a risk/reward ratio based on the dynamic SL and TP levels. This quantitative measure allows traders to assess whether the potential reward justifies the risk associated with a trade.
Condition Weighting and Signal Scoring
Binary Condition Checks:
Each technical condition—ranging from moving average crossovers, Bollinger Band positioning, and RSI range to MACD, AO, ADX, and volume filters—is assigned a binary score (1 if met, 0 if not).
Cumulative Scoring:
These individual scores are summed to generate cumulative bullish and bearish scores, quantifying the overall strength of the signal and providing traders with an objective measure of its viability.
Detailed Signal Explanation:
A comprehensive explanation string is generated, outlining which conditions contributed to the current BUY or SELL signal. This explanation is displayed on an on‑chart dashboard, offering transparency and clarity into the signal generation process.
On-Chart Visualizations and Debug Information
Chart Elements:
The indicator plots all key components—moving averages, Bollinger Bands, SL and TP markers—directly on the chart, providing a clear visual framework for understanding market conditions.
Combined Dashboard:
A dedicated dashboard displays key metrics such as RSI, ADX, and the bullish/bearish scores, alongside a detailed explanation of the current signal. This consolidated view allows traders to quickly grasp the underlying logic.
Debug Table (Optional):
For advanced users, an optional debug table is available. This table breaks down each individual condition, indicating which criteria were met or not met, thus aiding in further analysis and strategy refinement.
Mashup Justification and Originality
MTF Signal Xpert is more than just an aggregation of existing indicators—it is an original synthesis designed to address real-world trading complexities. Here’s how its components work together:
Integrated Trend, Volatility, and Momentum Analysis:
By combining moving averages, Bollinger Bands, and multiple oscillators (RSI, MACD, AO, ADX, and an optional stochastic), the indicator captures diverse market dynamics. Each component reinforces the others, reducing noise and filtering out false signals.
Multi-Timeframe Analysis:
The inclusion of a higher timeframe filter aligns short-term signals with longer-term trends, enhancing overall reliability and reducing the potential for contradictory signals.
Adaptive Risk Management:
Dynamic stop loss and take profit levels, determined using ATR, ensure that the risk management strategy adapts to current market conditions. The optional trailing stop further refines this approach, protecting profits as the market evolves.
Quantitative Signal Scoring:
The condition weighting system provides an objective measure of signal strength, giving traders clear insight into how each technical component contributes to the final decision.
How to Use MTF Signal Xpert:
Input Customization:
Adjust the moving average type and period settings, ATR multipliers, and oscillator thresholds to align with your trading style and the specific market conditions.
Enable or disable the optional stochastic oscillator and trailing stop based on your preference.
Interpreting the Signals:
When a BUY or SELL signal appears, refer to the on‑chart dashboard, which displays key metrics (e.g., RSI, ADX, bullish/bearish scores) along with a detailed breakdown of the conditions that triggered the signal.
Review the SL and TP markers on the chart to understand the associated risk/reward setup.
Risk Management:
Use the dynamically calculated stop loss and take profit levels as guidelines for setting your exit points.
Evaluate the provided risk/reward ratio to ensure that the potential reward justifies the risk before entering a trade.
Debugging and Verification:
Advanced users can enable the debug table to see a condition-by-condition breakdown of the signal generation process, helping refine the strategy and deepen understanding of market dynamics.
Disclaimer:
MTF Signal Xpert is intended for educational and analytical purposes only. Although it is based on robust technical analysis methods and has undergone extensive backtesting, past performance is not indicative of future results. Traders should employ proper risk management and adjust the settings to suit their financial circumstances and risk tolerance.
MTF Signal Xpert represents a comprehensive, original approach to trading signal generation. By blending trend detection, volatility assessment, momentum analysis, multi-timeframe alignment, and adaptive risk management into one integrated system, it provides traders with actionable signals and the transparency needed to understand the logic behind them.

Relative Risk MetricOVERVIEW
The Relative Risk Metric is designed to provide a relative measure of an asset's price, within a specified range, over a log scale.
PURPOSE
Relative Position Assessment: Visualizes where the current price stands within a user-defined range, adjusted for log scale.
Logarithmic Transformation: Utilizes the natural log to account for a log scale of prices, offering a more accurate representation of relative positions.
Calculation: The indicator calculates a normalized value via the function Relative Price = / log(UpperBound) − log(LowerBound) . The result is a value between 0 and 1, where 0 corresponds to the lower bound and 1 corresponds to the upper bound on a log scale.
VISUALIZATION
The indicator plots three series:
Risk Metric - a plot of the risk metric value that’s computed from an asset's relative price so that it lies within a logarithmic range between 0.0 & 1.0.
Smoothed Risk Metric - a plot of the risk metric that’s been smoothed.
Entry/Exit - a scatter plot for identified entry and exit. Values are expressed as percent and are coded as red being exit and green being entity. E.g., a red dot at 0.02 implies exit 2% of the held asset. A green dot at 0.01 implies use 1% of a designated capital reserve.
USAGE
Risk Metric
The risk metric transformation function has several parameters. These control aspects such as decay, sensitivity, bounds and time offset.
Decay - Acts as an exponent multiplier and controls how quickly dynamic bounds change as a function of the bar_index.
Time Offset - provides a centering effect of the exponential transformation relative to the current bar_index.
Sensitivity - controls how sensitive to time the dynamic bound adjustments should be.
Baseline control - Serves as an additive offset for dynamic bounds computation which ensures that bounds never become too small or negative.
UpperBound - provides headroom to accomodate growth an assets price from the baseline. For example, an upperbound of 3.5 accommodates a 3.5x growth from the baseline value (e.g., $100 -> $350).
LowerBound - provides log scale compression such that the overall metric provides meaningful insights for prices well below the average whilst avoiding extreme scaling. A lowerbound of 0.25 corresponds to a price that is approx one quarter of a normalised baseline in a log context.
Weighted Entry/Exit
This feature provides a weighted system for identifying DCA entry and exit. This weighting mechanism adjusts the metric's interpretation to highlight conditions based on dynamic thresholds and user-defined parameters to identify high-probability zones for entry/exit actions and provide risk-adjusted insights.
Weighting Parameters
The weighting function supports fine-tuning of the computed weighted entry/exit values
Base: determines the foundational multiplier for weighting the entry/exit value. A higher base amplifies the weighting effect, making the weighted values more pronounced. It acts as a scaling factor to control the overall magnitude of the weighting.
Exponent: adjusts the curve of the weighting function. Higher exponent values increase sensitivity, emphasizing differences between risk metric values near the entry or exit thresholds. This creates a steeper gradient for the computed entry/exit value making it more responsive to subtle shifts in risk levels.
Cut Off: specifies the maximum percentage (expressed as a fraction of 1.0) that the weighted entry/exit value can reach. This cap ensures the metric remains within a meaningful range and avoids skewing
Exit condition: Defines a threshold for exit. When the risk metric is below the exit threshold (but above the entry threshold) then entry/exit is neutral.
Entry condition: Defines a threshold for entry. When the risk metric is above the entry threshold (but below the exit threshold) then entry/exit is neutral.
Weighting Behaviour
For entry conditions - value is more heavily weighted as the metric approaches the entry threshold, emphasizing lower risk levels.
For exit conditions - value is more heavily weighted as the metric nears the exit threshold, emphasizing increased risk levels.
USE-CASES
Identifying potential overbought or oversold conditions within the specified logarithmic range.
Assisting in assessing how the current price compares to historical price levels on a logarithmic scale.
Guiding decision-making processes by providing insights into the relative positioning of prices within a log context
CONSIDERATIONS
Validation: It's recommended that backtesting over historical data be done before acting on any identified entry/exit values.
User Discretion: This indicator focus on price risk. Consider other risk factors and general market conditions as well.

Risk Investor - Risk based DCAA Dollar Cost Averaging (DCA) tool that manages investments based on customizable risk levels. Features include:
Risk-based investment sizing
Vault system for deposit management
Daily/Weekly/Monthly investment options
Configurable profit-taking rules
Visual buy/sell indicators
The strategy uses buy multipliers to control position sizing. At lower risk levels (e.g., 0.1), higher multipliers (4x) enable larger purchases. As risk increases (e.g., 0.7), reduced multipliers (1x) limit market exposure, creating a dynamic DCA strategy that adapts to market conditions.
The sell mechanism activates at higher risk levels with configurable percentage-based exits.
For example, you can set 30% sell at risk level 0.8 and 70% at 0.9, creating a graduated exit strategy.
Profits automatically flow back into the vault system for reinvestment. If the vault is already topped up, profits are being taken out of the system.
Note: Risk Investor requires an external risk model.
Compatible options include:
Bitcoin Top Indicator by Da_Prof ()
Benjamin Cowen's Simplified Risk Metric by jacdr ()
Setup: Connect your chosen risk model via the risk indicator field and configure the minimum/maximum risk values. For example, when using Bitcoin Top Indicator by Da_Prof, set the Max. Risk Value to 12.

Lot Size & Risk Calculator (All Pairs)this indicator is designed to simplify and optimize risk management. It automatically calculates the ideal lot size based on your account balance, risk percentage, and defined entry and exit levels. Additionally, it includes visual tools to represent stop-loss (SL) and take-profit (TP) levels, helping you trade with precision and consistency.
WHAT IS THIS INDICATOR FOR?
This indicator is essential for traders who want to:
Maintain consistent risk in their trades.
Quickly calculate lot sizes for Forex, XAUUSD, BTCUSD, and US100.
Visualize key levels (Entry, SL, and TP) on the chart.
Monitor potential losses and gains in real time.
COMPATIBLE ASSETS
The Lot Size Calculator works with the following assets:
Forex: Standard currency pairs.
XAUUSD: Gold versus the US dollar.
BTCUSD: Bitcoin versus the US dollar.
US100: Nasdaq 100 index.
Calculations adjust automatically based on the selected asset.
TAKE-PROFIT (TP) LEVELS
The indicator allows you to define up to three take-profit levels:
TP1
TP2
TP3
.
Each level is configurable based on your exit strategy.
DASHBOARD
The dashboard is a visual tool that consolidates key information about your trade:
Account balance: Total amount available in your account.
Lot size: Calculated based on your risk and parameters.
Potential loss (SL): Amount you could lose if the price hits your stop-loss.
Potential gain (TP): Expected profit if the take-profit level is reached.
SETTINGS
The indicator offers multiple configurable options to adapt to your trading style:
Levels
Entry: Initial trade price.
Stop-Loss (SL): Maximum allowed loss level.
Take-Profit (TP): Up to three configurable levels.
Risk Management
Account balance ($): Enter your total available balance.
Risk percentage: Define how much you're willing to risk per trade
.
Visual Options
Visualization style: Choose between simple lines or visual fills.
Colors: Customize the colors of lines and labels.
Dashboard Settings
Statistics: Enable or disable key data display.
Size and position: Adjust the dashboard's size and location on the chart.
HOW TO CHANGE AN ENTRY?
Open the indicator settings in TradingView and entering the new data manually
Removing and re-adding the indicator to the chart

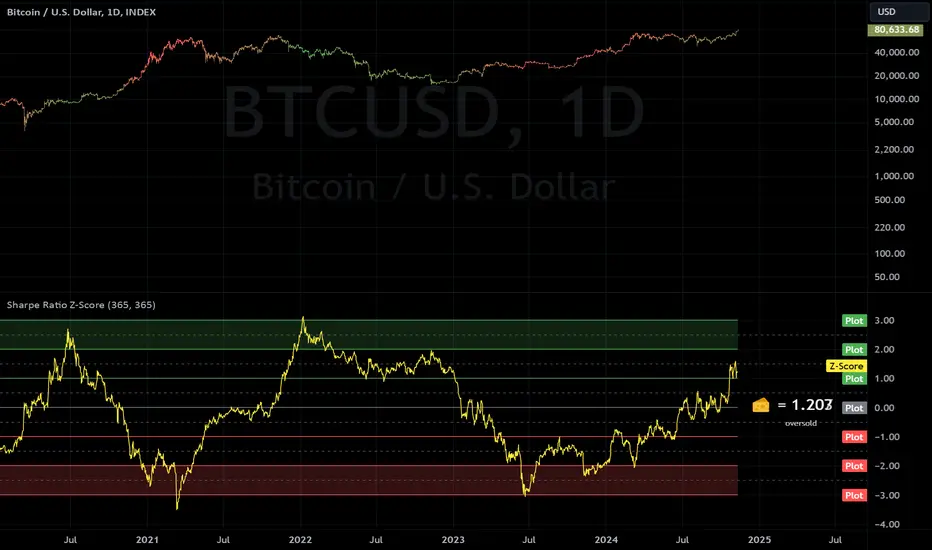
Sharpe Ratio Z-ScoreThis indicator calculates the Sharpe Ratio and its Z-Score , which are used to evaluate the risk-adjusted return of an asset over a given period. The Sharpe Ratio is computed using the average return and the standard deviation of returns, while the Z-Score standardizes this ratio to assess how far the current Sharpe Ratio deviates from its historical average.
The Sharpe Ratio is a measure of how much return an investment has generated relative to the risk it has taken. In the context of this script, the risk-free rate is assumed to be 0, but in real applications, it would typically be the return on a safe investment, like a Treasury bond. A higher Sharpe Ratio indicates that the investment's returns are higher compared to its risk, making it a more favorable investment. Conversely, a lower Sharpe Ratio suggests that the investment may not be worth the risk.
Calculation:
Daily Returns Calculation: The script calculates the daily return of the asset. This measures the percentage change in the asset’s closing price from one period to the next.
Sharpe Ratio Calculation: The Sharpe Ratio is calculated by taking the average daily return and dividing it by the standard deviation of the returns, then multiplying by the square root of the period length.
Usage:
Traders and Investors can use the Sharpe Ratio to evaluate how well the asset is compensating for risk. A high Sharpe Ratio indicates a high return per unit of risk, whereas a low or negative Sharpe Ratio suggests poor risk-adjusted returns. In overbought times, an asset would have high/positive returns per unit of risk. In oversold times, an asset would have low/negative returns per unit of risk.
The Z-Score provides a way to compare the current Sharpe Ratio to its historical distribution, offering a more standardized view of how extreme or typical the current ratio is.
Positive Z-score: Indicates that the asset's return is significantly lower than its risk, suggesting potential oversold conditions.
Negative Z-score: Indicates that the asset's return is significantly higher than its risk, suggesting potential overbought conditions.
Red Zone (-3 to -2): Strong overbought conditions.
Green Zone (2 to 3): Strong oversold conditions.
Sharpe Ratio Limitations:
While the Sharpe Ratio is widely used to evaluate risk-adjusted returns, it has its limitations.
Fat Tails: It assumes that returns are normally distributed and does not account for extreme events or "fat tails" in the return distribution. This can be problematic for assets like cryptocurrencies, which may experience large, sudden price swings that skew the return distribution.
Single Risk Factor: The Sharpe Ratio only considers standard deviation (total volatility) as a measure of risk, ignoring other types of risks like skewness or kurtosis, which may also impact an asset’s performance.
Time Frame Sensitivity: The accuracy of the Sharpe Ratio and its Z-Score is heavily influenced by the time frame chosen for the calculation. A longer period may smooth out short-term fluctuations, while a shorter period might be more sensitive to recent volatility.
Overbought and Oversold Zones: The script marks overbought and oversold conditions based on the Z-Score, but this is not a guarantee of market reversal. It’s important to combine this tool with other technical indicators and fundamental analysis for a more comprehensive market evaluation.
Volatility: The Sharpe Ratio and Z-Score depend on the volatility (standard deviation) of the asset’s returns. For highly volatile assets, such as cryptocurrencies, the Sharpe Ratio may not fully capture the true risk or may be misleading if the volatility is transient.
Doesn't Account for Downside Risk: The Sharpe Ratio treats upside and downside volatility equally, which may not reflect how investors perceive risk. Some investors may be more concerned with downside risk, which the Sharpe Ratio does not distinguish from upside fluctuations.
Important Considerations:
The Sharpe Ratio should not be used in isolation. While it provides valuable insights into risk-adjusted returns, it is important to combine it with other performance and risk indicators to form a more comprehensive market evaluation. Relying solely on the Sharpe Ratio may lead to misleading conclusions, particularly in volatile or non-normally distributed markets.
When integrated into a broader investment strategy, the Sharpe Ratio can help traders and investors better assess the risk-return profile of an asset, identifying periods of potential overperformance or underperformance. However, it should be used alongside other tools to ensure more informed decision-making, especially in highly fluctuating markets.
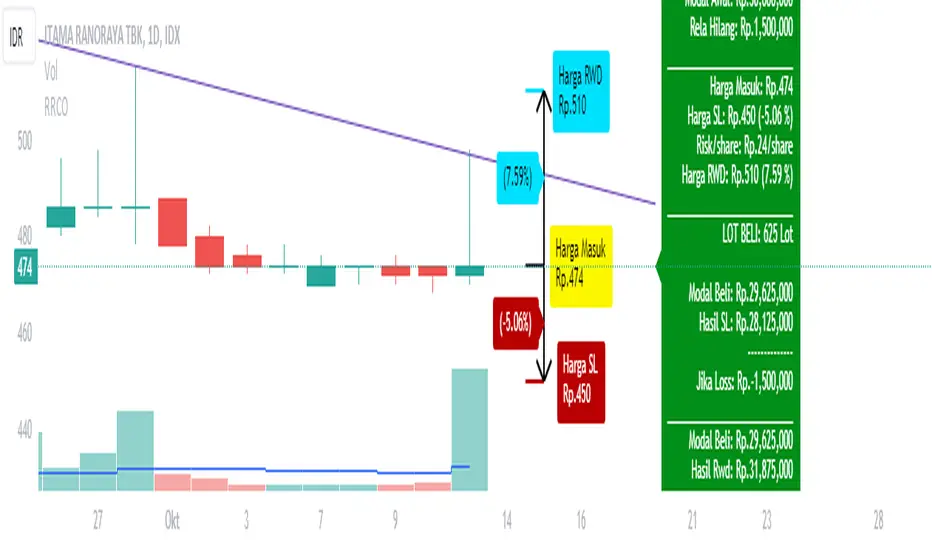
Risk Reward CalculatorPlanning your trading is an important step that you must do before buying the stock.
Risk and Reward Calculator is an important tool for the trader.
With this calculator, you only need to put the capital for one trade and it will automaticaly put the plan for you. But if you want to enter your plan for buy and sell, you just need to check the button and enter the number. the risk and reward calculator will suggest position size based on the information.
The Steps to use Risk Reward Calculator
1. enter how many percentage you can accept if your analysis is wrong.
2. enter how much money you want to trade
3. it will automaticaly calculate the plan for you
4. you can change the reward
5. but if you want to enter your own number, you can check the box. After that enter the number you want for your new plan.
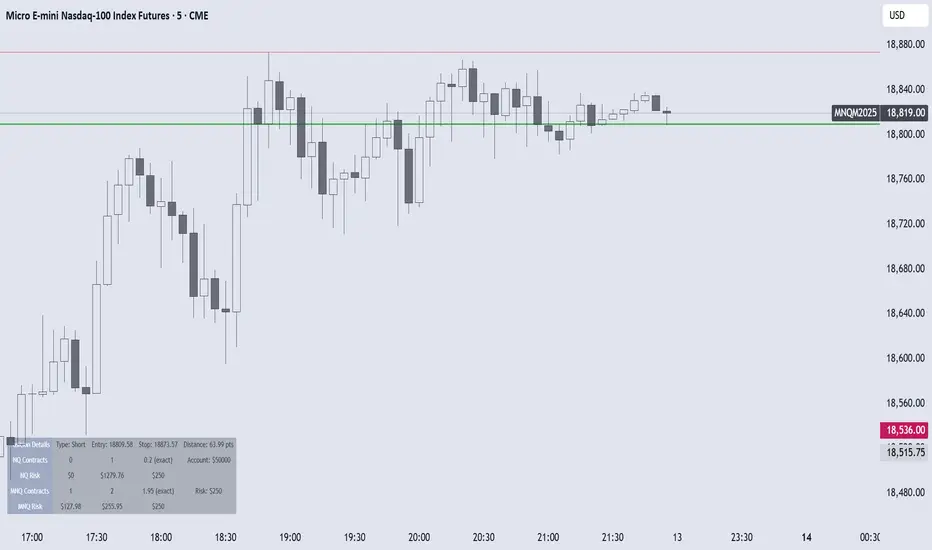
Futures Risk CalculatorFutures Risk Calculator Script - Description
The Futures Risk Calculator (FRC) is a comprehensive tool designed to help traders effectively manage risk when trading futures contracts. This script allows users to calculate risk/reward ratios directly on the chart by specifying their entry price and stop loss. It's an ideal tool for futures traders who want to quantify their potential losses and gains with precision, based on their trading account size and the number of contracts they trade.
What the Script Does:
1. Risk and Reward Calculation:
The script calculates your total risk in dollars and as a percentage of your account size based on the entry and stop-loss prices you input.
It also calculates two key levels where potential reward (Take Profit 1 and Take Profit 2) can be expected, helping you assess the reward-to-risk ratio for any trade.
2. Customizable Settings:
You can specify the size of your trading account (available $ for Futures trading) and the number of futures contracts you're trading. This allows for tailored risk management that reflects your exact trading conditions.
3. Live Chart Integration:
You add the script to your chart after opening a futures chart in TradingView. Simply click on the chart to set your Entry Price and Stop Loss. The script will instantly calculate and display the risk and reward levels based on the points you set.
Adjusting the entry and stop-loss points later is just as easy: drag and drop the levels directly on the chart, and the risk and reward calculations update automatically.
4. Futures Contract Support:
The script is pre-configured with a list of popular futures symbols (like ES, NQ, CL, GC, and more). If your preferred futures contract isn’t in the list, you can easily add it by modifying the script.
The script uses each symbol’s point value to ensure precise risk calculations, providing you with an accurate dollar risk and potential reward based on the specific contract you're trading.
How to Use the Script:
1. Apply the Script to a Futures Chart:
Open a futures contract chart in TradingView.
Add the Futures Risk Calculator (FRC) script as an indicator.
2. Set Entry and Stop Loss:
Upon applying the script, it will prompt you to select your entry price by clicking the chart where you plan to enter the market.
Next, click on the chart to set your stop-loss level.
The script will then calculate your total risk in dollars and as a percentage of your account size.
3. View Risk, Reward, and (Take Profit):
You can immediately see visual lines representing your entry, stop loss, and the calculated reward-to-risk ratio levels (Take Profit 1 and Take Profit 2).
If you want to adjust the entry or stop loss after plotting them, simply move the points on
the chart, and the script will recalculate everything for you.
4. Configure Account and Contracts:
In the script settings, you can enter your account size and adjust the number of contracts you are trading. These inputs allow the script to calculate risk in monetary terms and as a percentage, making it easier to manage your risk effectively.
5. Understand the Information in the Table:
Once you apply the script, a table will appear in the top-right corner of your chart, providing you with key information about your futures contract and the trade setup. Here's what each field represents:
Account Size: Displays your total account value, which you can set in the script's settings.
Future: Shows the selected futures symbol, along with key details such as its tick size and point value. This gives you a clear understanding of how much one point or tick is worth in dollar terms.
Entry Price: The exact price at which you plan to enter the trade, displayed in green.
Stop Loss Price: The price level where you plan to exit the trade if the market moves against you, shown in red.
Contracts: The number of futures contracts you are trading, which you can adjust in the settings.
Risk: Highlighted in orange, this field shows your total risk in dollars, as well as the percentage risk based on your account size. This is a crucial value to help you stay within your risk tolerance and manage your trades effectively.

Position Sizer by VolatilityDescription :
The **Position Sizer by Volatility (PSV)** is an indicator that helps traders determine what percentage of their deposit a position will occupy, taking into account the current market volatility. PSV calculates the range of price movements over recent periods and shows how large this movement is compared to historical data. The lower the value, the lower the volatility, and the smaller the stop-loss required relative to the current price.
Explanation of PSV Parameters:
- ` len ` (Period Length):** This parameter sets the number of candles (bars) on the chart that will be used to calculate volatility. For example, if `len` is set to 250, the indicator will analyze price movements over the last 250 bars. The larger the value, the longer the period used for volatility assessment.
- ` percent ` (Percentile):** This parameter determines how strong price fluctuations you want to account for. For instance, if you set `percent` to 95, the indicator will focus on the 5% of instances where the price range was the largest over the specified period. This helps evaluate volatility during periods of sharp price movements, which may require a larger stop-loss. A higher percentile accounts for rarer but stronger movements, and vice versa.
Market Structure Based Stop LossMarket Structure Based Dynamic Stop Loss
Introduction
The Market Structure Based Stop Loss indicator is a strategic tool for traders designed to be useful in both rigorous backtesting and live testing, by providing an objective, “guess-free” stop loss level. This indicator dynamically plots suggested stop loss levels based on market structure, and the concepts of “interim lows/highs.”
It provides a robust framework for managing risk in both long and short positions. By leveraging historical price movements and real time market dynamics, this indicator helps traders identify quantitatively consistent risk levels while optimizing trade returns.
Legend
This indicator utilizes various inputs to customize its functionality, including "Stop Loss Sensitivity" and "Wick Depth," which dictate how closely the stop loss levels hug the price's highs and lows. The stop loss levels are plotted as lines on the trading chart, providing clear visual cues for position management. As seen in the chart below, this indicator dynamically plots stop loss levels for both long and short positions at every point in time.
A “Stop Loss Table” is also included, in order to enhance precision trading and increase backtesting accuracy. It is customizable in both size and positioning.
Case Study
Methodology
The methodology behind this indicator focuses on the precision placement of stop losses using market structure as a guide. It calculates stop losses by identifying the "lowest close" and the corresponding "lowest low" for long setups, and inversely for short setups. By adjusting the sensitivity settings, traders can tweak the indicator's responsiveness to price changes, ensuring that the stop losses are set with a balance between tight risk control and enough room to avoid premature exits due to market noise. The indicator's ability to adapt to different trading styles and time frames makes it an essential tool for traders aiming for efficiency and effectiveness in their risk management strategies.
An important point to make is the fact that the stop loss levels are always placed within the wicks. This is important to avoid what can be described as a “floating stop loss”. A stop loss placed outside of a wick is susceptible to an outsized degree of slippage. This is because traders always cluster their stop losses at high/low wicks, and a stop loss placed outside of this level will inevitably be caught in a low liquidity cascade or “wash-out.” When price approaches a cluster of stop losses, it is highly probable that you will be stopped out anyway, so it is prudent to attempt to be the trader who gets stopped out first in order to avoid high slippage, and losses above what you originally intended.
// For long positions: stop-loss is slightly inside the lowest wick
float dynamic_SL_Long = lowestClose - (lowestClose - lowestLow) * (1 - WickDepth)
// For short positions: stop-loss is slightly inside the highest wick
float dynamic_SL_Short = highestClose + (highestHigh - highestClose) * (1 - WickDepth)
The percentage depth of the wick in which the stop loss is placed is customisable with the “Wick Depth” variable, in order to customize stop loss strategies around the liquidity of the market a trader is executing their orders in.

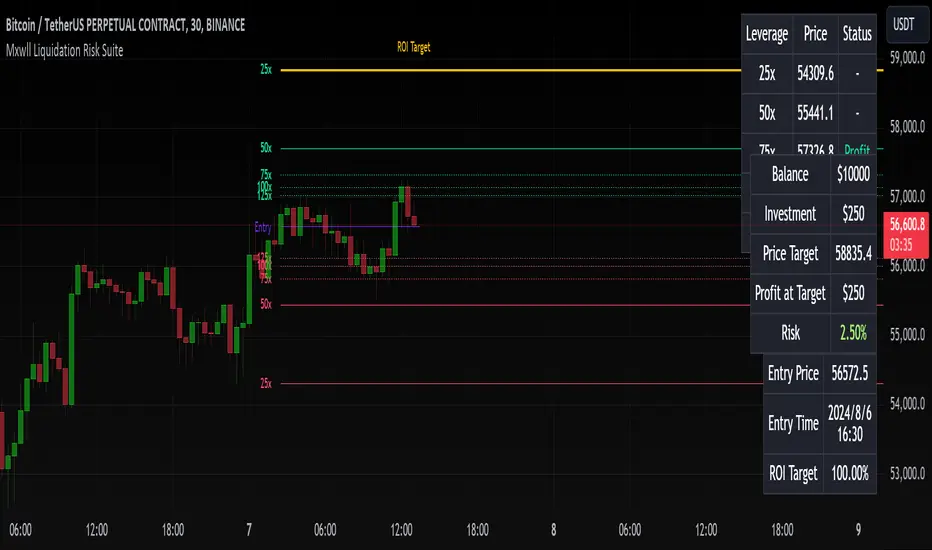
Liquidation Risk Suite [Mxwll]Hello traders 👋
This indicator "Liquidation Risk Suite" hosts various features that allow the trade to determine optimal position sizing, leverage, profit targets, and more!
Features
Customizable entry price and time
From the entry price, a user-defined number of liquidation levels by leverage are shown
From the entry price, a user-defined number of profit targets by leverage are shown
User-defined ROI % target. Liquidation levels and profit targets automatically change to account for the traders' desired profit percentage.
Calculate for long and short positions
Trader can set portfolio balance and investment per trade - indicator will warn the trader when the investment per trade is too high relative to the portfolio balance.
How this script works
The Liquidation Risk Suite is designed to help traders determine position sizing, appropriate risk for their position (leverage, etc.), and potential profit targets from their entry point.
Upon loading the script, the script will prompt you for an entry price and entry time. Simply click the screen at the appropriate locations (your entry price and entry bar) and, from there, the script will calculate various liquidation levels, determine whether your trade has achieved the desired profit at various leverages, and provide various trading metrics such as % risk of portfolio, ROI target %, profit at target, and more!
The image above outlines various trade-related metrics for your position!
These metrics include:
Status of trade (profit or loss) for various common leverage amounts
Portfolio balance
Investment amount
Price target (calculated from desired ROI%)
Profit at target (calculated from desired ROI% and leverage used)
Portfolio risk
Entry price
Entry time
ROI Target %
The image above explains the output of the script, including line style indications!
Solid lines indicate that the leverage used for at your entry price constitutes an active trade. Dotted lines mean the trade has already achieved your profit target for that leverage, or stopped out.
Additionally, the script can calculate pertinent metrics for short positions!
That's all, just a simple, sweet script to help traders figure out what leverage to use for their positions, the risk they're taking on, and potential stop and profit levels!
Thank you to kaigouthro for his colors library!
Partial Profit Calculator [TFO]This indicator was built to help calculate the outcome of trades that utilize multiple profit targets and/or multiple entries.
In its simplest form, we can have a single entry and a single profit target. As shown below in this long trade example, the indicator will draw risk and reward boxes (red and green, respectively) with several annotations. On the left-hand side, all entries will be displayed (in this case there is only one entry, "E1"). On the bottom, the "SL" label indicates the trade's stop loss placement. On the top, all target prices are displayed (in this case there is only one target, "TP1"). Lastly, on the right-hand side a label will display the total R that is to be expected from a winning trade, where R is one's unit of risk.
In the following example, we have two target prices - one at 18600 and one at 18700. You can input as many target prices as you'd like, separated by commas, i.e. "18600,18700" in this example. Make sure the values are separated by commas only, and not spaces, new lines, etc. As a result, we can see that the indicator draws where our profit targets would be with respect to our entry, E1. The indicator assumes that equal parts of the trade position are taken off at each target price. In this example on Nasdaq futures (NQ1!), since we have 2 target prices, this would be equivalent to assuming that we take exactly half the trade position off at TP1, and the remaining half of the position at TP2.
If we wanted to take more of the position off at a certain target, we could simply duplicate the target price. Here I set the target prices to "18600,18600,18700" to enforce that two thirds of the position be taken off at TP1 and TP2, while the remaining third gets taken off at TP3.
We can also show outcome annotations to describe how much R is generated from each possible trade outcome. Using the below chart as an example, the stop loss indicates a -1R loss. The total R from this trade criteria is 1.33 R, and each target price shows how much R is being generated if one were to take off an equal part of the position at said target prices. In this case, we would generate 0.17 R from taking one third of the position off at TP1, another 0.5 R from taking one third of the position off at TP2, and another 0.67 R from taking the remaining one third of the position off at TP3, all adding up to the total R indicated on the right-hand side label.
Using multiple entries works the same way as using multiple target prices, where the input should indicate each entry price separated by commas. In this example I've used "18550,18450" to achieve an average price of 18500, as indicated by the "E_avg" label that appears when more than one entry price is utilized. We can also opt to display risk as dollars instead of R values, where you can input your desired risk per trade, and all values are shown as dollar amounts instead of R multiples, as shown below with a risk per trade of $100.
This is meant to be an educational tool for trades that utilize multiple profit targets and/or entries. Hope you like it!
