Donchian Trend Ranges [AlgoAlpha]🚀🔗 Donchian Trend Ranges 🔗🚀
Elevate your trading game with the Donchian Trend Ranges indicator from AlgoAlpha! 🌟📈 This advanced tool helps you visualize market trends and potential reversal points using Donchian channels, volatility measures, and average true range (ATR).
Key Features
⚙️ Customizable Parameters: Adjust the lookback period and range multiplier to fit your trading style.
🎨 Color-Coded Trends: Easily distinguish between uptrends and downtrends with customizable colors.
📊 Dynamic Channels: Visualize multiple dynamic channels based on Donchian ranges and volatility.
☁️ Trend Clouds: See market strength and weakness with upper and lower trend clouds.
🔔 Signal Alerts: Get notified of potential trend shifts and take profit points.
How to Use
🛠 Add the Indicator: Add the indicator to favorites. Customize settings such as the lookback period and range multiplier to match your trading needs.
🔍 Analyze Trends: The indicator calculates the highest and lowest prices over a specified period to create dynamic channels. It then uses standard deviation and ATR to adjust these channels for market volatility, plotting upper and lower ranges. Green bars indicate an up trend and red bars for a down trend.
🔔 Set Alerts: Enable notifications for bullish and bearish trend shifts, as well as weak and strong take profit points, ensuring you never miss an opportunity.
How it Works
The Donchian Trend Ranges indicator calculates the highest and lowest prices over a specified period to create a basis line. It creates a range around the basis based on standard deviations and the clouds' width is determined by a 14 period ATR. The basis line and bar colors changes based on whether the closing price is above or below it, indicating trends. Clouds around these lines represent market reversal zones that can be used as entry levels when used in confluence with momentum indicators, visual signals ("X" and "◆") marking strong and weak take profit points are also printed when the prices revert from the clouds towards the basis. Integrated alerts notify you of significant events like trend shifts and take profit signals, keeping you informed without constant monitoring.
Unleash the power of the Donchian Trend Ranges in your trading strategy! 🌐📈✨
Reversalindicator

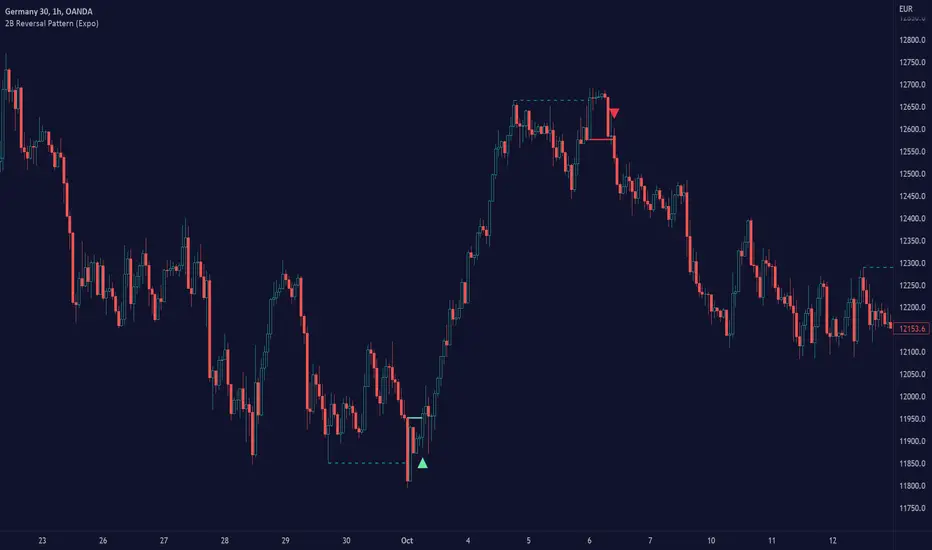
2B Reversal Pattern (Expo)█ Overview
The 2B reversal pattern , also called the "spring pattern", is a popular chart pattern professional traders use to identify potential trend reversals. It occurs when the price appears to be breaking down or up and then suddenly bounces back up/down, forming a "spring" or "false breakout" pattern. This pattern indicates that the trend is losing momentum and that a reversal is coming.
In a bearish market , the "spring pattern" occurs when the price of an asset breaks below a support level, causing many traders to sell their positions and causing the price to drop even further. However, the selling pressure eases at some point, and the price begins to rebound, "springing" back above the support level. This rebound creates a long opportunity for traders who can enter the market at a lower price.
In a bullish market , the "spring pattern" occurs when the price of an asset breaks above a resistance level, causing many traders to buy into the asset and drive the price up even further. However, the buying pressure eases at some point, and the price begins to decline, "springing" below the resistance level. This decline creates a selling opportunity for traders who can short the market at a higher price.
█ What are the benefits of using the 2B Reversal Pattern?
The benefits of using the 2B Reversal pattern as a trader include identifying potential buying or selling opportunities with reduced risk. By waiting for the price to "spring back" to the initial breakout level, traders can avoid entering the market too soon and minimize the risk of potential losses.
█ How to use
Traders can use the 2B reversal pattern to identify reversals. If the pattern occurs after an uptrend, traders may sell their long positions or enter a short position, anticipating a reversal to a downtrend. If the pattern occurs after a downtrend, traders may sell their short positions or enter a long position, anticipating a reversal to an uptrend.
█ Consolidation Strategy
First, traders should identify a period of price consolidation or a trading range where the price has been trading sideways for some time. The key feature of the "spring pattern" is a sudden, sharp move downward/upwards through the lower/upper boundary of this trading range, often accompanied by high volume.
However, instead of continuing to move lower/higher, the price then quickly recovers and moves back into the trading range, often on low volume. This quick recovery is the "spring" part of the pattern and suggests that the market has rejected the lower/higher price and that buying/selling pressure is building.
Traders may use the "spring pattern" as a signal to buy/sell the asset, suggesting strong demand/supply for the stock at the lower/higher price level. However, as with all trading strategies, it is important to use other indicators and to manage risk to minimize potential losses carefully.
-----------------
Disclaimer
The information contained in my Scripts/Indicators/Ideas/Algos/Systems does not constitute financial advice or a solicitation to buy or sell any securities of any type. I will not accept liability for any loss or damage, including without limitation any loss of profit, which may arise directly or indirectly from the use of or reliance on such information.
All investments involve risk, and the past performance of a security, industry, sector, market, financial product, trading strategy, backtest, or individual's trading does not guarantee future results or returns. Investors are fully responsible for any investment decisions they make. Such decisions should be based solely on an evaluation of their financial circumstances, investment objectives, risk tolerance, and liquidity needs.
My Scripts/Indicators/Ideas/Algos/Systems are only for educational purposes!