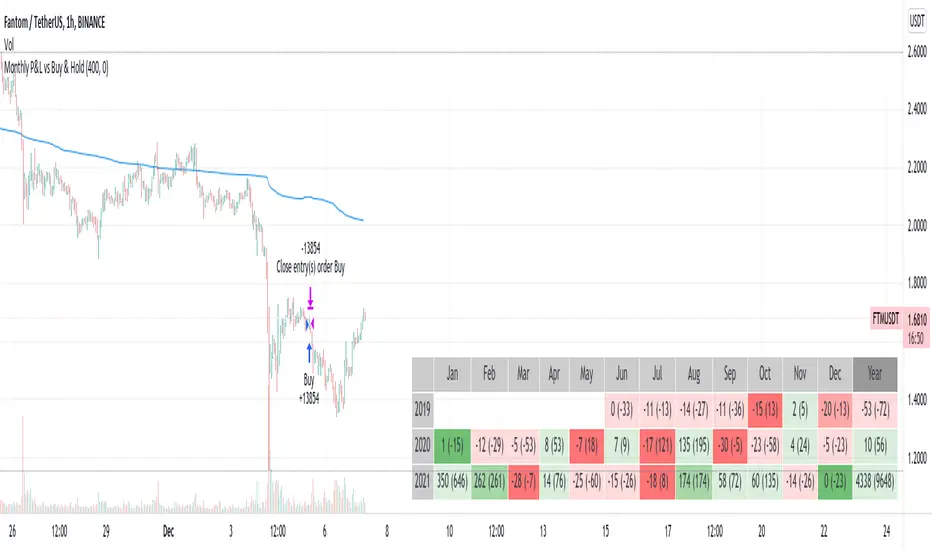
Monthly Returns in Strategies with Market BenchmarkThis is a modified version of this excellent script Monthly Returns in PineScript Strategues by QuantNomad
I liked and used the script but wanted to see how strategy performed vs market on each month/year. So I am sharing back.
The modification consists in adding Market or Buy & Hold performance between parenthesis inside each cell to better see how strategy performed vs market.
Also, 3 red levels and 3 green levels have been used :
For green :
1/ Light when strategy pnl > 0 but < market
2/ medium when strategy pnl > 0 and > market
3/ Dark when strategy pnl > 0 and market < 0 or pnl > market x 2
Same logic in the opposite direction for red.
The strategy provided here is just a showcase of how to use the table in pine script.
Disclaimer
Please remember that past performance may not be indicative of future results.
Due to various factors, including changing market conditions, the strategy may no longer perform as well as in historical backtesting.
This post and the script don’t provide any financial advice.
Returns
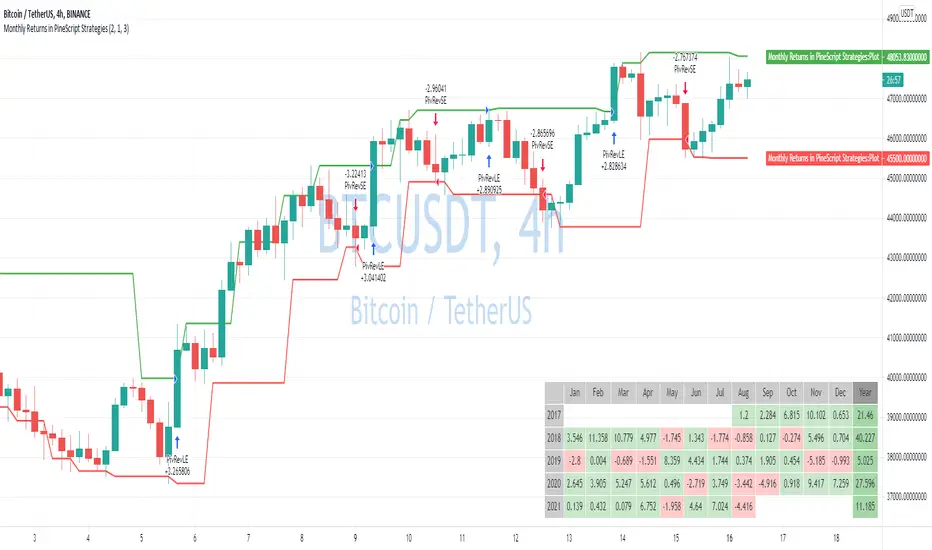
Monthly Returns in PineScript StrategiesI'm not 100% satisfied with the strategy performance output I receive from TradingView. Quite often I want to see something that is not available by default. I usually export raw trades/metrics from TradingView and then do additional analysis manually.
But with tables, you can build additional metrics and tools for your strategies quite easily.
This script will just show a table with monthly/yearly performance of your script. Quite a lot of traders/investors used to look at returns like that. Also, it might help you to identify periods of time when your strategy performed good/bad than expected and try to analyze that better.
The script is very simple and I believe you can easily apply it to your own strategies.
Disclaimer
Please remember that past performance may not be indicative of future results.
Due to various factors, including changing market conditions, the strategy may no longer perform as well as in historical backtesting.
This post and the script don’t provide any financial advice.
Rolling ReturnsWhat does this indicator show?
This indicator shows the rolling return of a set lookback period.
The default indicator value is 20 which will show the rolling 20-day return because 20 trading days is 1 month.

Seasonality of ReturnsHi!
I want to share a simple script I built to analize the seasonality of Bitcoin and other assets.
So far it just displays the average return of each month, but I might add some more things later on.
The best timeframe to use it is the monthly timeframe it works on all timeframes but you need the full history for the average, and on weekly you will see issues cause weeks dont match months
On the dataview you can see the variance of each month, feel free to edit it at your own like
Mikel

[BCT] Can BTC be predicted or is it purely random?Variance Ratio**This indicator can be applied to the ticker of your choice (not just BTC)**
Markets are said to be "efficient". An efficient market is by definition unpredictable - no matter the amount of ML, computation, or indicators thrown at it. In particular, in an efficient market, TA will not be of help.
An illustration of efficient markets is the WSJ's longstanding monkey vs. human contest:Blindfolded Monkey Beats Humans With Stock Picks, granted there are several flaws to it.
BTC is a relatively new market. New markets are typically highly inefficient (easier to make money) and become more and more efficient over time (harder to make money). How much more efficient is BTC becoming?
We apply the Variance Ratio method and apply it to BTC.
BACKGROUND ON THE VARIANCE RATIO METHOD
Based on 1988 MacKinlay's seminal paper "Stock Market Prices do not Follow a Random Walk", the idea is to exploit a phenomenon called "variance scaling".
For those keen on looking into the math, the short version of it is under the assumption of iid (random walk) we have the following:
H0: Var(Sum(returns over K bars))=Sum(Var(returns over 1 bar))=k*Var(return over 1 bar)
We look to reject or not H0 depending on the observations.
In this script, we compare the variance of the (log) returns for the chart selected between:
(1) The (average) variance over k bars (call this Vk)
(2) The (average) variance over 1 bar (call this V1)
H0 simply says that Vk=k*V1 if the stock follows a random walk.
We compute the Variance Ratio VR(k)=Variance(returns over k bar)/(Sum(Var(returns over 1 bar)))-1
We then compute the associated Z-score which we chart out for a configurable k number of bars.
HOW TO INTERPRET THE CHART
The line drawn is the Z-Score for VR(k). It represents the number of standard deviations of VR(k) from 0 - the further out, the less random.
- If the line is close / hovers around 0, the ticker appears to follow a random walk (i.e. may not be predictable)
- If the line is consistently > 2 or <-2, the ticker likely does not follow a random walk (i.e. may have predictable features)
- If the line is positive, it means that the Variance on the k bars is larger than the variance on 1 bar (more variance on longer timeframes)
- If the line is negative, it means that the Variance on the k bars is smaller than the variance on 1 bar (more variance on smaller timeframes)
USE CASES
- Identify timeframes where you won't be able to make money
- Identify whether a stock cannot be predicted (forget about TA, indicators etc. -- a random walk is not predictable)
- Identify whether a stock is becoming less and less predictable (Z-score amplitude will decrease over time)
FEATURES
- select the number of K bar to compare vs. 1 bar (default = 16) - ideally a power of 2 but any other number will work. The chart is based off this selection
- select the lookback period for the analysis (500 bars by default)
- select the source to analyze (default = close, but you may select other inputs to calculate the returns from)
- results form the statistical tests on different K's in the table on the right/bottom side of the chart (H0 rejected = not random walk; H0 not rejected = it essentially looks rather random and we can't conclude that it's not a random walk)
COMMENTARY ON BTC
- It appears BTC's absolute value of the ZScore on the Variance Ratio is declining year after year - corroborating an increasingly efficient market as new participants join.
- However, we can still detect a fair amount of potential inefficiency using this simple test.
As usual, this is not investment advice. DYOR.
With love,
🐵BCT🐵

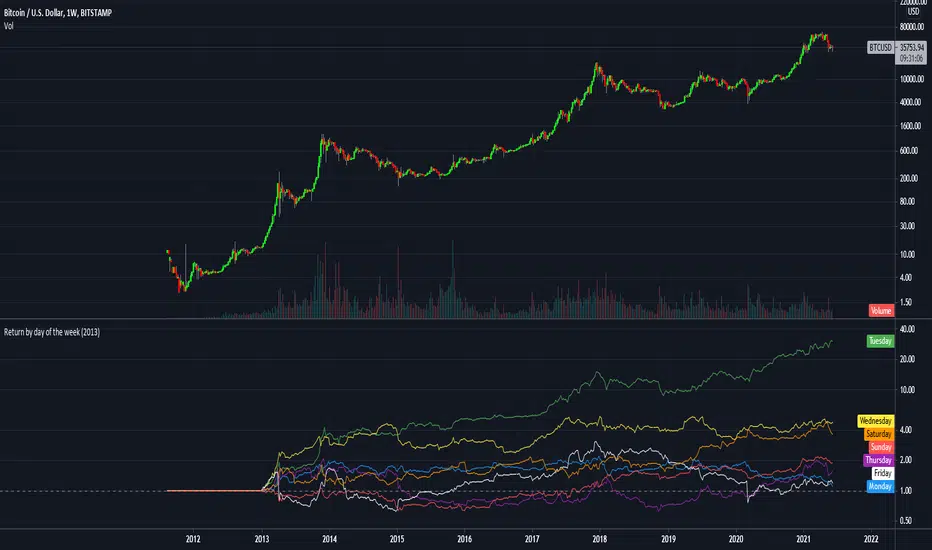
Return by day of the weekBuy on Mondays sell on Tuesdays.
Just a simple tracking of returns.
It works only on the weekly charts
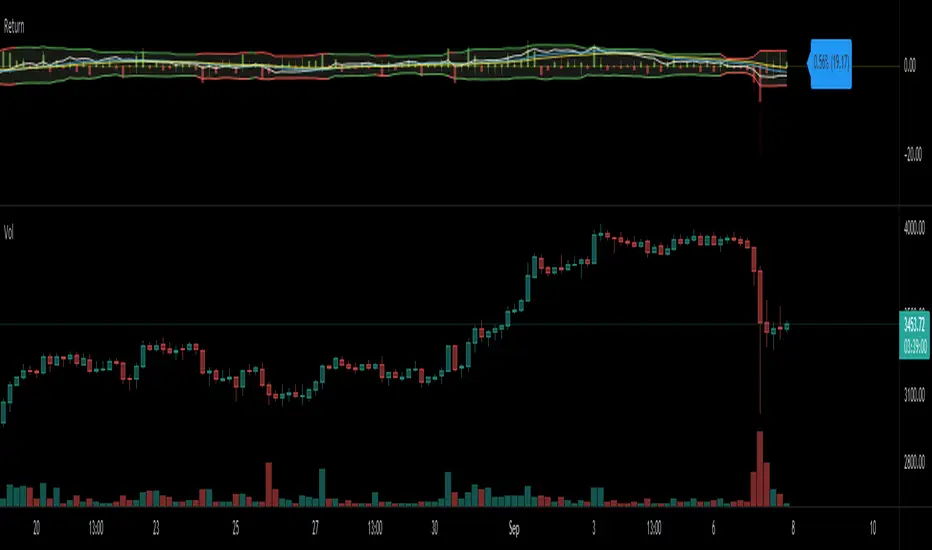
Return (Percent Change)This Script displays Regular or Log Returns as either a line or histogram and labels the current bar.
If something other than price is selected as the source, the result is percent change with a positive or negative slope.
If a moving average of price is used as the source, the result is analogous to a strength index
Other options include a look-back period adjustment (the default is 1),
smoothing results by converting to an EMA, and
Bollinger Bands with Length and Standard Deviation inputs.
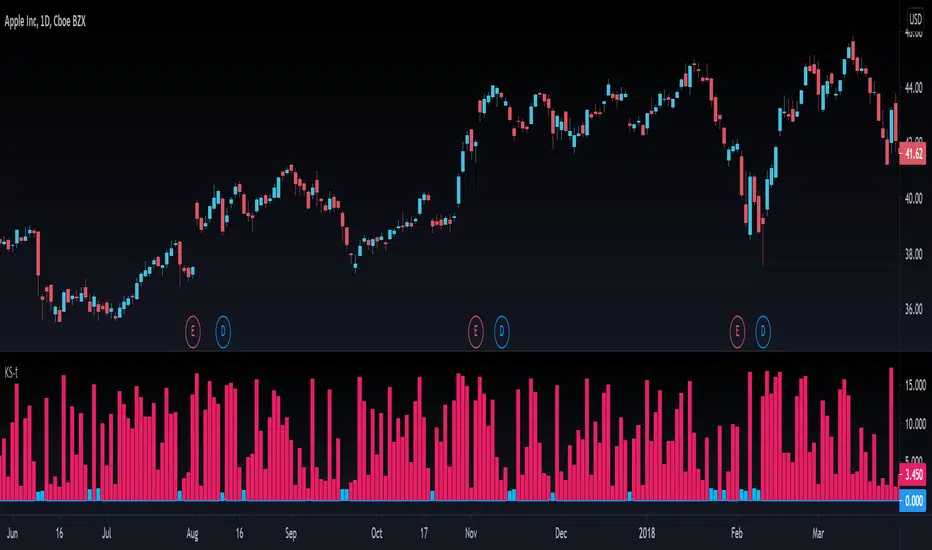
Kolmogorov-Smirnov TestThe Kolmogorov–Smirnov test aims to tell you if the distribution of prices (or log returns) tends to follow a normal distribution or not. You can read about this test on Wikipedia . It seems to be a basic but trusted measure in the quantitative trading world.
When KS-t columns are blue, then it's safe to assume normal distribution. When they are red, the normal distribution assumption is proven wrong by the magnitude of the KS-t value.
In the plotting tab of the script, you can activate another option that displays the probability of the distribution being actually normal. It's values are bounded between 0 and 1, like all probabilities.
This test can be useful when using statistical concepts for trading markets, like standard deviations, z-scores, etc because they all depend on the assumption of prices (or log returns) being normaly distributed.
If you see something wrong, don't hesitate to message me.
Happy trading to all.

Portfolio: alpha, beta, stdev, variance, mean, max drawdown...Portfolio Metrics **New**
'returns'
'log returns'
'geometric returns'
portfolio alpha
portfolio beta
portfolio,market correlation
portfolio standard deviation
portfolio variance
mean portfolio returns
maximum drawdown
maximum gain

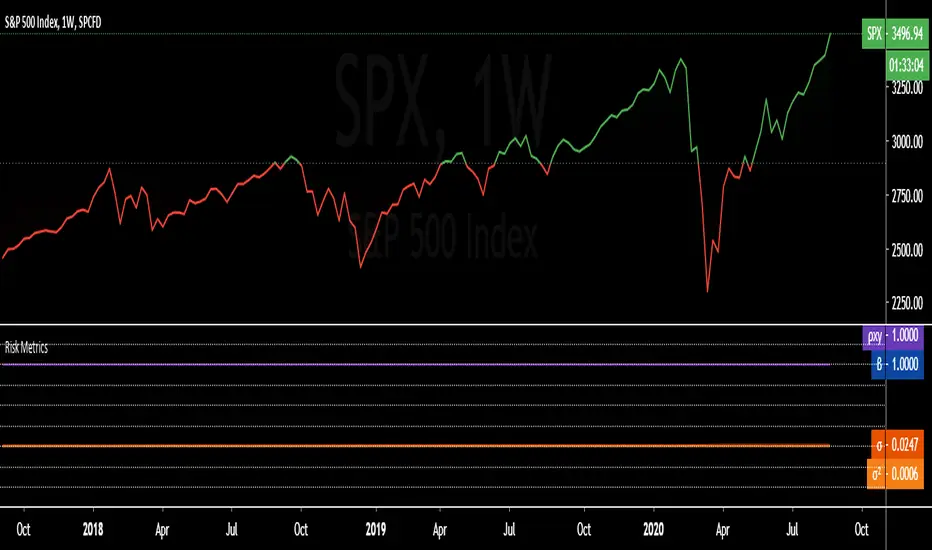
Risk Metrics: beta 'β', correl 'ρxy', stdev 'σ', variance 'σ²'Portfolio Risk Metrics (Part I):
beta 'β'
The beta coefficient can be interpreted as follows:
β =1 exactly as volatile as the market
β >1 more volatile than the market
β <1>0 less volatile than the market
β =0 uncorrelated to the market
β <0 negatively correlated to the market
excerpt from the Corporate Finance Institute
correlation coefficient 'ρxy'
The correlation coefficient is a value that indicates the strength of the relationship between variables.
The coefficient can take any values from -1 to 1. The interpretations of the values are:
-1: Perfect negative correlation. The variables tend to move in opposite directions
(i.e., when one variable increases, the other variable decreases).
0: No correlation. The variables do not have a relationship with each other.
1: Perfect positive correlation. The variables tend to move in the same direction
(i.e., when one variable increases, the other variable also increases).
excerpt from the Corporate Finance Institute
standard deviation 'σ'
68% of returns will fall within 1 standard deviation of the arithmetic mean
95% of returns will fall within 2 standard deviations of the arithmetic mean
99% of returns will fall within 3 standard deviations of the arithmetic mean
excerpt from Corporate Finance Institute
variance 'σ²'
In investing, variance is used to compare the relative performance of each asset in a portfolio.
Because the results can be difficult to analyze, standard deviation is often used instead of variance.
In either case, the goal for the investor is to improve asset allocation.
excerpt from Investopedia
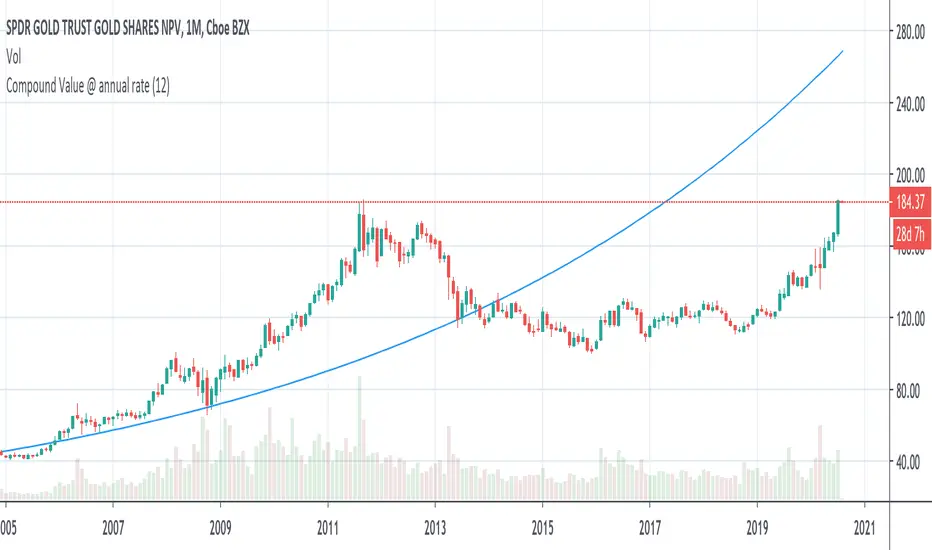
Compound Value @ annual rateBy studying historical data we can know the compounded growth rate of an investment from the inception date. For example if we know that an investment has grown at the rate of 6% in the past and if we expect similar growth in the future also, We can plot this graph to understand whether the current price is underpriced or overpriced as per projected return.
In this graph, it takes the initial close price as a principle and rate from the input and calculates the compound amount at each interval.
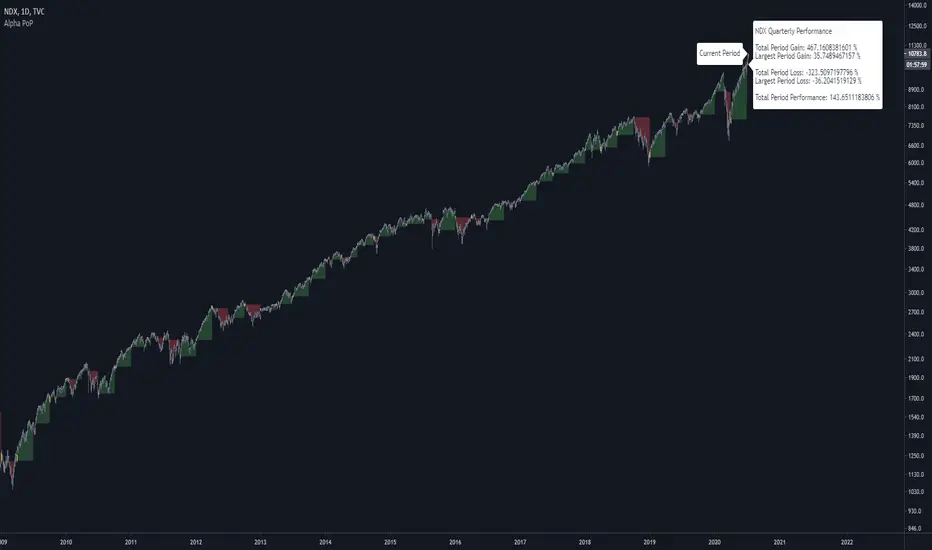
Alpha Performance of PeriodAlpha Performance of Period (PoP) produces a visualization of returns (gains and losses) over a quarterly, monthly, or annual period. It also displays the total % gain and loss over any length of days, months, and years as defined by the user.
Performance of Period (PoP) can be used to understand the performance of an asset over multiple periods using a single chart layout, and to compare the performance of different assets by using a multi-chart layout.
This can, for example, be used to compare the NASDAQ, S&P, and DJI over the past 20 years to create a dow vs. nasdaq vs. s&p performance chart. This can help you understand a comparison of historical returns by showing which performs the best month-over-month, quarter-to-quarter, year-to-year, throughout any custom period of days/months/years.
The ability to get a visualization of the % gain/loss can help to better understand how markets have performed over time and which markets have historically performed the best.
Check out the up and coming Educational Idea we will be releasing soon after this is live to see an example of how we use this tool.
Current Period Label
-----
Current Period : This label shows the current period's performance only when you hover over it.
(This label is located to the left of the current period's open candle and at the current candles close price)
TICKER "Time Period" Performance Label
-----
Total Period Gain : The total of all % gain periods from the start to end date.
Largest Period Gain : The biggest % gain period from the start to end date.
Total Period Loss : The total of all % loss periods from the start to end date.
Largest Period Loss : The biggest % loss period from the start to end date.
Total period Performance : The total % performance, the difference between the total gain and total loss.
NOTE : The "Current Period" performance is excluded from ALL five of the above-mentioned figures. This was done to avoid giving inaccurate comparison figures due to the period not being finished yet.
Inputs
-----
Current Script Version + Info : A drop-down list of instructions for the user to refer to.
Dark Mode Labels : Toggle on for Dark Mode. This is done since Labels text and background color can not be adjusted separately within the visual inputs so this is the best fit solution.
Time Period of Returns : Pick the period of performance you would like to emulate monthly/quarterly/annual.
Start Date : The day to start tracking performance.
Start Month : The month to start tracking performance.
Start Year : The year to start tracking performance.
End Date : The day to stop tracking performance.
End Month : The month to stop tracking performance.
End Year : The year to stop tracking performance.
As always if you have any feedback let us know in the comments and leave a like if you enjoy this tool :)
Daily Returns & STDWhat happened last time when xx increased by xx%? - Start collecting some stats!
You can choose the ticker and the timeframe you're interested in
