SnR Painter 2.1Easy to use - this provide the resistant and support levels with many options to turn on or off the look and feel such as:
- background color
- display/hide the support/resistance lines
- display/hide the support/resistance prices
- highlight recent S/R
Resistances

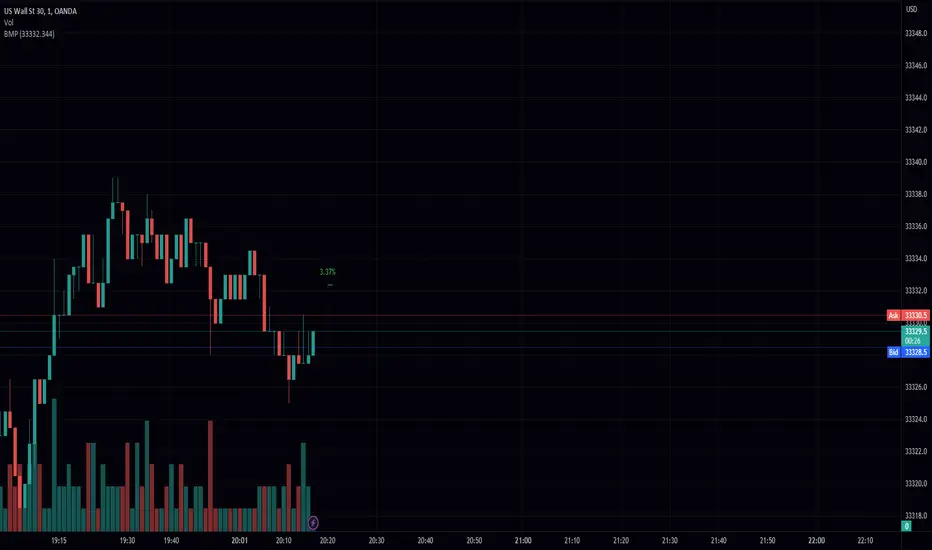
Defended Price Levels (DPLs) — Melvin Dickover ConceptThis indicator identifies and draws horizontal “Defended Price Levels” (DPLs) exactly as originally described by Melvin E. Dickover in his trading methodology.
Dickover observed that when extreme relative volume and extreme “freedom of movement” (volume-to-price-movement ratio) occur on the same bar, especially on bars with large gaps or unusually large bodies, the closing price (or previous close) of that bar very often becomes a significant future support/resistance level that the market later “defends.”
This script automates the detection of those exact coincident spikes using two well-known public indicators:
Relative Volume (RVI)
• Original idea: Melvin Dickover
• Pine Script implementation used here: “Relative Volume Indicator (Freedom Of Movement)” by LazyBear
Link:
Freedom of Movement (FoM)
• Original idea and calculation: starbolt64
• Pine Script: “Freedom of Movement” by starbolt64
Link:
How this indicator works
Calculates the raw (possibly negative) LazyBear RVI and starbolt64’s exact FoM values
Normalizes and standardizes both over the user-defined lookback
Triggers only when both RVI and FoM exceed the chosen number of standard deviations on the same bar (true Dickover coincident-spike condition)
Applies Dickover’s original price-selection rules (uses current close on big gaps or 2× body expansion candles, otherwise previous close)
Draws a thin maroon horizontal ray only when the new level is sufficiently far from all previously drawn levels (default ≥0.8 %) and the maximum number of levels has not been reached
Keeps the chart clean by limiting the total number of significant defended levels shown
This is not a republish or minor variation of the two source scripts — it is a faithful automation of Melvin Dickover’s specific “defended price line” concept that he manually marked using the coincidence of these two indicators.
Full credit goes to:
Melvin E. Dickover — creator of the Defended Price Levels concept
LazyBear — author of the Relative Volume (RVI) implementation used here
starbolt64 — author of the Freedom of Movement indicator and calculation
Settings (all adjustable):
Standard Deviation Length (default 60)
Spike Threshold in standard deviations (default 2.0)
Minimum distance between levels in % (default 0.8 %)
Maximum significant levels to display (15–80)
Use these horizontal maroon lines as potential future support/resistance zones that the market has previously shown strong willingness to defend.
Thank you to Melvin, LazyBear, and starbolt64 for the original work that made this automation possible.

Market Profile based Support/ResistanceBrought to you by Stock Kaka - Your trading sidekick 🦜📈 - pay your visit at stockkaka.my.canva.site or find us on X #StockKaka
📊 What This Indicator Does
Ever wish the market would just tell you where the important levels are? Well, buckle up, because this indicator is like having a market whisperer on your chart!
Based on cutting-edge hierarchical market structure analysis (fancy words for "smart support and resistance"), this bad boy uses ATR-based Directional Change to identify turning points that actually matter. No more guessing where price might bounce or break—let the algorithm do the heavy lifting while you sip your coffee ☕
🎯 The Five Levels Explained (From Noisy to Mighty)
Think of these levels like a pyramid of importance. Level 0 is your chatty friend who notices everything, while Level 4 is the wise oracle who only speaks when it really matters.
Level 0: The Hyperactive Scout 🐿️
What it does: Catches every little zigzag in price using ATR confirmation
Significance: Very short-term, intraday noise
Best for: Scalpers who love action every few minutes
Trader Type: "I refresh my chart 100 times an hour"
Reliability: ⭐⭐ (It's enthusiastic but easily excitable)
Level 1: The Day Trader's Buddy 🎯
What it does: Filters Level 0 to show minor swing highs/lows
Significance: Intraday support/resistance, hourly structure
Best for: Day traders, scalpers looking for better entries
Trader Type: "I close all positions before dinner"
Reliability: ⭐⭐⭐ (Solid for quick moves)
Level 2: The Swing Trader's Sweet Spot 🎪
What it does: Identifies multi-day to weekly structure points
Significance: Intermediate support/resistance where battles happen
Best for: Swing traders, position traders
Trader Type: "I hold for days, not minutes"
Reliability: ⭐⭐⭐⭐ (Now we're talking real structure!)
Level 3: The Big Money Magnet 💰
What it does: Shows major market structure—where the whales play
Significance: Weekly to monthly levels, institutional zones
Best for: Position traders, trend followers
Trader Type: "I think in weeks and months, not hours"
Reliability: ⭐⭐⭐⭐⭐ (These levels have gravitational pull!)
Level 4: The Market Prophet 🔮
What it does: Reveals ultra-major turning points (think: quarterly/yearly pivots)
Significance: Long-term macro structure, investment-grade levels
Best for: Investors, long-term position traders
Trader Type: "Warren Buffett is my spirit animal"
Reliability: ⭐⭐⭐⭐⭐⭐ (When these break, market's rewrite the story)
⚙️ Parameter Setup Guide (The Secret Sauce)
The magic ingredient is the ATR Lookback Period—think of it as teaching the indicator your timeframe's "dialect." Here's your cheat sheet:
2-Minute Chart ⚡
ATR Lookback: 720 (24 hours of 2-min bars)
Who uses this: Crypto degens, futures scalpers, adrenaline junkies
Show Levels: L0, L1, L2 (L3+ won't budge much)
Pro Tip: Enable only L1 and L2 or your chart will look like spaghetti
5-Minute Chart 🏃
ATR Lookback: 288 (24 hours of 5-min bars)
Who uses this: Active day traders, news traders
Show Levels: L1, L2, L3
Pro Tip: L2 is your best friend here—perfect for intraday swings
15-Minute Chart 📈
ATR Lookback: 96 (24 hours of 15-min bars)
Who uses this: Swing traders, patient day traders
Show Levels: L1, L2, L3
Pro Tip: This is the "Goldilocks zone"—not too fast, not too slow
1-Hour Chart ⏰
ATR Lookback: 168 (1 week of hourly bars)
Who uses this: Swing traders, position traders
Show Levels: L2, L3, L4
Pro Tip: L3 levels here are like magnets for price action
Daily Chart 📅
ATR Lookback: 30 to 50 (1-2 months)
Who uses this: Investors, long-term traders, people with patience
Show Levels: L2, L3, L4
Pro Tip: L4 on dailies = "Don't fight this level, respect it"
🎨 How to Use This Thing
Add to Chart - Duh! 😄
Set Your ATR Lookback - Use the guide above (don't wing it!)
Enable Relevant Levels - Less is more! Turn off levels that just clutter
Watch the Magic - See horizontal lines appear at key S/R zones
Check the Table - Top-right corner shows current levels (fancy!)
Set Alerts - Get notified when price approaches or breaks levels
Trading Strategies 🎲
The Bounce Play:
Price approaches Level 2 or 3 support → Look for bullish reversal signals
Take profit at the next level resistance
Stop loss just below the support level
The Breakout Play:
Price breaks through Level 2/3 resistance with volume → Go long
Next level becomes your target
Failed breakout? Level becomes resistance again (classic fake-out)
The Confluence Play:
When Level 3 aligns with your favorite indicator (RSI oversold, moving average, Fibonacci) → Chef's kiss! 👨🍳💋
These multi-confirmation setups are where the money lives
🚨 Important Notes (Read This or Blame Yourself Later)
⚠️ This indicator REPAINTS on the current bar until an extreme is confirmed. That's not a bug, it's how directional change works. The past levels are solid as a rock, but the pending one is still... pending.
⚠️ More levels ≠ Better results. Showing all 5 levels is like having 5 GPS apps shouting directions at once. Pick 2-3 levels max.
⚠️ ATR Lookback matters! Wrong setting = garbage results. Use the guide above or experiment carefully.
⚠️ Volatile markets (crypto, meme stocks) work GREAT with this. Choppy, range-bound markets? Meh.
⚠️ Combine with other tools! This shows you WHERE, not WHEN. Use momentum indicators, volume, or your favorite chicken entrails for timing 🐔
🦜 Final Word from Stock Kaka
Remember: Indicators don't make money, traders do. This tool shows you where the market has historically respected structure. What you do with that info? That's on you, champ!
Use proper risk management, don't YOLO your rent money, and may your stops never get hunted 🎯
Trade smart, trade safe, and let Stock Kaka be your guide!
📝 Credits
Algorithm: neurotrader888 (Python implementation)
Pine Script Conversion: Your friendly neighborhood Stock Kaka team!!
Inspiration: Ginger chai, market inefficiencies, and a dash of chaos
📌 Tags
support-and-resistance market-structure atr directional-change multi-timeframe swing-trading day-trading levels hierarchical-analysis algo-trading

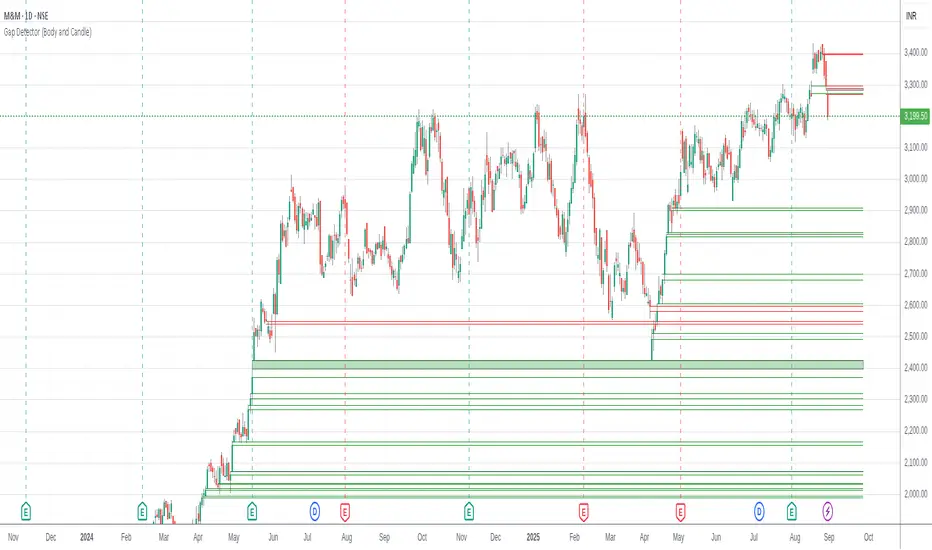
Gap Detector (Body and Candle)Finds/Detects gaps between candles and candle bodies for any chart/timeframe with O(n+delta) performance.
Candle Gaps (between wicks) act as strong support or resistance. They are drawn as solid boxes.
Body Gaps (ignores wicks) act as mild support or resistance. They are depicted with lines.
Adjust the settings for candle/body gap width, smaller the time frame, smaller the gap.
Adjust max historical bars to fine tune performance on your system/setup. The more historical bars the script scans, more time required to load the chart. At times based on system configuration, TradingView may timeout the script due to too many bars. Reducing the max bars helps in this scenario.
This is a revamped version of "Body Gap Detector".
Happy charting !
LevelsThis Indicator is meant to plot some of the most common levels that traders use.
The display of these levels is highly customizable, as you can choose the line type , color , thickness and whether it shows you no label, price only, reduced label or full label next to the line. All labels (except for "no Label") will show the price at this level.
Also You have the option to mark the start on each timeframe with either a individually colored background or a vertical line where you can choose the line style and color.
Full List of available Levels and Optional inputs to these levels:
Previous HTF Candle Levels:
• Previous HTF Candle Open
• Previous HTF Candle High
• Previous HTF Candle Low
• Previous HTF Candle Close
Optional:
• Choose any higher timeframe
• Mark start of new HTF candle
Session Levels:
• Session Open
• Session High
• Session Low
• Session Close
Optional:
• Choose any time as start and end of your session
• Mark start of session
• Mark full session
Daily Levels:
• Current Day Open
• Current Day High
• Current Day Low
• Previous Day Open
• Previous Day High
• Previous Day Low
• Previous Day Close
Optional:
• Choose start of day (standard, NY Midnight, custom start time)
• Mark start of day
Weekly Levels:
• Current Week Open
• Current Week High
• Current Week Low
• Previous Week Open
• Previous Week High
• Previous Week Low
• Previous Week Close
Optional:
• Mark start of Week
Monthly Levels:
• Current Month Open
• Current Month High
• Current MonthLow
• Previous Month Open
• Previous Month High
• Previous Month Low
• Previous Month Close
Optional:
• Mark start of Month

Levels by Touches (v2) [chingybrooks]Levels by Touches (v2)
This script scans the last N bars to identify significant support and resistance levels by counting wick-touches.
How it works:
1. Wick detection – marks a touch whenever upper or lower wick ≥ X% of candle body (or on doji)
2. Level grouping – merges touches within a tolerance of Y ticks
3. Touch weighting – recent touches (in the latter half of lookback) count Z× more
4. Filtering – only plots levels with ≥ M total touches
Inputs:
Bars to scan (N): lookback period (max 200 bars)
Min touches (M): minimum hits to qualify as a level
Tolerance (ticks): price “slop” for grouping nearby touches
Min wick %: wick size threshold as % of body
Recent touch weight (Z): multiplier for touches in the latest half
Use this indicator to spot high-probability S/R zones based on actual price rejections.

Air Gap MTF with alert settingsWhat it shows:
This indicator will show a horizontal line at a price where each EMAs are on on different time frames, which will remove the effort of having to flick through different time frames or look at different chart.
The lines itself will move in real time as price moves and therefore as the EMA values changes so no need to manually adjustment the lines.
How to use it:
The price gap between each of the lines are known as "air gaps", which are essentially zones price can move with less resistance. Therefore bigger the airgap there is more likely more movement in price.
In other words, where lines are can be a resistance (or support) and can expect price stagnation or rejection.
On the chart it is clear to see lines are acting as resistances/supports.
Key settings:
The time frame are fixed to: 30min, 1hr and 4hr. This cannot be changed as of now.
EMA values for each time frame are user changeable in the settings, and up to 4 different values can be chosen for each time frame. Default is 5,12,34 and 50 for each timeframe.
Line colour, thickness and style can be user adjusted. Start point for where line will be drawn can be changed in the settings, either: start of day, user defined start or across the chart. In case of user defined scenario user can input a number that specifies a offset from current candle.
Label colour, font, alignment, text size and text itself can be user adjusted in the settings. Price can be also displayed if user chooses to do so. Position of label (offset from current candle) is user specified and can be adjusted by the user.
Both the lines and labels can be turned off (both and individually), for each lines.
Alert Settings:
Manually, user can set alerts for when price crosses a specific line.
This can be done by:
right click on any of line
choose first option (add alert on...)
On the second option under condition, use the dropdown menu to choose the desired EMA/timeframe to set alert for.
Hit "create" at bottom right of option
----------------------------------------------------------------------
If anything is not clear please let me know!

Pivot High/Low [s3]This is a technical analysis tool that identifies significant price pivot points (highs and lows) in the market. It looks for both major and minor pivot points, which can help traders identify potential support and resistance levels, trend reversals, and breakout opportunities.
How Pivot Points Are Calculated:
The indicator uses a straightforward "higher than everything around it" or "lower than everything around it" approach:
For Pivot Highs:
- The indicator looks at a specific bar and compares it to bars before and after it
- For a major pivot high: It checks 50 bars to the left and 20 bars to the right
- If the bar's high price is higher than ALL bars within this range, it's marked as a pivot high
- Think of it like a mountain peak - it needs to be the highest point compared to everything around it
For Pivot Lows:
- Same concept but reversed - looking for valleys instead of peaks
- Checks the same ranges (50 left, 20 right)
- The bar's low price must be lower than ALL surrounding bars
- Like finding the bottom of a valley - it needs to be the lowest point in the area
Key Features:
1. Two types of pivot points:
- Major pivots (using longer lookback periods of 50 bars left, 20 bars right)
- Minor pivots (using half the lookback periods - 25 left, 10 right)
2. Visual elements:
- Triangle markers above/below bars for pivot points
- Dotted lines extending from pivot points
- Color coding: Green for lows (support), Red for highs (resistance)
- Major pivots are more prominent than minor pivots
3. Customizable alerts for:
- Formation of new pivot points
- Breakouts above/below pivot levels
Trading Applications:
1. Support and Resistance:
- Major pivot levels act as strong support (lows) and resistance (highs)
- Multiple touches of these levels increase their significance
- Minor pivots can indicate intermediate support/resistance levels
2. Trend Analysis:
- Higher highs and higher lows = Uptrend
- Lower highs and lower lows = Downtrend
- Breaking of major pivot levels can signal trend changes
3. Entry/Exit Signals:
- Long entries: When price bounces off major pivot lows
- Short entries: When price rejects from major pivot highs
- Take profits: At opposite pivot levels
- Stop losses: Just beyond the entry pivot level
4. Breakout Trading:
- Breaking above major pivot highs suggests bullish momentum
- Breaking below major pivot lows suggests bearish momentum
- Use the alert system to catch breakouts early
Settings Customization:
- Adjust lookback periods based on your timeframe
- Toggle visibility of markers and lines
- Customize colors for better visibility
- Enable/disable specific types of alerts
Risk Management Tips:
1. Don't rely solely on pivot points - combine with other indicators
2. Wait for confirmation of bounces/rejections before entering trades
3. Use proper position sizing based on stop loss placement
4. Consider market context and overall trend when trading pivot levels
This indicator is particularly useful for swing traders and position traders who focus on key market turning points and trend changes. It helps identify significant price levels where the market has previously shown reaction, making it valuable for both trend following and counter-trend strategies.

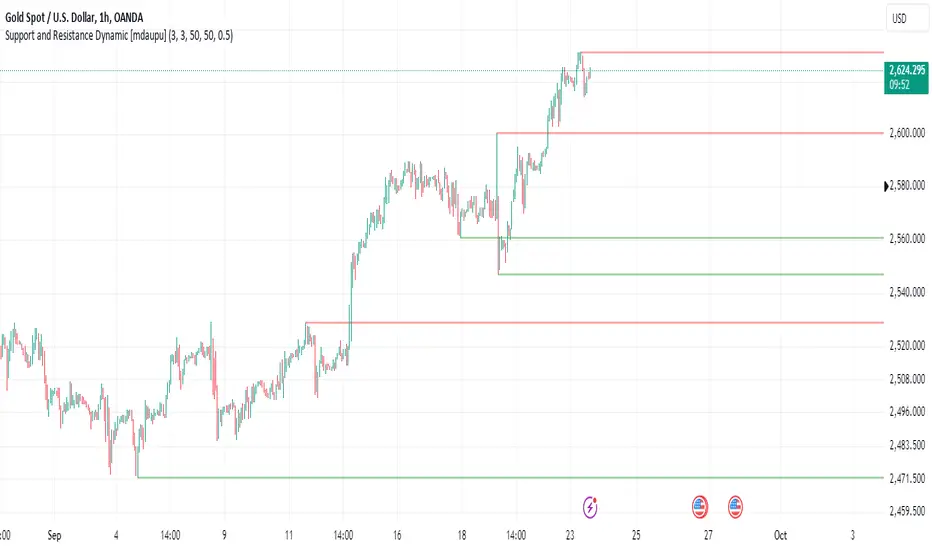
Support and Resistance DynamicThis indicator is designed to plot horizontal lines on significant Support and Resistance based on custom user-defined lookback periods. It helps traders identify key levels of support and resistance, improving their ability to detect potential trend reversals or breakout zones.
Key Features:
1. Custom Number of Support and Resistance Lines:
- The script allows users to independently control the number of horizontal lines for Support and Resistance, helping to focus on the most important levels.
2. Adjustable Lookback Period
- Customize the lookback periods for detecting support and resistance, giving you the flexibility to capture different swing points in various market conditions.
3. Minimum Difference Filter:
- The script includes a customizable minimum difference percentage filter to ensure only significant pivots are plotted, avoiding clutter and focusing on more meaningful levels.
4. Automatic Line Extension:
- Pivot high and low lines automatically extend to the right, clearly marking key levels until they are broken or surpassed by price action.
This tool is ideal for technical traders who rely on support and resistance zones for making trading decisions. Whether you are swing trading, day trading, or scalping, these key levels can help enhance your chart analysis.
How to Use:
- Customize the number of support and resistance lines to suit your strategy.
- Adjust the lookback settings to match your timeframe or market conditions.
- Fine-tune the minimum difference percentage to filter out noise and focus on stronger support and resistance.
This script provides a dynamic and customizable way to visualize support and resistance, helping you spot key turning points and make informed trading decisions.
Ultra Key LevelsThe "Ultra Key Levels" indicator is a powerful tool designed for traders who seek to identify critical price levels in the market. This Pine Script™ indicator is optimized to plot significant pivot highs and lows directly on your chart, providing a clear visual representation of potential support and resistance zones.
Pivot Detection: Automatically identifies and marks pivot highs and lows using customizable parameters. Traders can fine-tune the length of the pivots, allowing for precise detection of significant price points.
Dynamic Boxes: The indicator draws dynamic boxes around each identified pivot high and low, highlighting key levels. These boxes are adjusted based on the Average True Range (ATR), ensuring they reflect the current market volatility.
Pivot Highs/Lows: Control the appearance and behavior of pivot points with options to adjust source data, length, transparency, and the maximum number of pivots displayed on the chart.
ATR Multiplier: Set the ATR multiplier to determine the size of the boxes around pivot points, helping you assess the strength of each level.
Debug Mode: Activate debug mode to visualize pivot points and fine-tune your settings for optimal performance.
Scalability: Supports up to 500 boxes, making it suitable for both short-term and long-term traders who need to track multiple levels across different timeframes.
The "Ultra Key Levels" indicator is ideal for traders who rely on technical analysis to make informed decisions. By automatically identifying and highlighting key price levels, this tool helps you anticipate potential market movements and optimize your trading strategy.

Price Close ProbabilityThe Price Close Probability Indicator is designed to help traders estimate the likelihood of price closing above or below specified levels within a given bar. By placing two levels on your chart, you can quickly gauge the probability of the current price bar closing above or below these levels in real-time.
Key Features:
Dynamic Probability Calculation: The indicator continuously updates the probability of price closing above or below your set levels as the current bar progresses, providing you with timely insights as the bar approaches its close.
Customizable Standard Deviation : Adjust the length of the Standard Deviation used in the calculations to tailor the probability estimates to your preferred settings.
User-Friendly Probability Table : A clean, easy-to-read table displays the calculated probabilities, helping you make informed trading decisions at a glance.
Assumptions and Considerations:
While the indicator assumes that returns are normally distributed, which may not fully reflect reality, it still offers a valuable approximation of the probabilities for price movement within the current bar.
Future Enhancements (Coming Soon):
Multi-Bar Probability: Calculate probabilities across multiple bars to enhance your forecasting capabilities.
Additional Levels: Set more than two levels for a broader analysis of price movements.
Refined Distribution Modeling: Improve the accuracy of probability calculations by adjusting for more realistic return distributions.
Disclaimer
Please remember that past performance may not be indicative of future results.
Due to various factors, including changing market conditions, the strategy may no longer perform as well as in historical backtesting.
This post and the script don’t provide any financial advice.

SPX Mapped Gaps [Mxwll]Hello traders 👋
This indicator "SPX Mapped Gaps" detects gaps from the SPX (or the trader's choice of index/asset) and plots them for the asset on your chart!
Features
Selectable comparison symbol
Gaps from the selected symbol (SPX by default) are plotted for the asset on your chart - serving as potential support/resistance levels!
Closest gaps from comparison symbol displayed in upper-right table
Overlapped gaps deleted automatically - less clutter!
How this script works
The "SPX Mapped Gaps" is designed to help traders determine price levels for the asset on their chart where a major index (any asset) gapped up or down.
Of course, a gap that occurs on SPX (4-digit price) is incompatible with the price chart of BTC (5-digit price). To circumvent this, the percentage distance of the gap from SPX is determined, and a gap level is drawn equidistantly (up/down) from the open price of the asset on your chart. With this method, the proportion of the gap is maintained at the price area it occurred for the asset on your chart!
The image above outlines functionality for the indicator!
Key points:
Up gaps are denoted by green boxes
Down gaps are denoted by red boxes
All gaps are listed with their start and end price for the comparison asset (SPX for the example). These labels can be hidden at the user's discretion.
Gaps are expected to act as support/resistance during their lifetime
The image above explains the output of the script, including line style indications!
Solid lines indicate that the leverage used for at your entry price constitutes an active trade. Dotted lines mean the trade has already achieved your profit target for that leverage, or stopped out.
The image above explains the table attached to the indicator!
This table displays the closest gaps to the current asset price. The status (up gap or down gap) from the gap to the current price is also detailed.
Why are gaps on the SPX, or major index, relevant to BTC and other assets?
When a gap on the major indices occurs, it's expected that strong aggregate buying or selling pressure will transpire for BTC and other coins. Due to this, the presence of a gap on a major index might correspond to increased activity on smaller market-cap assets with some degree of positive correlation to the index. Consequently, the price level for the asset at which a gap for the major index occurred may function as support/resistance for future price!
That is all for this - thanks traders!

Support and Resistance [CryptoSea]The Support and Resistance Indicator is a powerful tool developed by CryptoSea for traders seeking to identify key market levels with precision. This script leverages advanced pivot and volume analysis to highlight support and resistance zones on the price chart.
Key Features
Multi-Source Pivot Analysis: Choose between wicks or body prices for calculating pivot points, providing flexibility in market analysis.
Volume Spike Detection: Automatically identifies volume spikes using a customizable threshold multiplier, enhancing the accuracy of support and resistance levels.
Dynamic Box Display: Configurable options for extending and graying out boxes based on price interaction, ensuring a clear visual representation of active and invalidated zones.
In the example below, we see a resistance box formed based on wick highs and a volume spike. The box extends to where we see price rejecting from it. In the settings you can change this so the box will stop if price touches it if you prefer.
How it Works
Pivot Point Calculation: The script determines pivot highs and lows using either wicks or body prices over a specified term (Short, Medium, Long), corresponding to 5, 15, or 30 bars.
Volume Analysis: Calculates average volume over twice the pivot length and identifies volume spikes exceeding the user-defined threshold, crucial for confirming support and resistance levels.
Box Management: Maintains arrays of support and resistance boxes, limiting the number based on user settings (All, Recent Few, Recent Several).
Settings Explained
Source: Choose between 'Wicks' or 'Bodies' to determine whether pivot points are calculated using candle wicks or body prices.
Pivot Term: Select 'Short' (5 bars), 'Medium' (15 bars), or 'Long' (30 bars) to adjust the distance for pivot calculation. Longer terms take more bars to confirm support/resistance.
Volume Threshold (multiplier): Set a multiplier of average volume to detect volume spikes, essential for validating support/resistance levels.
Extend Until Price Hits: Enable this to extend support/resistance boxes until the price touches them, providing dynamic levels.
Gray Out Boxes Once Hit: Enable this to gray out the boxes once the price interacts with them, indicating that they are no longer active.
Max Boxes Displayed: Choose 'All', 'Recent Few' (up to 3 boxes each for bull and bear), or 'Recent Several' (up to 10 boxes each for bull and bear) to control the number of visible boxes.
Invalidate Condition: Select 'Touch' to invalidate a box when the price touches it or 'Through' to invalidate when the price passes entirely through the box.
Candle Colors: Option to color candles based on neutral, bullish, or bearish conditions for easier visual analysis.
Application
Strategic Planning: Assists traders in pinpointing potential entry and exit points by marking significant support and resistance zones.
Trend Confirmation: Validates trend strength and potential reversals with volume-based analysis of support and resistance levels.
Customizable Settings: Tailors analysis to various trading strategies with extensive input settings for pivot source, term, volume threshold, and display preferences.
The Support and Resistance Indicator by is an essential addition to any trader’s toolkit, offering robust and customizable market level analysis for improved trading decisions.

Liquidations [ChartPrime]Liquidations Indicator:
The Liquidations indicator is a powerful tool designed to help traders identify significant liquidation levels in financial markets. By analyzing volume data over a specified lookback period, the indicator highlights potential areas where market participants with high leverage positions may face liquidation, providing valuable insights into market dynamics.
Usage:
Traders can use the Liquidations indicator to:
◈ Identify liquidity grab opportunities: Liquidation levels often attract price action as market participants with leveraged positions face the risk of forced liquidation. Traders can anticipate price movements as the market aims to trigger these stops, potentially leading to rapid price movements or reversals.
◈ Confirm trend strength: A cluster of liquidation levels in the same direction as the prevailing trend may confirm the strength of the trend, while divergences between liquidation levels and price movements may signal potential trend reversals.
Settings:
◈ Previous Value Bars Back: Specifies the number of previous bars used in calculating the liquidation levels.
◈ Show Leverage: Allows users to selectively display liquidation levels for different leverage multiples, including 5x, 10x, 25x, 50x, and 100x.
◈ Liquidation Levels Width: Sets the width of the lines representing liquidation levels on the chart.
◈ Short Liquidations Color: Specifies the color of the lines representing short liquidation levels.
◈ Long Liquidations Color: Specifies the color of the lines representing long liquidation levels.
◈ Bar Color: Sets the color of the background bar when the indicator is active.
Visual Representation:
◈ Liquidation levels are plotted as horizontal lines on the chart, with different colors representing short and long liquidation levels.
◈ Each liquidation level is labeled with the corresponding leverage multiple (e.g., 5x, 10x, etc.).
A dashboard displays the active liquidation levels for each leverage multiple, allowing traders to quickly assess the current market conditions.
◈ Time Window allows users to cut off unnecessary part of the chart and concentrate on a current active part of the chart to make better trading decisions:
Interpretation:
Market participants tend to place stop-loss orders near liquidation levels , creating clusters of pending orders. As price approaches these levels, it may trigger a cascade of stop-loss orders, providing liquidity for market orders and potentially leading to rapid price movements in the opposite direction.
Traders can anticipate price reversals or accelerations as price interacts with liquidation levels, using them as reference points for identifying potential entry or exit opportunities.
Note:
While the Liquidations indicator provides valuable insights into market dynamics, traders should use it in conjunction with other technical analysis tools and risk management strategies to make informed trading decisions.

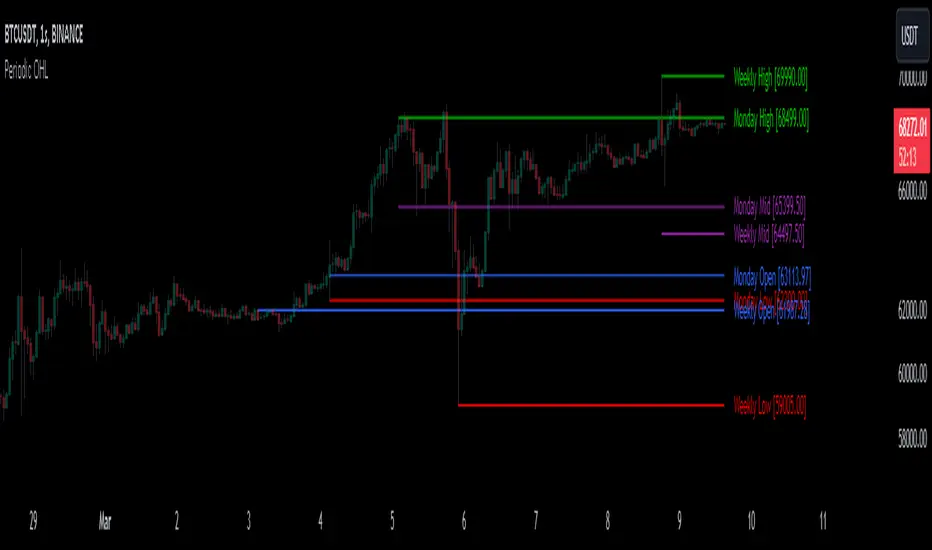
Periodic OHLHere is another experience on working with 'time' variable :)
This script generates potential support and resistance levels based on daily, weekly, and monthly open, high, and low prices. In such indicators, security calls produce effective results. However, similar tasks can also be performed by built-in variables. This script serves as an example of how alternative methods can be constructed.
The originality of the indicator is based on its ability to visualise the current open, high and low prices from the bar at which they occur. You can also display levels simultaneously.
I hope it helps everyone...
DISCLAIMER
This is just an indicator, nothing more. It is provided for informational and educational purposes exclusively. The utilization of this script does not constitute professional or financial advice. The user solely bears the responsibility for risks associated with script usage. Do not forget to manage your risk. And trade as safely as possible. Best of luck!
Adaptive MFT Extremum Pivots [Elysian_Mind]Adaptive MFT Extremum Pivots
Overview:
The Adaptive MFT Extremum Pivots indicator, developed by Elysian_Mind, is a powerful Pine Script tool that dynamically displays key market levels, including Monthly Highs/Lows, Weekly Extremums, Pivot Points, and dynamic Resistances/Supports. The term "dynamic" emphasizes the adaptive nature of the calculated levels, ensuring they reflect real-time market conditions. I thank Zandalin for the excellent table design.
---
Chart Explanation:
The table, a visual output of the script, is conveniently positioned in the bottom right corner of the screen, showcasing the indicator's dynamic results. The configuration block, elucidated in the documentation, empowers users to customize the display position. The default placement is at the bottom right, exemplified in the accompanying chart.
The deliberate design ensures that the table does not obscure the candlesticks, with traders commonly situating it outside the candle area. However, the flexibility exists to overlay the table onto the candles. Thanks to transparent cells, the underlying chart remains visible even with the table displayed atop.
In the initial column of the table, users will find labels for the monthly high and low, accompanied by their respective numerical values. The default precision for these values is set at #.###, yet this can be adjusted within the configuration block to suit markets with varying degrees of volatility.
Mirroring this layout, the last column of the table presents the weekly high and low data. This arrangement is part of the upper half of the table. Transitioning to the lower half, users encounter the resistance levels in the first column and the support levels in the last column.
At the center of the table, prominently displayed, is the monthly pivot point. For a comprehensive understanding of the calculations governing these values, users can refer to the documentation. Importantly, users retain the freedom to modify these mathematical calculations, with the table seamlessly updating to reflect any adjustments made.
Noteworthy is the table's persistence; it continues to display reliably even if users choose to customize the mathematical calculations, providing a consistent and adaptable tool for informed decision-making in trading.
This detailed breakdown offers traders a clear guide to interpreting the information presented by the table, ensuring optimal use and understanding of the Adaptive MFT Extremum Pivots indicator.
---
Usage:
Table Layout:
The table is a crucial component of this indicator, providing a structured representation of various market levels. Color-coded cells enhance readability, with blue indicating key levels and a semi-transparent background to maintain chart visibility.
1. Utilizing a Table for Enhanced Visibility:
In presenting this wealth of information, the indicator employs a table format beneath the chart. The use of a table is deliberate and offers several advantages:
2. Structured Organization:
The table organizes the diverse data into a structured format, enhancing clarity and making it easier for traders to locate specific information.
3. Concise Presentation:
A table allows for the concise presentation of multiple data points without cluttering the main chart. Traders can quickly reference key levels without distraction.
4. Dynamic Visibility:
As the market dynamically evolves, the table seamlessly updates in real-time, ensuring that the most relevant information is readily visible without obstructing the candlestick chart.
5. Color Coding for Readability:
Color-coded cells in the table not only add visual appeal but also serve a functional purpose by improving readability. Key levels are easily distinguishable, contributing to efficient analysis.
Data Values:
Numerical values for each level are displayed in their respective cells, with precision defined by the iPrecision configuration parameter.
Configuration:
// User configuration: You can modify this part without code understanding
// Table location configuration
// Position: Table
const string iPosition = position.bottom_right
// Width: Table borders
const int iBorderWidth = 1
// Color configuration
// Color: Borders
const color iBorderColor = color.new(color.white, 75)
// Color: Table background
const color iTableColor = color.new(#2B2A29, 25)
// Color: Title cell background
const color iTitleCellColor = color.new(#171F54, 0)
// Color: Characters
const color iCharColor = color.white
// Color: Data cell background
const color iDataCellColor = color.new(#25456E, 0)
// Precision: Numerical data
const int iPrecision = 3
// End of configuration
The code includes a configuration block where users can customize the following parameters:
Precision of Numerical Table Data (iPrecision):
// Precision: Numerical data
const int iPrecision = 3
This parameter (iPrecision) sets the precision of the numerical values displayed in the table. The default value is 3, displaying numbers in #.### format.
Position of the Table (iPosition):
// Position: Table
const string iPosition = position.bottom_right
This parameter (iPosition) sets the position of the table on the chart. The default is position.bottom_right.
Color preferences
Table borders (iBorderColor):
// Color: Borders
const color iBorderColor = color.new(color.white, 75)
This parameters (iBorderColor) sets the color of the borders everywhere within the window.
Table Background (iTableColor):
// Color: Table background
const color iTableColor = color.new(#2B2A29, 25)
This is the background color of the table. If you've got cells without custom background color, this color will be their background.
Title Cell Background (iTitleCellColor):
// Color: Title cell background
const color iTitleCellColor = color.new(#171F54, 0)
This is the background color the title cells. You can set the background of data cells and text color elsewhere.
Text (iCharColor):
// Color: Characters
const color iCharColor = color.white
This is the color of the text - titles and data - within the table window. If you change any of the background colors, you might want to change this parameter to ensure visibility.
Data Cell Background: (iDataCellColor):
// Color: Data cell background
const color iDataCellColor = color.new(#25456E, 0)
The data cells have a background color to differ from title cells. You can configure this is a different parameter (iDataColor). You might even set the same color for data as for the titles if you will.
---
Mathematical Background:
Monthly and Weekly Extremums:
The indicator calculates the High (H) and Low (L) of the previous month and week, ensuring accurate representation of these key levels.
Standard Monthly Pivot Point:
The standard pivot point is determined based on the previous month's data using the formula:
PivotPoint = (PrevMonthHigh + PrevMonthLow + Close ) / 3
Monthly Pivot Points (R1, R2, R3, S1, S2, S3):
Additional pivot points are calculated for Resistances (R) and Supports (S) using the monthly data:
R1 = 2 * PivotPoint - PrevMonthLow
S1 = 2 * PivotPoint - PrevMonthHigh
R2 = PivotPoint + (PrevMonthHigh - PrevMonthLow)
S2 = PivotPoint - (PrevMonthHigh - PrevMonthLow)
R3 = PrevMonthHigh + 2 * (PivotPoint - PrevMonthLow)
S3 = PrevMonthLow - 2 * (PrevMonthHigh - PivotPoint)
---
Code Explanation and Interpretation:
The table displayed beneath the chart provides the following information:
Monthly Extremums:
(H) High of the previous month
(L) Low of the previous month
// Function to get the high and low of the previous month
getPrevMonthHighLow() =>
var float prevMonthHigh = na
var float prevMonthLow = na
monthChanged = month(time) != month(time )
if (monthChanged)
prevMonthHigh := high
prevMonthLow := low
Weekly Extremums:
(H) High of the previous week
(L) Low of the previous week
// Function to get the high and low of the previous week
getPrevWeekHighLow() =>
var float prevWeekHigh = na
var float prevWeekLow = na
weekChanged = weekofyear(time) != weekofyear(time )
if (weekChanged)
prevWeekHigh := high
prevWeekLow := low
Monthly Pivots:
Pivot: Standard pivot point based on the previous month's data
// Function to calculate the standard pivot point based on the previous month's data
getStandardPivotPoint() =>
= getPrevMonthHighLow()
pivotPoint = (prevMonthHigh + prevMonthLow + close ) / 3
Resistances:
R3, R2, R1: Monthly resistance levels
// Function to calculate additional pivot points based on the monthly data
getMonthlyPivotPoints() =>
= getPrevMonthHighLow()
pivotPoint = (prevMonthHigh + prevMonthLow + close ) / 3
r1 = (2 * pivotPoint) - prevMonthLow
s1 = (2 * pivotPoint) - prevMonthHigh
r2 = pivotPoint + (prevMonthHigh - prevMonthLow)
s2 = pivotPoint - (prevMonthHigh - prevMonthLow)
r3 = prevMonthHigh + 2 * (pivotPoint - prevMonthLow)
s3 = prevMonthLow - 2 * (prevMonthHigh - pivotPoint)
Initializing and Populating the Table:
The myTable variable initializes the table with a blue background, and subsequent table.cell functions populate the table with headers and data.
// Initialize the table with adjusted bgcolor
var myTable = table.new(position = iPosition, columns = 5, rows = 10, bgcolor = color.new(color.blue, 90), border_width = 1, border_color = color.new(color.blue, 70))
Dynamic Data Population:
Data is dynamically populated in the table using the calculated values for Monthly Extremums, Weekly Extremums, Monthly Pivot Points, Resistances, and Supports.
// Add rows dynamically with data
= getPrevMonthHighLow()
= getPrevWeekHighLow()
= getMonthlyPivotPoints()
---
Conclusion:
The Adaptive MFT Extremum Pivots indicator offers traders a detailed and clear representation of critical market levels, empowering them to make informed decisions. However, users should carefully analyze the market and consider their individual risk tolerance before making any trading decisions. The indicator's disclaimer emphasizes that it is not investment advice, and the author and script provider are not responsible for any financial losses incurred.
---
Disclaimer:
This indicator is not investment advice. Trading decisions should be made based on a careful analysis of the market and individual risk tolerance. The author and script provider are not responsible for any financial losses incurred.
Kind regards,
Ely

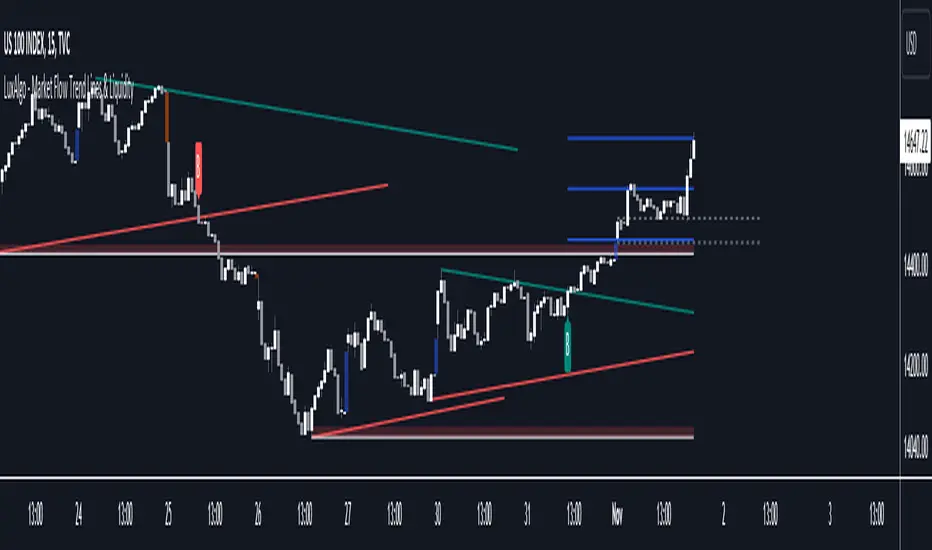
Market Flow Trend Lines & Liquidity [LuxAlgo]The Market Flow Trend Lines & Liquidity indicator is a script that aims to automate key insights such as trend lines, liquidity zones, opening ranges, & gaps on the chart. The aim of this script is to provide a functional breakout trader toolkit with various familiar tools as well as unique capabilities to further improve the user experience.
🔶 USAGE
There are various methods for using the features within this script, even with the included take profit levels users can pre-define.
The dotted lines represent an Opening Range with levels we can use as support & resistance. This opening range can be traded within the levels; however, it can also be used to tell the sentiment of price to see how it reacts to it.
In the image below, we can see after price was holding above the Opening Range whilst printing bullish trendline breakout signals, it made its way to the TP level we enabled from within the indicator to calculate a potential level for taking profits in a breakout trade.
The Market Flow Trend Lines & Liquidity indicator's key feature reside within its multi-timeframe capabilities for the main trendlines, as well as its key zones for potential entries.
In the image above we can see multiple areas where multi-timeframe (1H) trendlines on the 30m chart acted as support & resistance, alongside the Liquidity Zones & Opening Range as optimal points of interest for a breakout trader.
🔶 SETTINGS
🔹 Trendlines
Trendlines Lookback: Determines the frequency of detected tops/bottoms used to construct trendlines.
Slope: Trendlines slope, with higher values returning steeper trendlines.
Timeframe: Trendline timeframe.
🔹 Liquidity Zones
Liquidity Lookback: Determines the frequency of detected tops/bottoms used to construct liquidity zones.
🔹 Take Profits
Take profit settings. Up to 3 ATR based take profits can be enabled, with a numerical setting controlling the ATR multiplier.
🔹 Opening Range
From Time: 15min opening range starting time.
Extend: Extension length of Opening Range lines (in bars).
🔹 Gap Imbalance
Gap Up: Display upward gaps.
Gap Down: Display downward gaps.
🔹 EMA
Show EMA: Displays an EMA on the chart.
EMA Length: Length of the displayed EMA.
🔶 RELATED SCRIPTS
Liquidity Swings
Trendlines with Breaks
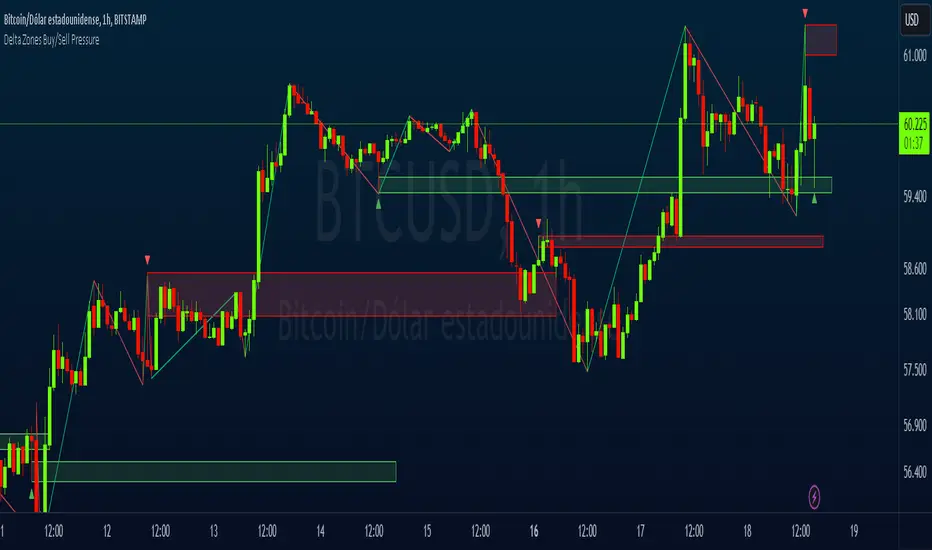
Delta Zones Buy/Sell PressureScript Description:
Delta Zones Buy/Sell Pressure Indicator
Description:
The "Delta Zones Buy/Sell Pressure" indicator, created by the original author "scarf", is a technical tool that unveils key areas of buying and selling pressure in the market. This indicator utilizes the concept of Delta, calculating differences between open, close, high, and low prices. When these differences exceed a threshold determined by the user-defined standard deviation, areas of intense buying (indicated by green boxes) and selling pressure (indicated by red boxes) on the chart are identified.
How It Works:
The indicator calculates Delta using various combinations of candle prices to determine buying and selling pressure. When Delta surpasses a certain level, indicated by the user-defined standard deviation, visual signals in the form of boxes on the chart are generated. These boxes highlight specific areas where buying or selling pressure is particularly strong, aiding traders in identifying potential entry and exit points in the market.
How to Use:
* When a green box is drawn, it indicates strong buying pressure in the market. This can be interpreted as a signal to consider long positions.
* When a red box is drawn, it indicates strong selling pressure in the market. This can be interpreted as a signal to consider short positions.
* Use these signals in combination with your own analysis and risk management strategies to make informed trading decisions.
Originality:
What makes this indicator original is its unique approach to identifying specific areas of buying and selling pressure. By calculating Delta in multiple ways and utilizing standard deviation as a filter, this indicator provides clear and concise visual signals about market activity. The combination of these features distinguishes it as a valuable tool for traders seeking a better understanding of market behavior. This modification differs from the original by displaying the information on the price chart with horizontal bars, below each delta, instead of an oscillator at the bottom similar to the volume indicator.
Final Recommendations:
Consider Market Trends:
Before making any trading decisions using the Delta Zones Buy/Sell Pressure Indicator, it is crucial to analyze the prevailing market trends. Assess the overall direction of the market, whether it's trending upward, downward, or moving sideways. Align your trades with the dominant trend to increase the probability of successful outcomes. The indicator's signals can be more reliable when they align with the broader market trend.
Evaluate Macro-Economic Factors:
Additionally, take into account macro-economic factors that could influence price movements. Factors such as economic indicators, geopolitical events, interest rate decisions, and global market sentiments can significantly impact the financial markets. Stay updated with relevant news and economic reports to anticipate potential market shifts. Understanding the broader economic context can help you interpret the indicator's signals within a more informed framework.
Practice Risk Management:
Regardless of the signals provided by the Delta Zones Buy/Sell Pressure Indicator, always implement effective risk management strategies. This includes setting stop-loss orders, diversifying your portfolio, and only risking a small percentage of your trading capital on each trade. By managing your risk, you can protect your investments and ensure longevity in the market, even during volatile periods.
Continuous Learning and Adaptation:
Financial markets are dynamic and constantly evolving. Continuously educate yourself about new trading strategies, technical analysis tools, and economic developments. Stay open to adapting your trading approach based on changing market conditions. Regularly reviewing your trading strategy and adjusting it according to your experiences and market feedback can significantly enhance your trading performance over the long term.
Seek Professional Advice if Necessary:
If you are uncertain about specific market trends, indicators, or economic factors, don't hesitate to seek guidance from financial advisors or professionals. Their expertise can provide valuable insights and help you make well-informed decisions, especially in complex or uncertain market environments.
By incorporating these recommendations into your trading approach, you can enhance your decision-making process, mitigate risks, and increase your overall chances of successful trading outcomes. Remember, the key to successful trading lies not only in the tools you use but also in your ability to interpret them within the broader market context.
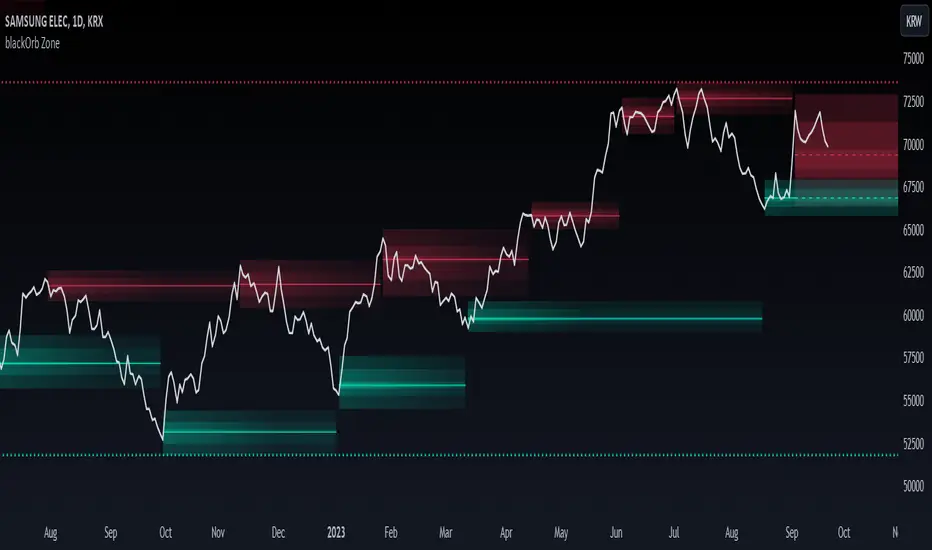
blackOrb ZoneBuying near the bottom and selling near the peak can be a challenging trading approach. However, it all begins with the ability to identify these essential zones. This indicator is targeting support and resistance with heightened accuracy. It utilizes features like:
I. Multi-Level Weighting for Enhanced Support and Resistance Zones
II. Vertical Zone Range Adjustment for Enhanced Price Level Identification
III. High-Time Frame for Solid Macro Validation
IV. Projection Function for Informed Trade Management
V. Automatic Level Identification for Pinpointing Potential Order Positions
VI. Customizable Pivot Analysis for Accurate Zone Identifications
Technical Methodology
I. Multi-Level Weighting for Enhanced Support and Resistance Zones
Support and resistance are more accurately represented as wider zones rather than singular lines. In practical application, relevant support or resistance levels often converge around a central mean-weighted level within a zone.
This indicator visually represents these zones by calculating values from open, high, low, and close prices, accentuating them through varying opacities. Higher opacity within an area indicates a higher likelihood of it serving as a relevant support or resistance level.
Multiple mean options within the settings menu encompass weighted average calculations that utilize different combinations of price data within the relevant pivot analysis phase. This versatility allows users to target pertinent levels within a zone. For instance, when employing hlcc4 price data, the calculation is as follows:
mean_price_hlcc4 = (high + low + close + close) / 4
II. Vertical Zone Range Adjustment for Enhanced Price Level Identification
This feature enables users to precisely adjust the vertical zone range for price references within potential support or resistance phases. For instance, decreasing the reference setting results in a more granular validation within a narrower range. This creates vertically thinner zones with increased price level precision, although it may offer a less comprehensive perspective.
III. High-Time Frame for Solid Macro Validation
The indicator enhances pivot points, potentially in conjunction with high-time frame validation, to identify significant price zones with heightened confirmation strength driven by volume. Higher time frames provide more extensive volume verification, for instance, comparing the 4-hour to the 24-hour timeframe (a multiple of six).
This feature involves cross-referencing data from higher time frames, heightening the reliability of support and resistance zones and providing valuable insights into potential trading interest levels.
Technically, the indicator applies the identical rigorous analysis to both lower and higher time frames. This approach facilitates a more comprehensive perspective and aids in the clearer identification of overarching macro support and resistance levels, even when focusing on smaller timeframes. For instance, a potential support zone identified on the daily time frame can gain higher confidence when confirmed on a weekly chart.
IV. Projection Function for Informed Trade Management
The projection function visually extends the most recent analysis of support and resistance zones forward, in accordance with the user's configured parameters.
By displaying precise price values at these visualized support and resistance levels, this indicator offers valuable assistance in decision-making, particularly when planning real-time orders or when engaged in an active trade management phase (e.g., for the purpose of adjusting stop-loss levels post-entry).
Note: This function is based on historical data. It may not account for unforeseen market events. It's important to complement this feature with ongoing analysis of real-time market data.
V. Automatic Level Identification for Pinpointing Potential Order Positions
It is empirically observed that traders frequently position orders at price levels that conform to quantized values due to cognitive biases.*
Consequently, blackOrb Zone not only facilitates the identification of pertinent levels within a weighted zone but also features an "auto" functionality designed to analyze price dynamics in the proximity of these relevant levels. The objective is to identify discrete values in close vicinity, which exhibit a higher likelihood of serving as authentic support and resistance zones.
This processing approach assists traders in precisely locating the central mean-weighted level within a given zone and identifies proximate quantized levels.
Note: This method becomes especially relevant during phases of price retesting, where market participants converge, contributing to a further refinement of levels, indicative of an asymmetric balance between supply and demand.
*Source: Prof. Mitchell, Jason. "Clustering and Psychological Barriers: The Importance of Numbers." Journal of Futures Markets, vol. 21, no. 5, 2001, pp. 395-428.
VI. Customizable Pivot Analysis for Accurate Zone Identifications
The indicator employs pivot points to pinpoint key price zones where price dynamics could encounter buying or selling pressure.
Essential components of this method involve comparing time units both to the left and right within a designated phase of support or resistance, effectively defining the search range for pivotal points.
For instance, in the analysis below, the search is for the highest price point that hasn't been surpassed within a certain resistance zone in the last 10 time units to the left and 10 time units to the right:
ta.pivothigh(10, 10)
Potential Trade Management Applications of blackOrb Zone
- Reversal Trading : Robust support zones with bullish signals can indicate opportune moments for buying or long position entries, whereas confirmed resistance zones can be identified for selling or short position entries.
- Breakout Trading : Anticipating price surges as price breach support or resistance level. A resistance breakout can signal a bullish price dynamic, while a support breakdown may suggest a bearish price dynamic.
- Range Trading : In lateral sideways markets, users can capitalize on support zones for buying and resistance zones for selling, profiting from price fluctuations.
- Take-Profit Management : For buying or long positions, resistance zones can be identified to determine suitable take-profit levels either within or near these zones - for short positions, vice versa with support zones.
- Stop-Loss Management : For buying or long positions, support zones can be identified to determine appropriate stop-loss levels beneath these zones - for short positions, vice versa with resistance zones to determine stop-loss levels above these zones.
Note on Usability
blackOrb Zone can have synergies with blackOrb Price as both indicators combined can give a bigger picture for supporting comprehensive and multifaceted data-driven trading analysis.
This tool was meticulously created to serve as an additional frame for the seamless integration of other more granular trading indicators. This indicator isn't intended for standalone trading application. Instead, it is serving as a supplementary tool for orientation within broader trading strategies.
Irrespective of market conditions, it can harmonize with a wider range of trading styles and instruments / trading pairs / indices like Stocks, Gold, FX, EURUSD, SPX500, GBPUSD, BTCUSD and Oil.
Inspiration and Publishing
Taking genesis from the inspirations amongst others provided by TradingView Pine Script Wizard Kodify, blackOrb Zone is a multi-encompassing script meticulously forged from scratch. It aspires to furnish a comprehensive approach, borne out of personal experiences and a strong dedication in supporting the trading community. We eagerly await valuable feedback to refine and further enhance this tool.
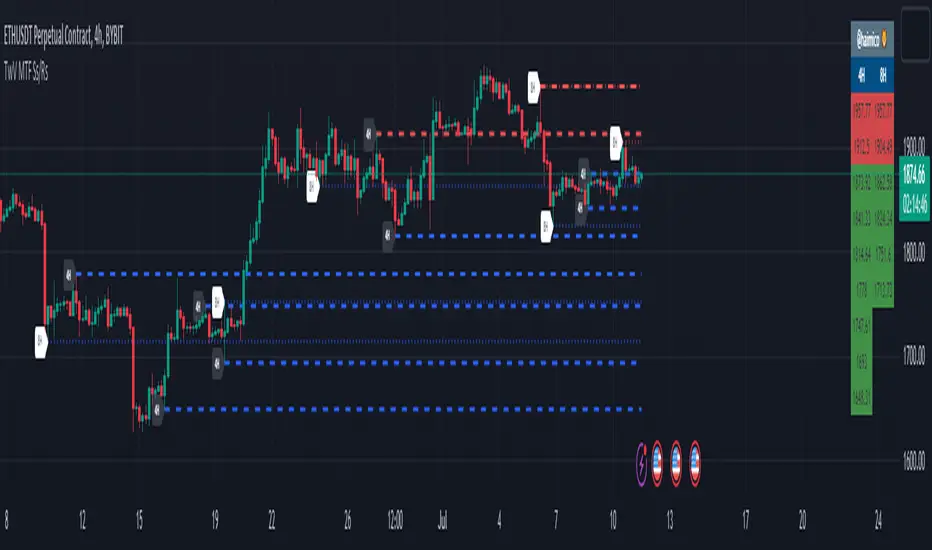
TwV Dynamic Multi-Timeframe Supports and ResistancesDynamic Multi-timeframe Supports and Resistances
This indicator is designed to be able to get used in combination with others that can lead to a potential help for trading.
The indicator uses colors such us light blue, dark blue, light red and dark red. Light blue and light red to indicate whether we are looking at a support or resistance for the multi-timeframe and dark blue and dark red to indicate whether we are looking at a support or resistance for the current chart’s timeframe.
The indicator is multi-timeframe because the trader can configure within the menu a background timeframe, which plots new supports and resistances according to the timeframe selected. Therefore, traders can use daily or 4H supports and resistances in a 1H graph or lower. (Just as an example)
The Supports' and Resistances' for the different timeframes are clearly identified with a label at the specific candle where they are coming from.
Most Supports & Resistances indicators need to be adjusted to a FIXED LOOKBACK PERIOD , I made an improvement and different by giving the indicator the ability to identify the bars that are being LOOK AT IN THE SCREEN , this really gives traders the possibility and agility to identify potential support and resistance areas without the need to be changing any settings on the indicator. Just change the Fixed/Dynamic setting indicator to start using this great functionality.
Fundamentals
Support and resistance are two foundational concepts in technical analysis. Understanding what these terms mean and their practical application is essential to correctly reading price charts.
Prices move because of supply and demand. When demand is greater than supply, prices rise. When supply is greater than demand, prices fall. Sometimes, prices will move sideways as both supply and demand are in equilibrium.
Like many concepts in technical analysis, the explanation and rationale behind technical concepts are relatively easy, but mastery in their application often takes years of practice.
Technical analysts use support and resistance levels to identify price points on a chart where the probabilities favor a pause or reversal of a prevailing trend.
Support occurs where a downtrend is expected to pause due to a concentration of demand.
Resistance occurs where an uptrend is expected to pause temporarily, due to a concentration of supply.
Support and resistance areas can be identified on charts using trendlines and moving averages.
Summary Panel
This panel allows the trader to have a summary of the values of the supports and resistances. It has the following characteristics:
Can be placed anywhere in the chart.
Its size can be modified to fit any type of screens including mobile
The summary box the high and low prices for the supports and resistances.
Script’s Basics
The idea behind the script is to find out Long-term levels are used to help predict large price reversals marking the start and completion of price movements on longer timelines such as the daily or weekly charts, to achieve this the script uses K-Means clustering to identify long-term support and resistance levels.
K-means clustering is one of the most popular algorithms, the objective of K-means is to group similar data points together and discover underlying patterns. To achieve this objective, K-means looks for a fixed number (k) of clusters in a dataset.
A cluster refers to a collection of data points aggregated together because of certain similarities. For this, a target number k has to be defined, which refers to the number of centroids it is needed in the dataset.
Every data point is allocated to each of the clusters through reducing the in-cluster sum of squares.
In other words, it identifies the k number of centroids and then allocates every data point to the nearest cluster, while keeping the centroids as small as possible.
Support Resistance Classification (VR) [LuxAlgo]The Support Resistance Classification (VR) indicator shows SR levels on any chart's visible range using higher time-frame data (HTF). Levels are classified 1 through 10 based on their strength, with lower values indicating stronger support/resistance levels.
This indicator uses visible range functionality, whereas if you adjust your chart to show previous price data, the indicator may show new levels.
🔶 USAGE
Certain indicators on higher timeframes can provide longer term support/resistance levels on lower timeframes. Users can use the provided levels on a chart visible range and use them as reference for future support/resistance levels.
The classification algorithm measures the strength of a support/resistance level using the entire chart visible range and is in a range of 1 to 10, with higher values indicating a weaker support/resistance.
Supports/resistances highlighted by the indicator can be used for future applications by marking them on the chart (quickly done with alt + h).
🔶 DETAILS
All calculations are based on what you see on the Visible Chart, as such changing the chart will recalculate the indicator.
Since only Swings which are not broken are included, every break would exclude that swing. Therefore, even when 'value' is chosen at Settings ('Value'), breaks are always calculated on the entire line.
🔶 SETTINGS
Fade: After x breaks the line becomes invisible
Value:
value:
• SMA, upper/lower: the breaks are triggered on the moving average itself
• Fibonacci Pivot Point levels, Previous High, Previous Low: only last HTF values can be used for breaks
• Swings (see SWING SETTINGS)
line:
• SMA, upper/lower: the breaks are triggered on the entire line, based on its latest value
• Fibonacci Pivot Point Levels, Previous High, Previous Low: breaks are triggered on the entire line, based on its latest value
• Swings (see SWING SETTINGS)
🔹 Swing Settings
Swings are always calculated at current timeframe, setting a HTF is not applicable on Swings.
Left/Right: for Swing calculation ( pivothigh , pivotlow )
Show: enables you to see the pivot points
🔹 Set
N°: The concerning number
TYPE:
• SMA (Simple Moving Average)
• Previous High/Low
• Upper/Lower ( Bollinger Bands )
• Pivot Point levels : "Fibonacci"
LENGTH: sets the 'Number of bars', needed for calculations (applicable for SMA, upper/lower)
MULT: sets the 'Standard deviation factor' (only applicable for upper/lower - BB)
HTF: sets 'Higher Time Frame' (applicable for SMA, upper/lower, Previous High/Low, Fibonacci)
🔹 Show Values
You can make up to 5 values visible (if you want to check/verify), except for Swings (see SWING SETTINGS)
To do so, enable (A -> E), and choose the N° you want to see.
This also is a useful tool if you're not sure which value you want to set.
Buyside & Sellside Liquidity [LuxAlgo]The Buyside & Sellside Liquidity indicator aims to detect & highlight the first and arguably most important concept within the ICT trading methodology, Liquidity levels.
🔶 SETTINGS
🔹 Liquidity Levels
Detection Length: Lookback period
Margin: Sets margin/sensitivity for a liquidity level detection
🔹 Liquidity Zones
Buyside Liquidity Zones: Enables display of the buyside liquidity zones.
Margin: Sets margin/sensitivity for the liquidity zone boundaries.
Color: Color option for buyside liquidity levels & zones.
Sellside Liquidity Zones: Enables display of the sellside liquidity zones.
Margin: Sets margin/sensitivity for the liquidity zone boundaries.
Color: Color option for sellside liquidity levels & zones.
🔹 Liquidity Voids
Liquidity Voids: Enables display of both bullish and bearish liquidity voids.
Label: Enables display of a label indicating liquidity voids.
🔹 Display Options
Mode: Controls the lookback length of detection and visualization, where Present assumes last 500 bars and Historical assumes all data available to the user
# Visible Levels: Controls the amount of the liquidity levels/zones to be visualized.
🔶 USAGE
Definitions of Liquidity refer to the availability of orders at specific price levels in the market, allowing transactions to occur smoothly.
In the context of Inner Circle Trader's teachings, liquidity mainly relates to stop losses or pending orders and liquidity level/pool, highlighting a concentration of buy or sell orders at specific price levels. Smart money traders, such as banks and other large institutions, often target these liquidity levels/pools to accumulate or distribute their positions.
There are two types of liquidity; Buyside liquidity and Sellside liquidity .
Buyside liquidity represents a level on the chart where short sellers will have their stops positioned, and Sellside liquidity represents a level on the chart where long-biased traders will place their stops.
These areas often act as support or resistance levels and can provide trading opportunities.
When the liquidity levels are breached at which many stop/limit orders are placed have been traded through, the script will create a zone aiming to provide additional insight to figure out the odds of the next price action.
Reversal: It’s common that the price may reverse course and head in the opposite direction, seeking liquidity at the opposite extreme.
Continuation: When the zone is also broken it is a sign for continuation price action.
It's worth noting that ICT concepts are specific to the methodology developed by Michael J. Huddleston and may not align with other trading approaches or strategies.
🔶 DETAILS
Liquidity voids are sudden changes in price when the price jumps from one level to another. Liquidity voids will appear as a single or a group of candles that are all positioned in the same direction. These candles typically have large real bodies and very short wicks, suggesting very little disagreement between buyers and sellers. The peculiar thing about liquidity voids is that they almost always fill up.
🔶 ALERTS
When an alert is configured, the user will have the ability to be notified in case;
Liquidity level is detected/updated.
Liquidity level is breached.
🔶 RELATED SCRIPTS
ICT-Concepts
ICT-Macros
Imbalance-Detector

Bar Move Probability (BMP)Hello fellow traders! I am excited to share with you my latest creation, the Bar Move Probability (BMP) indicator. This powerful tool is designed to give you a statistical edge in your trading by helping you understand the likelihood of price movements based on historical data. In this blog post, I'll give you an overview of the indicator, its features, and how it can help you make more informed trading decisions. Let's dive in!
What is the Bar Move Probability Indicator?
The Bar Move Probability (BMP) indicator is a unique tool that calculates the probability of a bar's price movement, either up or down, based on past occurrences of similar price movements. This can give you valuable insights into the potential direction of the market, allowing you to make better-informed trading decisions.
One of the key features of the BMP indicator is that it allows you to choose the price you want to determine the probability of. By inputting your desired price, the indicator will analyze historical data and provide you with the likelihood of reaching that price, offering a more personalized approach to trading.
How Does the BMP Indicator Work?
The BMP indicator calculates the probability of a bar's price movement by comparing the current price change (in percentage) to historical price changes. It does this by maintaining separate arrays for green (bullish) and red (bearish) price movements, as well as corresponding arrays for the count of each movement.
Whenever a new bar is formed, the indicator checks whether the price movement (in percentage) is already present in the respective array. If it is, the corresponding count is updated. Otherwise, a new entry is added to the array, with an initial count of 1.
After analyzing the historical data, the BMP indicator calculates the probability of each price movement by dividing the count of each movement by the sum of all counts. These probabilities are then stored in separate arrays for green and red movements.
Finally, the indicator displays the probability of the current price movement as a label on the chart. The label is color-coded, with green indicating a bullish price movement and red indicating a bearish price movement.
How Can the BMP Indicator Benefit Your Trading?
The primary benefit of the BMP indicator is its ability to provide you with a statistical edge in your trading. By analyzing historical price data, the indicator helps you understand the likelihood of a certain price movement occurring, allowing you to make more informed decisions about your trades.
The customizable nature of the BMP indicator, allowing you to input your desired price, makes it a valuable tool for traders with specific price targets in mind. By understanding the probability of reaching your target price, you can better manage your risk and optimize your trading strategy.
For example, suppose the BMP indicator shows a high probability of a bullish price movement towards your target price. In that case, you may consider entering a long position or tightening your stop loss on an existing short position. Conversely, if the indicator displays a high probability of a bearish price movement away from your target price, you may consider entering a short position or taking profit on an existing long position.
The BMP indicator can be used in conjunction with other technical analysis tools and indicators to further strengthen your trading strategy. For example, you can combine the BMP indicator with support and resistance levels, trend lines, and moving averages to better time your entries and exits.
Wrapping Up
In conclusion, the Bar Move Probability (BMP) indicator is a powerful and customizable tool that can help you gain a statistical edge in your trading. By analyzing historical price data and allowing you to input your desired price, the indicator provides valuable insights into the likelihood of price movements, enabling you to make better-informed trading decisions.
I hope you find the BMP indicator useful