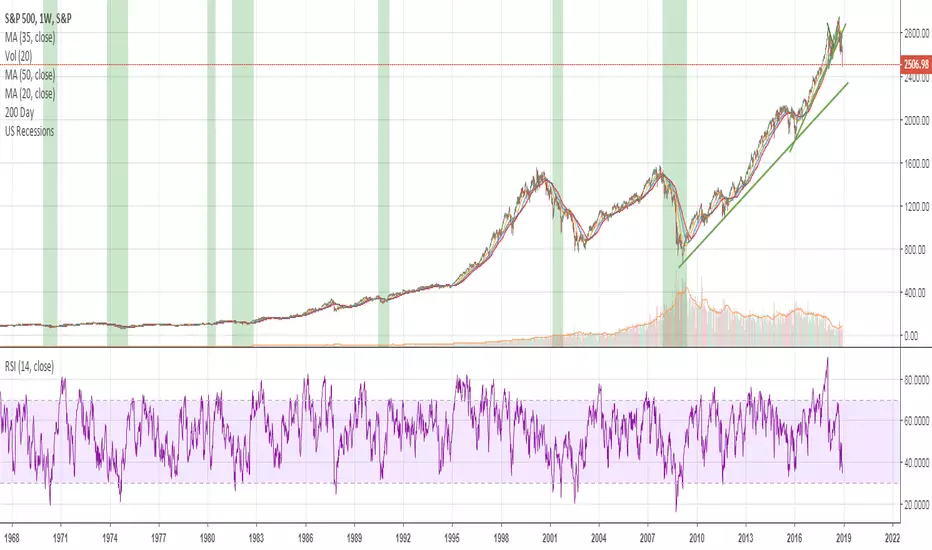
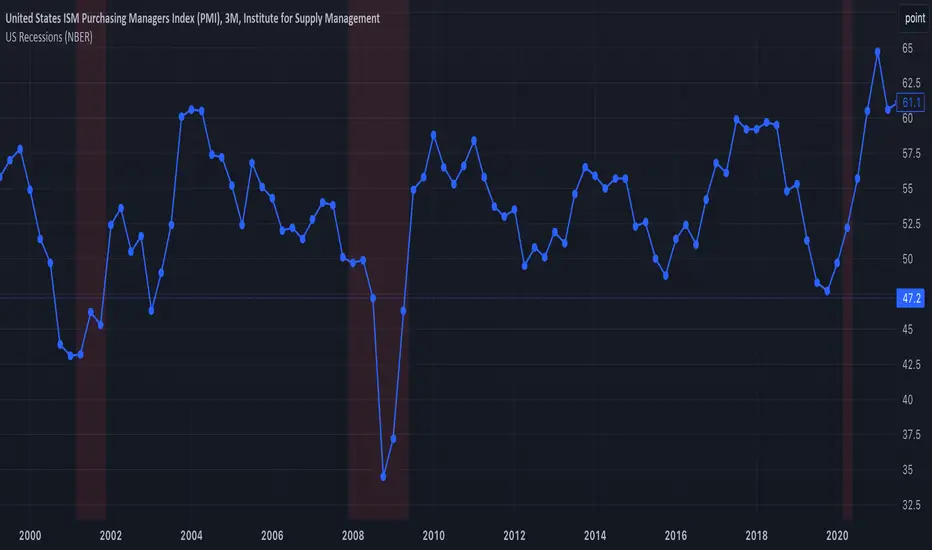
US Recessions (NBER)This indicator is designed to replace the US Recessions indicator.
Unfortunately, the original indicator is now broken, and the author is not responding: www.tradingview.com .
There are other similar indicators, but they are not based on live data and either show non-officially recognized recessions or fail to display all officially recognized recessions.
This indicator shades US recession periods based on live monthly data from USREC . It highlights all officially recognized US recessions according to the NBER and will automatically shade any future recessions when they occur. The indicator works across all timeframes, correctly shading recessions whether you are viewing a 30-minute, 2-hour, daily, weekly, or any other chart timeframe.
Warning & Risks :
This indicator uses the barmerge.lookahead_on option to correctly handle monthly recession data from USREC . The purpose of this setting is to ensure that the monthly data points are applied retroactively to the corresponding bars on the chart. However, this means that while past recession periods are accurately shaded, the script is effectively displaying data from future candles and plotting it backward onto the chart.
This behavior does not introduce a “future leak” in the traditional sense—since USREC data is backward-looking and the current month always remains non-recessionary until officially confirmed. Nonetheless, it can cause confusion, as users may see recession periods shaded retroactively only after the data becomes available. Therefore, the current month will always appear non-recessionary until the next data point is released, and historical recession periods may be adjusted after the fact .
Recessions
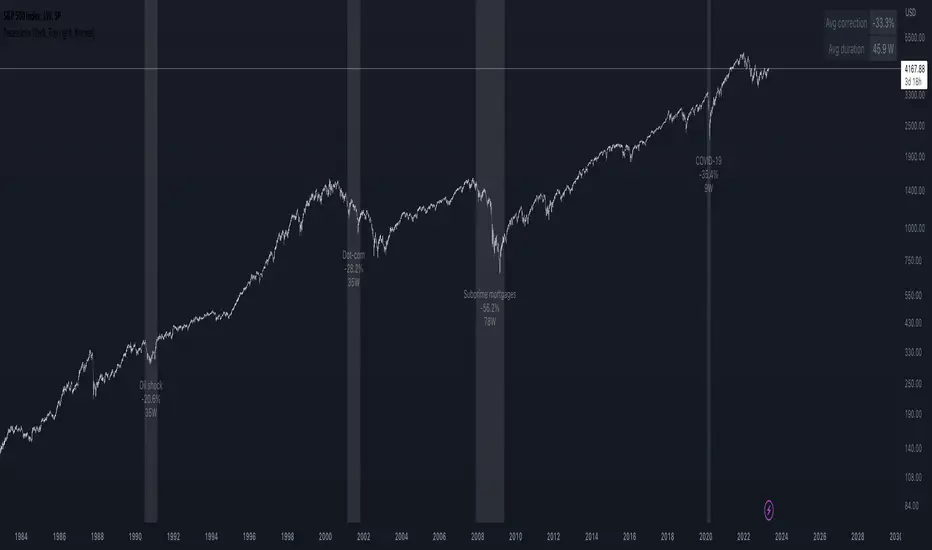
Recessions & crises shading (custom dates & stats)Shades your chart background to flag events such as crises or recessions, in similar fashion to what you see on FRED charts. The advantage of this indicator over others is that you can quickly input custom event dates as text in the menu to analyse their impact for your specific symbol. The script automatically labels, calculates and displays the peak to through percentage corrections on your current chart.
By default the indicator is configured to show the last 6 US recessions. If you have custom events which will benefit others, just paste the input string in the comments below so one can simply copy/paste in their indicator.
Example event input (No spaces allowed except for the label name. Enter dates as YYYY-MM-DD.)
2020-02-01,2020-03-31,COVID-19
2007-12-01,2009-05-31,Subprime mortgages
2001-03-01,2001-10-30,Dot-com bubble
1990-07-01,1991-03-01,Oil shock
1981-07-01,1982-11-01,US unemployment
1980-01-01,1980-07-01,Volker
1973-11-01,1975-03-01,OPEC
CommonMarkupLibrary "CommonMarkup"
Provides functions for chart markup, such as indicating recession bands.
markRecessionBands(showBands, lineY, labelY)
Mark vertical bands and show recession band labels if argument showBands is true. Example "markRecessionBands(bar_index ,3.0"
Parameters:
showBands : - show vertical recession bands when true. Functionally equiv to no op when false
lineY : - y-axis value for line positioning
labelY : - y-axis value for label positioning
@return true - always answers the value of showBands
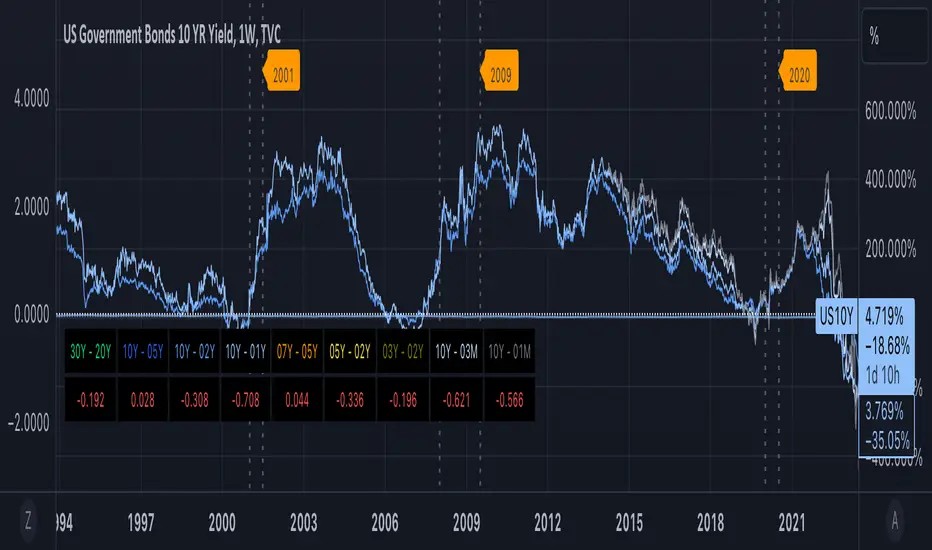
Recessions [TXMC]This simple indicator prints a red band when US markets experience a recession. This data is taken directly from the Federal Reserve via TradingView.
This script is a good pair with my Treasury Yield Spread 10y-2y indicator.

US Recessions Credit to Sinuhet for creating the primary script. My change just gets rid of the bug that had erred in indicating another recession in 2015/2016.