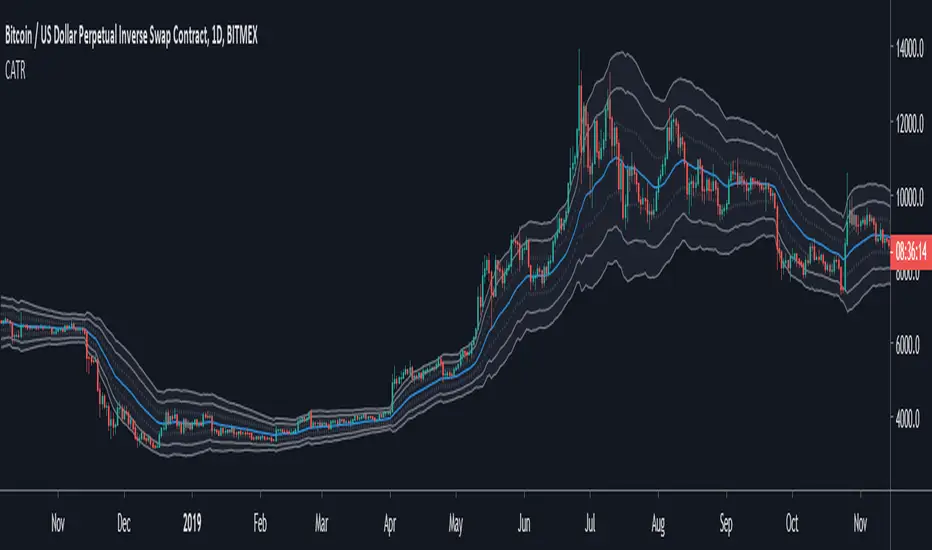
Channel ATR1 - What is the Channel ATR indicator
This is an envelope indicator (like the Bollinger bands indicator) used to evaluate how much the price diverge from it's moving average.
This indicator can be used as a system on it's own. I recommend to use it when the market goes side way, although, you can also use it when the market is trending.
What makes this indicator so relevant and reliable ? The use of the ATR to build the envelope. Read below if you wan to know more.
2 - How is the Channel ATR computed
The main component is an EMA. The envelope is made of 3 layers, each is the Average True Range, plot at a multiple distance from the EMA (1*EMA, 2*EMA, 3*EMA) . If you don't know what is the ATR, it's basically a measure of the volatility (you can read more about it here ).
Each layer of the envelope is a multiple of the measure of the volatility. Let's see how to use it.
3 - How to use the Channel ATR indicator
You can use this indicator in different strategies :
- Return to the mean: When the price goes out of the envelope, it's an excess of the market. You can take advantage of this by betting to a return to the EMA value.
- Trend following : If the market is tending, you can buy/sell when the price touch the EMA and place a target at another level in the envelope.
- Stop loss: Since each envelope layer is built from the ATR (i.e. the volatility), you can use it to place your stop at least at 1 ATR from your entry, to not be hit by the market noise.
- Find your own way : The Channel ATR is a very rich and powerful indicator, you can try to built your own trading system on the top of it.
Rangetrading
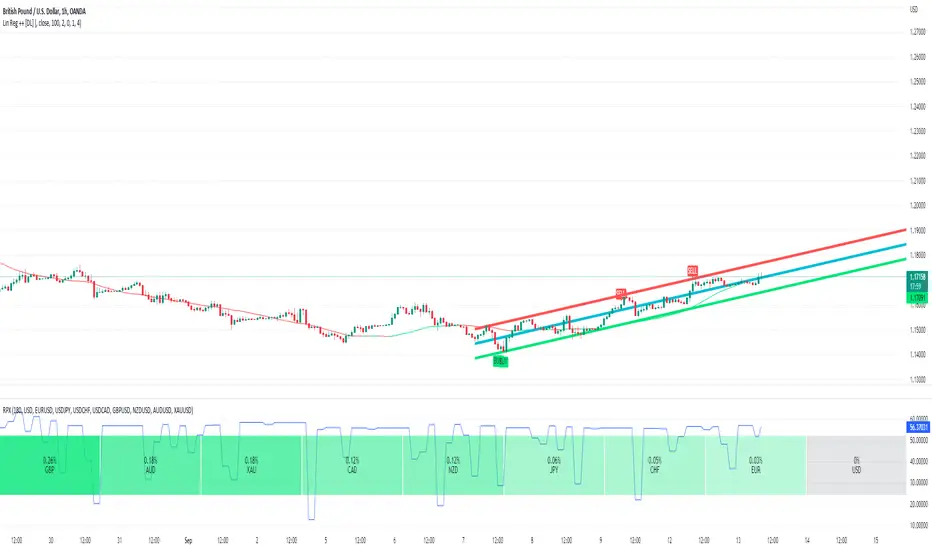
Linear Regression ++Due to public demand
Linear Regression Formula
Scraped Calculation With Alerts
Here is the Linear Regression Script For traders Who love rich features
Features
++ Multi time frame -> Source Regression from a different Chart
++ Customized Colors -> This includes the pine lines
++ Smoothing -> Allow Filtered Regression; Note: Using 1 Defaults to the original line. The default is 1
++ Alerts On Channel/Range Crossing
Usage
++ Use this for BreakOuts and Reversals
++ This Script is not to be used Independently
Risks
Please note, this script is the likes of Bollinger bands and poses a risk of falling in a trend range.
Signals may Keep running on the same direction while the market is reversing.
Requests
If you have any feature requests, comment below or dm me. I will answer when i can.
Feel free to utilize this on your chart and share your ideas
For developers who want to use this on their chart, Please use this script
The original formula for calculation is posted there
❤❤❤ I hope you love this. From my heart! ❤❤❤
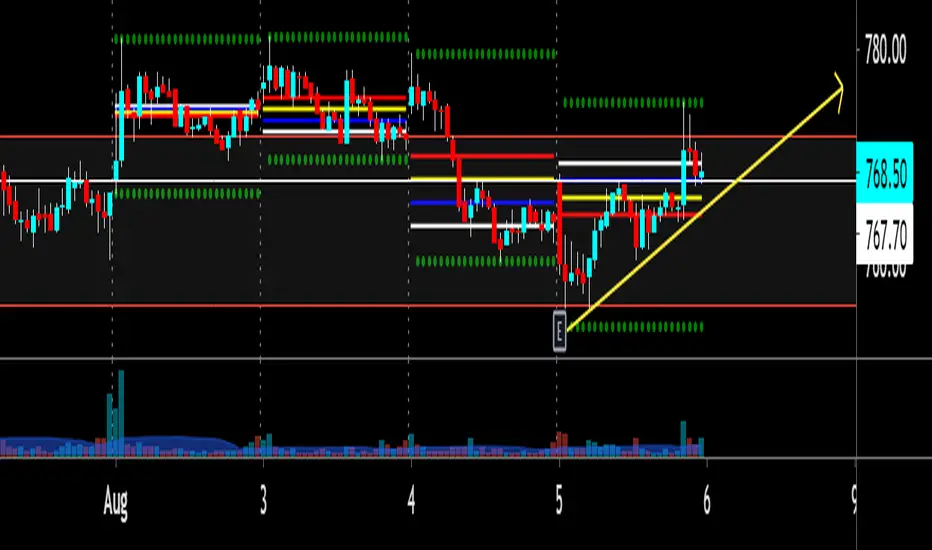
LOSS2PROFIT_Market_RangeFor Breakout Trading..(range trader)
Investor , monthly trader ,weekly trader and daily trader(everyone can use it)..
It show market own range which is created by market/price (not by calculation)..
This are the important decision point which is made by traders(all style)..
Depend upon time frame , most important thing is market opening and market closing..
Entry through market high and market low (important support n resistance)..
Use it wisely according to your strategy.. (logic always works and trust your strategy)
Keep on back testing...
(until you get , what you want)

[C] Dynamic Range Channel based on ATR on Multi Time FramePlots the dynamic range from the calculated Average True Range of the security. The calculated price that it could return to from high to low and vice versa. Has been tested on multiple time frames on NSE equity stocks.

$0 Monthly Weekly & Daily OHLC Viewer
Visualizer of current or previous month(s), week(s) & days ranges
Purpose: View last Monthly, Weekly, Daily, and/or a custom time interval OHLC, i.e. previously closed/confirmed or the ongoing higher time interval ranges
Main configurations available:
- 2 main reporting modes: View the current/ongoing M/W/D candles' OHLC (live, repaints) or report OHLC of last closed ones, i.e. previous Montly, Weekly and/or Daily
- View only latest Monthly, Weekly and/or Daily OHLC (lines) or all past ones (~channel)
- Set your own time interval for its price range(s) to be reported, e.g. last quarter '3M', 12H '720', or hide it
- View one specific day of the week OHLC reported all over the week
Graphic/visual configuration:
- Show the High & Low levels or not
- Show the Open & close levels or not
- Display a background color between top & down or lines only
- Change the background color depending if is/was rising or falling price
- Highlight the top & down breaches of higher timeframe resolution candles: Daily breaching last Weekly range, and/or the Weekly the Monthly one
- Colors & styling can be edited from the indicator's styling configuration panel
Depending on its expected usage, those configurations enable to:
- Consider previously closed candles OLHC as reference top & down ranges (support & resistance, breaches)
- Review chart's current candles evolution within their higher time interval / candle (M/W/D)
- Consider specific week days' range as a reference for the week trend
- Have a general overview of the market evolution trends
Default config is to view current candles evolving within their higher time interval / candle, while reporting last previously closed M+W is a preferred usage. Play with the config settings to find your setup.
View ongoing M+W+D OHLC with dynamic background color:
View previously closed M+W+D OHLC:
View closed H&L for M+W+D, latest only:
View Mondays' OHLC:
Feedback & support welcome.

LOSS2PROFIT_MARKET_ZONE//Version4
Best For Range Trader...
Combination of decision Point and Pivot Point And CPR...
Market Zone consist of
TMZ = Top Market Zone
CMZ = Center Market Zone
BMZ = Bottom MArket Zone
You can choose option of daily /weekly/monthly/yearly...
Historical data Control...
Easy Way to Analyse Market Zone to apply breakout and pullback entry..
Easy to capture Trending and Non-Trending Market..
MARKET_ZONEFor Intraday Trader... Classical Decision_point and CPR Combination...
Market Zone
TMZ = Top market zone
CMZ = center market zone
BMZ = Bottom Market zone
TMZ consist of pdh and r1
CMZ consist of pc and cpr
BMZ consist of pl and s1
useful for determination of trending market and range market...

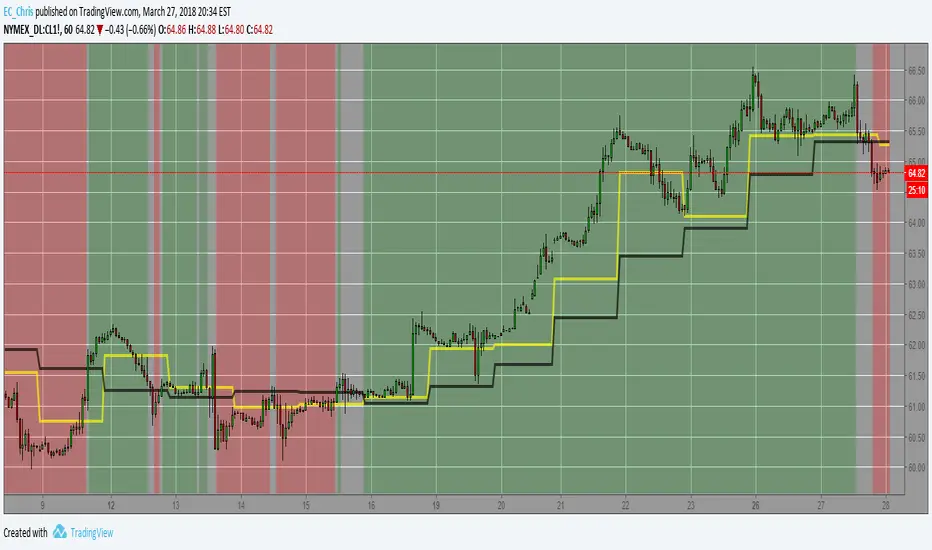
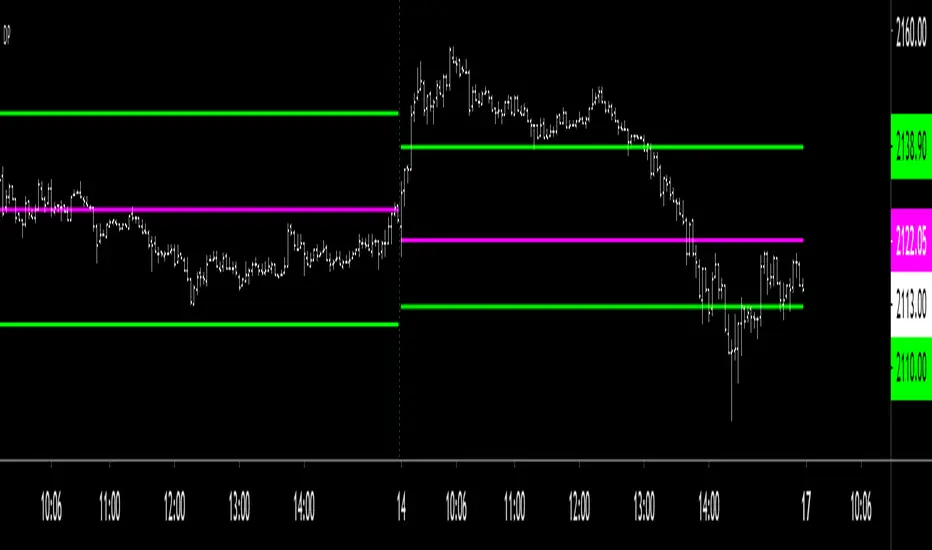
Range Box + VMA cloudsHere's a mix of two indicators that I find particularly useful.
One is a Range Box showing High and Low of the day plus 50% range, as well as high and low of the previous day. The Box changes color based on whether it closed higher or lower than the previous session.
The second one plots Variable Moving Average clouds - short and long term one.
The rules are pretty simple - take long trades only if the box is green, short trades if it's red.
Candle close above both clouds - long signal. If the price is being rejected from the long term cloud - buy the dip (or rally).
Pretty straightforward.
Enjoy
Credit for VMA: LazyBear
Credit for High Low DayBox: ahoudori

Decision_Pointclassic decision point for intraday
CDH- current day high(not fixed range)
CDL- current day low (not fixed range)
CDO- current day open(fixed range)
PDH- previous day high(fixed range)
PDL- previous day low(fixed range)
PDC- previous day close(fixed range)
above all are decision points where market reaction takes place..
make your own strategy for intraday using DP...
Normailzed CandleThis indicator normalizes Day's candle with Open. Idea is to see the daily movement in the context of the Open of the Day.
Larry Williams talks about Open being the most important price of the day. Hence, this indicator.
The Green line is average Open-to-High for occurrences of Red days. The Red line is average Open-to-Low for occurrences of Green days.
Average are not perfect calculations since occurrences(of Red or Green) will vary within the time-span used for averages.
These can used to gauge likelihood of the intra-day price reversal. If the price exceeds green/red line, there is higher likelihood of the price closing above/below open.
The blue lines are average Open-to-close for Green and Red occurrences.
Be careful on days where consecutive 3rd Highest High or Lowest Low day is made and also on the next day after such day. Prices may turn direction at least for a short while.
The precursor to this script of the Candle Infopanel script. That script was just numbers in panel and this is a graphical representation. I
Some of the calculations from original script are commented here because it would make visuals clutters (and probably the left-out calculation are not critical to making trade decisions!)

Developing Range v1.0Developing Range v1.0
----------------------------
Azimuth Dynamics
Scalping tool for help finding potentially high probability reactive levels. I suggest using on a 5min chart.
GRAY BAND: yesterday's High-Low range
BLUE BAND: today's Developing Range. Mean of today's High-Low range so far and yesterday's High-Low range, this is calculated for each of today's bars
THIN BLUE LINE: the mean of today's range median and yesterday's range median.
Note: we do not use the DAILY bar via 'security()' to obtain today's high and low. This would essentially be forward looking, instead we use iteration to check from the current bar back to midnight, bar by bar. This then allows a developing range to be established as the day prints new highs and lows.
Inspired by volatility trading textbook.

Filthy REPAINTING of McNasty Profits*** THIS SCRIPT REPAINTS ***
Looking at the history will go you NO IDEA as to actual performance, or alerts that triggered within each bar. I made all of the alerts repaint in order to allow an alert each minute a condition is met, and never again after.
For instance; receive an alert each time the price is within a particular plotted area on the chart (as defined by settings). This could not be accomplished without repainting.
In order to receive a notification of the price crossing a particular line, YOU NEED TO SET ALERTS TO "ONCE PER MINUTE."
This way, if you use an alert to enter a position and then get stopped out, you can re-enter on the next alert if the price moves in the original direction again within the same bar.
Also, I made this script so that each entry has an available Stop Loss alert that will get you out of a position going in the wrong direction (and option to enter in opposite direction). You set the parameters within the settings.
Although each position has a tight Stop Loss available via Alert, I also recommend using a similar tight Stop Loss directly on your exchange in case an error occurs anywhere within the chain.
This script HAS A LOT OF OPTIONS for how you can use it, from very conservative to extremely aggressive. There are NINE customizable alerts for the user to decide how/when to use, or ignore entirely.
When the Alerts are set to "ONCE PER MINUTE" you will get an alert each time the price crosses the corresponding area on the chart, but the characters only remain on the charts history if the alert was still firing (Once Per Minute) when the bar closed. This is why the Alerts on the chart's history are completely irrelevant.
As you can imagine, this is a LOT OF ALERTS. Consequently, this is meant for use with "bot trading" using the Alerts to automatically Open and Close positions.
I am using it with 3Commas to make trades on Bybit.
At the time of publishing, this is "Invite Only." I need to test it out over a range of time, conditions, chart time frames, pairs, etc... before opening it to the public.

Eagle Eye Indicator [B]Indicator version with three different modes, Range/Range Additive/Range Normalized.
Colorscheme is the same as the original overlay Project Eagle Eye

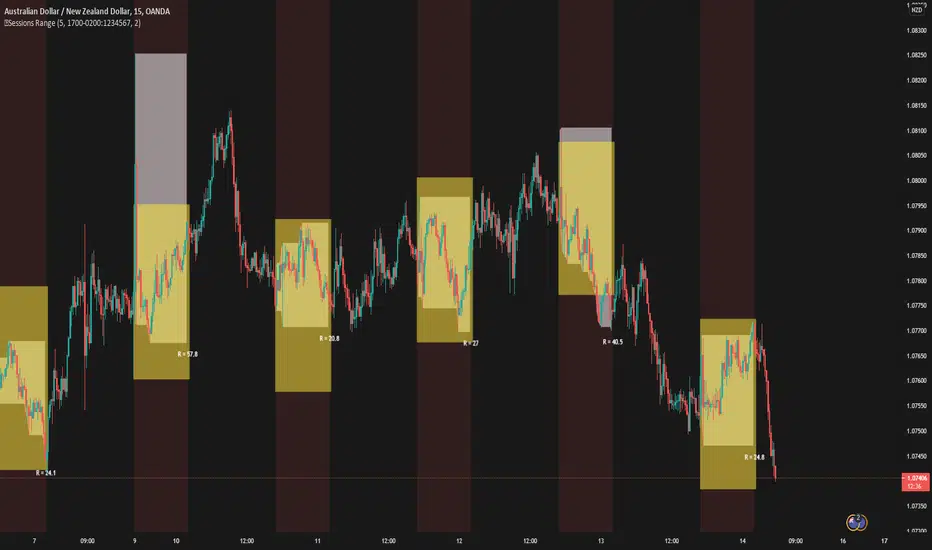
5 Sessions RangeThis script averages the range of the previous 5 sessions and displays it on the chart
The sessions are adjustable
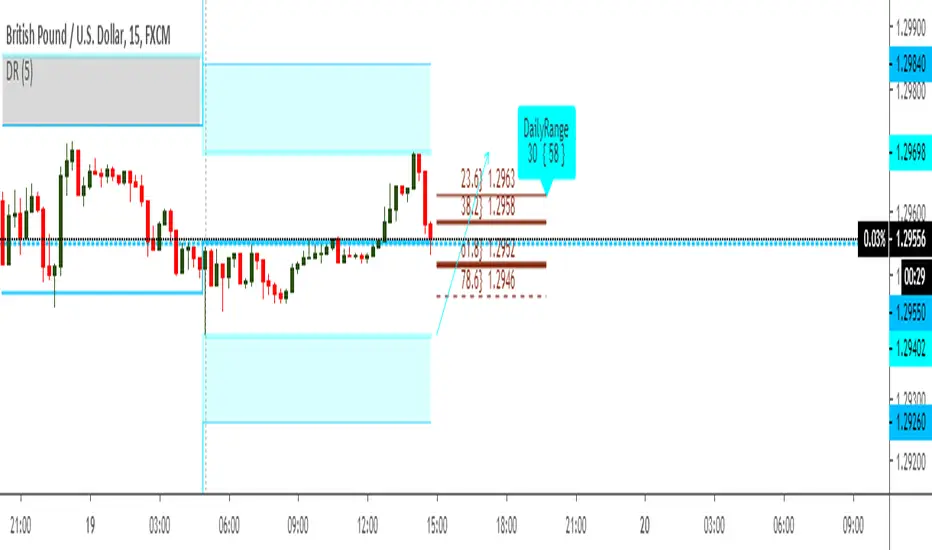
Fib Signals | -- MoonLaunchr --Script that can display signals against key Fibonacci levels based on highs and lows within a given time-frame
Set the number of days back in time that you would like the indicator to look for the high and low for calculating fibs.
Bear Market options include sub-level fibs within the 12.3% range - 38.2 and 61.8% 3 levels deep.
Signals when crossing over and under key fibs.
Set ALERTS for each key fib piercing.
Set ALERTS when new highs or lows are made.
All levels and signals can be displayed or hidden and customised within the indicator options.
Next candle price projection.
Bull Market key fib sub-levels will be added in the next update (top 12.8% sub-levels 1,2 & 3).
Happy trading!

ColorPatternColorChart Range Trading...testing phase only, hence NOT for trading. To be improved further.

colorPatternColorBarSwing Pattern....just for trial testing only. to be adjusted....not for trading.

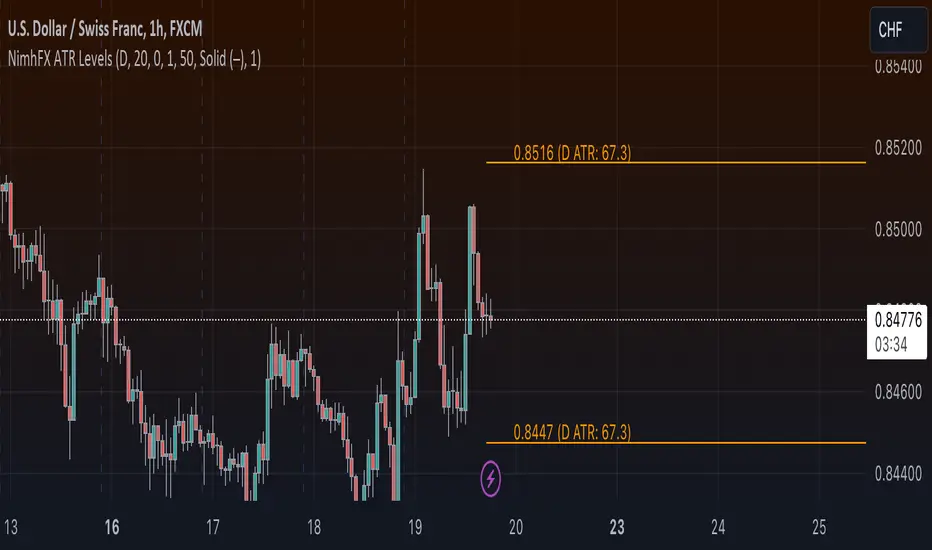
NimhFX Daily ATR High/Low Levels Creates an upper and lower level based on the ATR for your selected period. Calculation is based on the following;
Shift Variable works by allowing calculation from x-periods back.
Upper band = (Daily Low + ATR)
Lower Band = (Daily High - ATR)
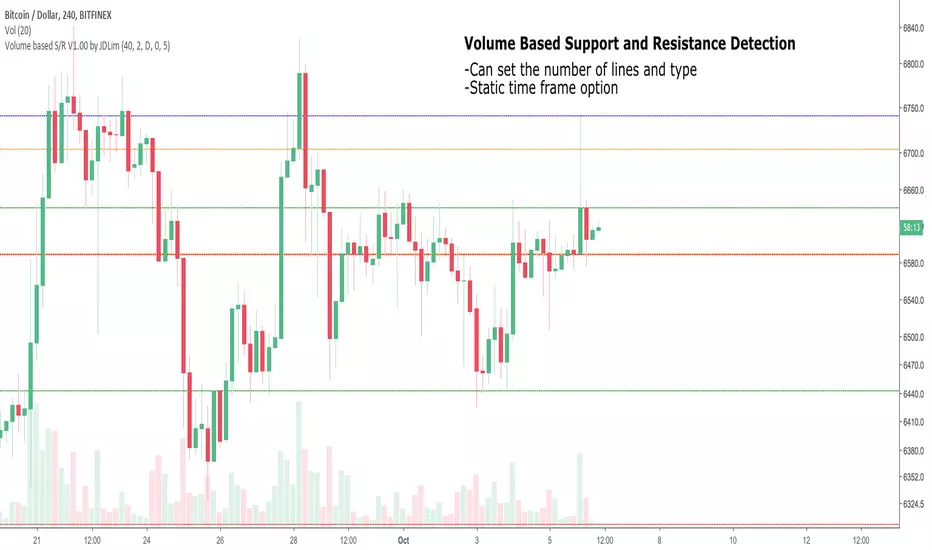
Volume-based Support and ResistanceV1.00
Pre-release; still working on this.
Identify the highest volume candles can plot support/resistance based on them.
Will try to create ranges using them.
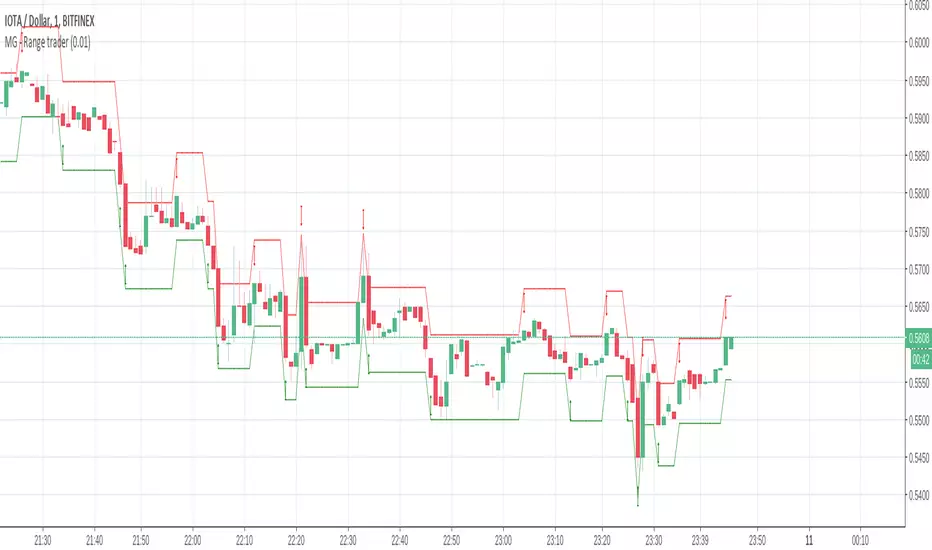
MG - Range trader - 1.0This one is a bit of an experiment..
The theory is, if you have an asset that you firmly believe will rise in the future for fundamental reasons and are happy to hold until that happens i.e. a be a position trader, you can take advantage of market volatility at the same time in a relatively safe way, so theoretically, you profit when the price goes up or down
E.g. You have $1000, an asset in which you want to become a position trader and you are happy to either make more money or more of the asset as you believe that will make you more money in the future, you could wait until a decent retracement, maybe around a good support level, then buy $500 of the asset and simply sell if it goes up by X, buy if it goes down by X. If you keep doing this, you will end up with either with more of the asset or more money. You have a sure gain either way (if you are happy to have either money or asset)
There are some considerations:
The higher the trade size, the faster profit compounds and the faster you exhaust your available buys and sells
- E.g. If asset is $100, you have $500 and you plan to buy / sell every $10 change, if the asset drops straight to $40, your last buy will be at $50, at which point, the asset is still dropping. But it you only plan to buy / sell $5 every $10 price, you will be able to buy right down to 0.
In times of strong trend, it may be better to avoid this approach altogether as there may not be so much oscillation or at least to use a small if not minimum order size.
Application:
The buy and sell triggers can be connected using autoview to convert this indicator into a range trading bot
Opening asian Range 7 h FOREX.COM by Blackwolf v2.0This script is programmed for FOREX.COM with Rome Time Zone and is shows the min & max price reached in asian session every day.
Lo script mostra il massimo ed il minimo della sessione asiatica. Impostato per broker FOREX.COM e fuso orario di ROMA

True Rolling Pivot Range IndicatorHere is the actual 3 day rolling pivot range indicator as detailed in Mark Fisher's book The Logical Trader.