Fear Of Missing Out grid of forex tradingAbstract
This script finds potential safe grids placing limit orders without fear of missing out.
This script computes grids according to power of 1.0025 .
You can reference those price levels for your trading.
Introduction
Grid trading is a popular trading method.
Traders plan several price levels as grids and repeat buying at lower grids and selling at higher grids.
Grids can be round number like multiple of 100 pips.
Grids can also be support and resistance according to price history.
Some traders may think they need to adjust grids to trade.
However, there are several problems in choosing grids.
One problem is rate of change is related and therefore exponential. 20 to 30 is different from 30 to 40.
Another interesting point is there are some special impressing reversal price levels.
Several months ago, I had a question why usdjpy bounced near 108.3 .
After using a calculator, I found that 108.3 = 100 * 1.083 ≒ 100 * pow(1.0025,31) .
1.0025 , as known as 0.25% of change, is a potential stop out zone.
Therefore, we can compute grids and one grid is a little more than 1.0025 times than an another one.
After we finished computing grids, we can consider buy and sell near those grids.
Note that different traders may obtain different grid values.
For example, from 1.0 to 2.0 , it can be splited as 270 grids or 277 grids because pow(1.0025,277)<2 .
Those grids cannot always imply potential reversal points but they can be useful for traders looking for 0.25% profit targets with reducing fearing of buying or selling too early.
Computing grids
This script split from 1.0 to 10.0 into three segments.
One is 1.0 to 2.0 .
The second segment is from 2.0 to 5.0 .
The third segment is from 5.0 to 10.0 .
This script does the same thing for 0.1 to 1.0 , 10.0 to 100.0 , and so on.
For 1.0 to 2.0 and 5.0 to 10.0 , this script split a segment as 270 grids.
For 2.0 to 5.0 , this script split a segment as 360 grids.
The last step is display the next grids to the daily low and daily high.
Maybe also display the grids behind grids shown.
Parameters
x1,x2,x3,x4 : display the next x1,x2,x3,x4 grids to daily high and daily low. 1 means the next grid to daily high and daily low. 2 means the next grid to 1.
x_seg : default 2.0 . This script split from 1.0 to 10.0 into three segments. One is 1.0 to x_seg. The second segment is from x_seg to 10.0/x_seg . The third segment is from 10.0/x_seg to 10.0 .
x_grid1 : how many grids in the first segment
x_grid2 : how many grids in the second segment
x_lowprice : add this number for bigger grid distance. Generally, you don't need this number when trading forex but you may need it in stock trading. For stocks with price between 50 to 100, I recommend you use x_lowprice=100.
Conclusion and suggestions
This script can find potential grids for trading.
If price touches grids usually, we can consider buy and sell after price touches grids.
If price reverses before touching grids usually, we may consider buy and sell before price touches grids.
Those grids can remind us don't buy too much unless the price touches the next grid.
For instruments with less volatility, maybe we need more grids.
For traders with more money, they may also consider more grids for more dedicated range trading to collect more profit.
Reference
Sorry, I forgot them.
Rangetrading

Trading Range FinderWhat is it?
This indicator is a visual representation of the ADX indicator that shows where the areas of weak trends are. Anything shaded in a gray background implicates that the chosen market is experiencing a weak trend.
These areas of weak trends are seen typically when ADX drops below 20-25 but this script is customizable to change where you want that threshold.
Why did I make it?
I made this indicator to be used in combination with other trading indicators to eventually be used to identify when a market is range-bound/sideways.
Since momentum-based indicators can be "thrown off" in sideways market conditions, I will be using this visual indicator to identify when it is best to filter out a trade signal in a momentum-based strategy.

Michigandolf's 30min Opening RangeThis script plots the 30min Opening Range as well as the previous day's high & low.
Description:
Blue Line = Top of the 30min Opening Range for the session
Pink Line = Bottom of the 30min Opening Range for the session
White Line = Mid-Point of the 30min Opening Range for the session
White Transparent Area = The full range of the 30min Opening Range
Green Line = Yesterday's High for the session
Red Line = Yesterday's Low for the session
Use:
The Opening Range will continue to expand until the first 30minutes of trading has passed, at which point the range will lock in place for the remainder of the trading session. Many traders use these important levels to gauge trade entries and exits (e.g. Mark Fisher's ACD strategy).
This script does not work currently work for futures (e.g. ES, NQ, RTY) due to the session start time. Will configure for futures trading in a future update.

Support and Resistance V1 This script is based on Range Support and Resistance .
It works by taking the range of the day,week and month calculating them and plotting 3 layers of Support and Resistance , as soon as it gets non directional /range bound , bar color turns GRAY if its in Bullish Trend and Pink if its in Bearish Trend .. As soon as bar turns Aqua it defines BULLISH Trend and RED bar color defines Bearish Trend . This way you can easily visualize the areas of support and resistance .
-----------------
Disclaimer
Copyright by FaizanNawazz.
The information contained in my scripts/indicators/strategies/ideas does not constitute financial advice or a solicitation to buy or sell any securities of any type. I will not accept liability for any loss or damage, including without limitation any loss of profit, which may arise directly or indirectly from the use of or reliance on such information.
All investments involve risk, and the past performance of a security, industry, sector, market, financial product, trading strategy, or individual’s trading does not guarantee future results or returns. Investors are fully responsible for any investment decisions they make. Such decisions should be based solely on an evaluation of their financial circumstances, investment objectives, risk tolerance, and liquidity needs.
My scripts/indicators are only for educational purposes!
Happy Trading!

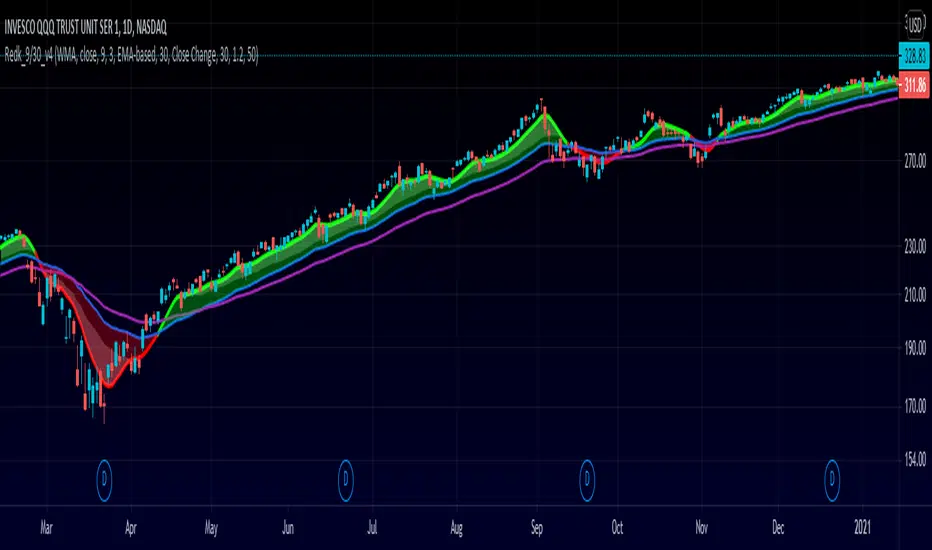
RedK_9/30 Trader_v1: aka The MusicianThis is my implementation of a simple trading system inspired by the 9/30 trading strategy, which i came across few years ago. i hope some traders are still using it :)
(please google "9/30 trading strategy" if you're not sure what it is)
- the improvements i added focus on: faster (long/short) signals, discovery of best entry "zone", ride the trend
- no exit option, trader can use a pre-set target, a trailing stop, or any other mechanisms
- i tried to explain some of the definitions and rules on the below chart
- in spite if its simplicity, the 9/30 has a lot to offer - different traders will also use it differently and add their own "do's and don't's"
default settings should be adjusted to suit timeframe, type of trader and what is being traded (Stocks, FOREX,..etc) - the concept itself is very flexible and well-tested for mechanical trading.
code-named "The Musician" due to the 5-line plot :)
i will continue to improve this work whenever i find time - i liked it a lot.. (please tag the idea to receive the updates)
Extras and improvements (compared to the classic 9/30 concept)
---------------------------------------------------------------------------------
* signal line is a smoothed zero-lag WMA of a shorter length (responds faster to trend change = faster signal)
* instead of a single longer MA line, we utilize an "average range" -based channel (not ATR, but provides the same concept) to provide the ideal "entry zones" in both directions - an adjustable multiplier is included in the settings to adjust the channel width
* adds an optional long EMA as additional filter (take longs only above, take shorts only below)
* clearer visualization
What's next:
==============
* clean-up code
* add signals (arrow-up & arrow-dn) for entry and for exit
* tri-color signal line (green on long, red on short, gray on no trade)
* other options for the channel (ATR-based, DC center-line..etc)
* other MA-type options for the Filter MA (SMA, WMA ?)
* maybe: convert to strategy and back-test
Please feel free to explore and test - Comments and feedback are welcome.
Good Luck!
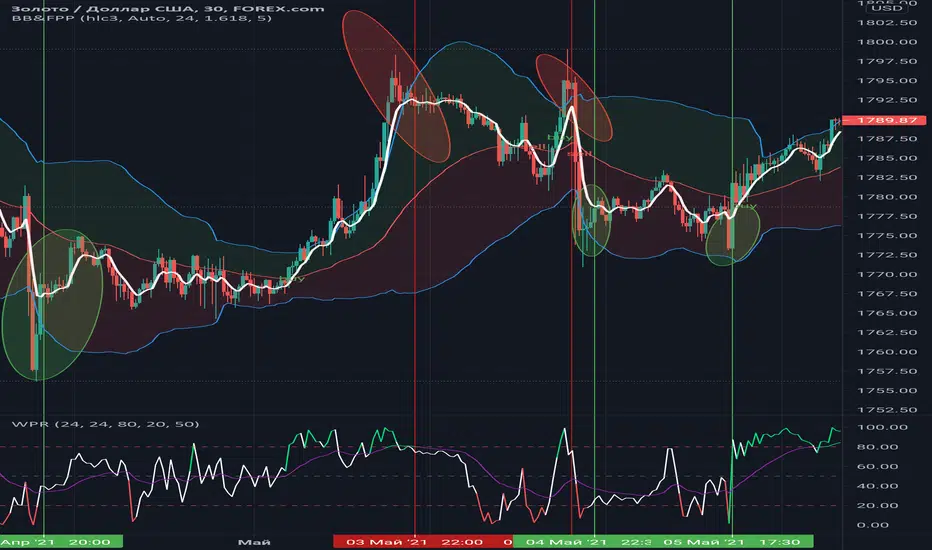
Williams %RHi! WPR is the Williams percentage range indicator in my design. The main idea is that the intersection of the indicator and the moving average in the overbought and oversold zones + color highlighting gives more clear visual signals for making trading decisions based on this indicator.
Trend Type Indicator by BobRivera990Usage:
The purpose of this indicator is to programmatically determine the type of price trend using technical analysis tools.
You can do a quick check on the asset’s higher and lower time frames. For example, if you are trading on an H1 chart, you can check the m5 chart to ensure that the trend is in the same direction and similarly check the H4 chart to ensure that the higher time frame price is also moving in the same direction.
If multiple time frame charts confirm a similar trend, then it is considered a very strong trend and ideal for Trend trading.
Remarks:
By default, the last status is related to 8 periods before the latest closing price.
Related definitions:
The three basic types of trends are up, down, and sideways.
1. Uptrend
An uptrend describes the price movement of a financial asset when the overall direction is upward. The uptrend is composed of higher swing lows and higher swing highs.
Some market participants ("long" trend traders) only choose to trade during uptrends.
2. Downtrend
A downtrend refers to the price action of a security that moves lower in price as it fluctuates over time.
The downtrend is composed of lower swing lows and lower swing highs.
3. Sideways
A sideways trend is the horizontal price movement that occurs when the forces of supply and demand are nearly equal. This typically occurs during a period of consolidation before the price continues a prior trend or reverses into a new trend.
How it works:
Step 1: Sideways Trend Detection
In this step we want to distinguish the sideways trend from uptrend and downtrend. For this purpose, we use two common technical analysis tools: ATR and ADX
1. Average True Range (ATR)
The average true range (ATR) is a technical analysis indicator that measures market volatility.
We also use a 20-period moving average of the ATR.
When the ATR is below the average of its last 20-periods, it means that the rate of price volatility has decreased and we conclude that the current trend is sideways
2. Average Directional Index (ADX)
The average directional index (ADX) is a technical analysis indicator used by some traders to determine the strength of a trend.
The trend has strength when ADX is above 25.
So when the ADX is less than or equal to 25, there is no strong trend, and we conclude that the current type of trend is sideways.
Step 2: Detect uptrend from downtrend
If it turns out that the current price trend is not sideways, then it is either uptrend or downtrend.
For this purpose, we use plus and minus directional Indicators (+ DI & -DI).
A general interpretation would be that during a strong trend, when +DI is higher than -DI, it is an uptrend. When -DI is higher than +DI, it is a downtrend.
Parameters:
"Use ATR …" ________________________// Use Average True Range (ATR) to detect Sideways Movements
"ATR Length"_______________________ // length of the Average True Range (ATR) used to detect Sideways Movements
"ATR Moving Average Type" ___________// Type of the moving average of the ATR used to detect Sideways Movements
"ATR MA Length" ____________________// length of the moving average of the ATR used to detect Sideways Movements
"Use ADX ..."_______________________ // Use Average Directional Index (ADX) to detect Sideways Movements
"ADX Smoothing”____________________// length of the Average Directional Index (ADX) used to detect Sideways Movements
"DI Length"_________________________// length of the Plus and Minus Directional Indicators (+DI & -DI) used to determine the direction of the trend
"ADX Limit" ________________________// A level of ADX used as the boundary between Trend Market and Sideways Market
"Smoothing Factor"__________________// Factor used for smoothing the oscillator
"Lag"______________________________// lag used to match indicator and chart
Resources:
www.investopedia.com

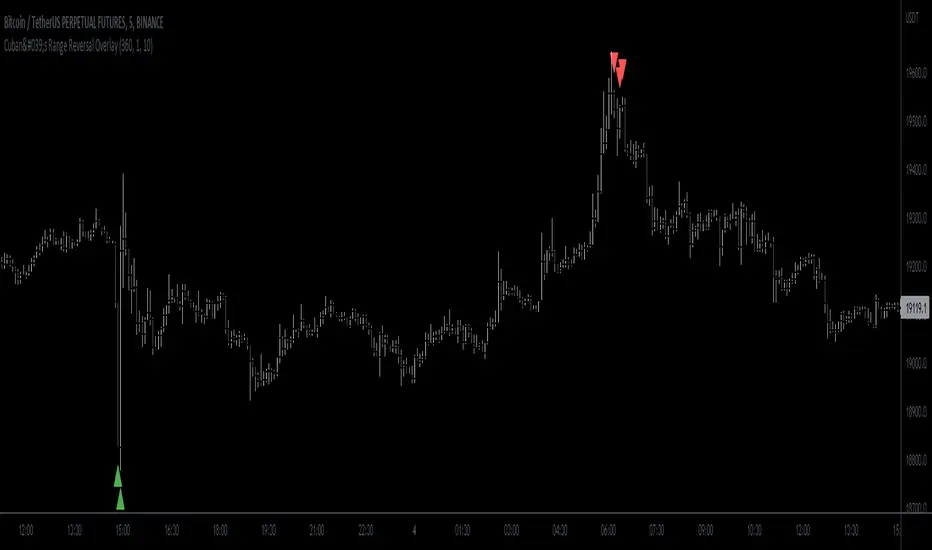
Cuban's Range Reversal OverlayBeen a minute since a public script!
This one looks at the range and recommends potential reversal depending on degree of overextension.
Originally intended for low timeframe short time horizon reversals but works well on higher timeframes as well.
Oscillator included in the image so you can see under the skirt and check what's happening.
Box Range AlertSimple Script for getting alerts on the crossing of Upper & Lower levels either way.
Good for Free users as they can only use 1 alert at a time. So this indicator will be useful to get alerts on both Breakout Or Breakdowns.
Just add input Price manually and set alerts.

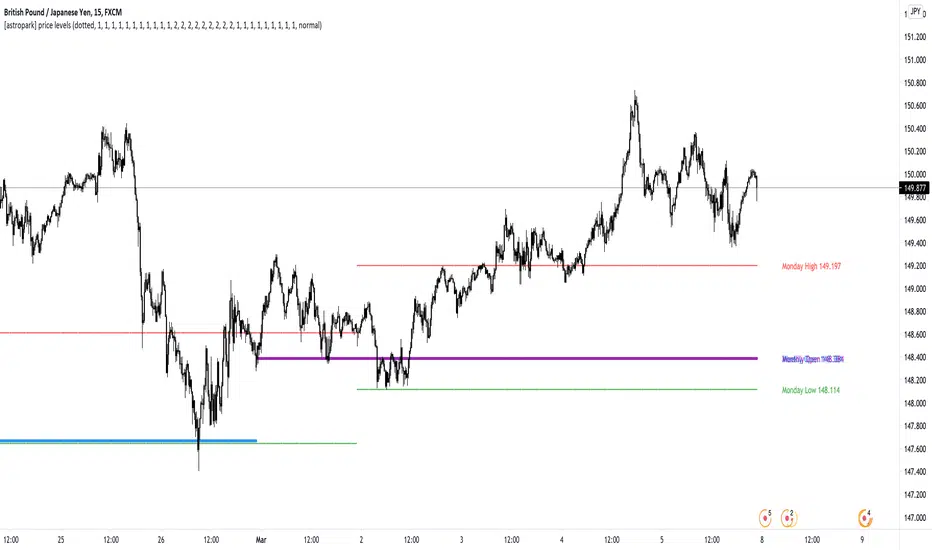
[astropark] price levelsDear Followers,
today another awesome Analysis Tool, that you can use in your trading journey: Price Levels !
Are you a range trading player? a scalper? or maybe a day-trader or a swing-trader? This is for you then. Indeed it's for everyone.
This indicator works on every timeframe, market and pair.
It keeps track of recent important levels generated by price action:
Monday high, low and middle range level
Tuesday high and low
Wednesday high and low
Thursday high and low
Friday high and low
Weekly open, high and low
Monthly open, high and low
Yearly open, high and low
Previous weekly open, high and low
Previous monthly open, high and low
Previous yearly open, high and low
You can:
choose price levels to hide and show
change each level color / thickness / display style (solid or dotted)
choose to show or hide price labels and change their size
Why such indicator should be helpful? How can I use it to do profit?
In multiple ways! Let's talk about Monday Range :
when Monday range is formed, price acceptance below Monday low is a bearish signal, so will more likely want to short / sell
equally price acceptance above Monday high is a bullish signal, so will more likely want to long / buy
it can happen that Monday high is simply retested, with price not being able to stay above it: this is called a retest (in case of a simple wick) or a deviation (in case of price staying above the level just for some candles) and what usually happens is price falling back to Monday middle range level and even back to Monday low.
the opposite can happen of course: you will become bullish if Monday low is tested or a deviation appears below Monday low: price tends to bounce on such occasions back to Monday middle range or even Monday high
Tuesday is usually a marker day within a trading week:
if Monday was pretty bullish, Tuesday high may mark the weekly top, following some red days
if Monday was pretty bearish, Tuesday low may mark the weekly bottom, following some green days
Thursday is the day when big players start to take profits, as the trading week is going to end the next day, so in an all-green week Thursday may be a red one, while in an all-red week it may be a bullish day
Thursday is the day when big players start to take profits, as the trading week is going to end the next day:
in an all-green week, Thursday may be a red one and it's low tends to mark the weekly low
while in an all-red week, it tends to be a bullish day, so here you will refill your shorts for the next blooding day
Let's talk now about the Weekly, Monthly and Yearly price levels : here it is the interesting part for Swing Traders
Weekly open is usually a defining level: on retest, if price keeps staying below then more downside is expected, if price keeps staying above then more upside is expected (similarly to what we said about Monday high and low)
Monthly and Yearly open price levels are usually a "no-brainer" buy level in a bullish trend or equally a sell level in a bearish trend: in this scenarios, a deviation structure is even more powerful in term of price reaction and efficiency
We trade Weekly, Monthly and Yearly high and low price levels as explained for the Monday high and low, but with a swing traders perspective (so a medium-long term trade)
Previous Weekly/Monthly/Yearly price levels are usually very useful as targets in your trades
Here below some screenshots that resumes what said above.
Weekly Open as support (bullish) and Monday High deviation (bearish)
Tuesday High, Weekly Open failing as support: bearish
Monday Low deviation (bullish)
Price Acceptance above Monday High and Weekly Open (bullish)
Yearly Open retests as buy opportunities
Deviation below Monthly Open (bullish), Price Acceptance below Monthly and Yearly Open (bearish)
This is a premium indicator , so send me a private message in order to get access to this script.
Viper Futures Range Bar CandlesThe Range Bars used in more Professional trading platforms to keep smoothness on the charts and help make custom range price candles based on the range size chosen for the market being traded. Example an 8 Range bar on the ES or MES Futures is 8 ticks = 2 points. Another Example on NQ a 22 Range bar popularly traded by trading professionals is a total of 22 ticks = 5 1/2 points on the Nasdaq or Micro NQ futures. Simple add to charge, set the range bar setting with a particular range setting in mind and then for clarity uncheck the original price chart on top left corner, same way you would disable an indicator temporarily. Works very clear and nice. A good accommodation for trading View as trading view does not offer historical tick data to use Renko bars very well at the moment.
Basically plots a candle rather then a OHLC bar for Range Bars on TV!
Default color was set to my Viper Futures Chart, you can change back to green/red, etc.
Enjoy!
User-Inputed Time Range & FibsGreetings Traders! I have decided to release a few scripts as open-source as I'm sure others can benefit from them and perhaps make them better.(Be sure to check my Profile for the other scripts as well: www.tradingview.com).
This one is called User-Inputed Time Range & Fibs.
The idea behind this script is to record the Range Highs and Lows of a User Defined Period, and plot potential Targets based on either Fibonacci Extensions or a Multiple of the Range Size. I created this originally for use with the US Session Initial Balance(From 9:30-10:30AM EST), however it can be set to any time period.
What is Initial Balance? In simple words, Initial Balance (IB) is the price data, which are formed during the first hour of a trading session. Activity of traders forms the so-called Initial Balance at this time. This concept was introduced for the first time by Peter Steidlmayer when he presented the market profile to traders(atas.net).
The IB is monitored as a break-out area for Range Extension traders. The IB High is also seen as an area of resistance and the IB Low as an area of support until it is broken(www.mypivots.com).
As a note, depending on the Time Zone you are in, you may need to manually add or subtract from the Timed Range to match the desired Time. For example in NY Eastern Time, I have to use 8:30-9:30AM to Capture the 9:30-10-30AM IB for ES and NQ. Similarly, I must use 14:30-15:30PM to Capture the 9:30-10-30AM IB for BTC. You will need to make adjustments based on the Time Zone you are located in.
I wanted to give a Special Thanks to @PineCoders for the Custom Rounding Function from Backtesting/Trading Engine--> (), Pinecoders.com for help with Tracking the Highs/Lows--> (www.pinecoders.com), and @TradeChartist for allowing me to use some of the code for the Fibonacci Extensions from his script here--> ().
If you like User-Inputed Time Range & Fibs, be sure to Like, Follow, and if you have any questions, don't be afraid to drop a comment below.

Range & Trend (Zeiierman)█ Overview
Range & Trend (Zeiierman) is a trend-first mapping of price that fuses an adaptive Range & Trend Line, a Trend Buffer (noise gate), a volatility-aware Trend Tracker, and optional Range Levels & Candles to reveal where trend is establishing, compressing, or handing off to a ranged regime.
Execution is guided by graded Buy/Sell labels (Regular / Plus / Strong), structural HH/HL & LL/LH markers with optional Peak Profit readouts, and a multi-TF Timeframe Scanner for alignment.
⚪ Why This One Is Unique
Unlike single-source trend lines, this version layers two orthogonal stabilizers:
a Range & Trend core that adapts its band size to volatility and dispersion, and
a dynamic smoothing buffer that dampens insignificant fluctuations, ensuring only meaningful trend movements affect signal output.
Signals are graded (Regular / Plus / Strong) based on contextual conditions, allowing traders to gauge the conviction behind each trend event. Range Candles add regime context by coloring bars only when a statistically consistent range structure forms, highlighting potential consolidation or transitional market phases. A lightweight Timeframe Scanner completes the workflow, broadcasting alignment from intraday to daily without adding chart clutter.
█ Main features
⚪ Range & Trend Line – Signal Generator
Adaptive directional mapping forms the foundation of the system. It highlights the active trend through color transitions and generates graded Buy/Sell labels (Regular / Plus / Strong) to reflect the strength of confirmation. The line responds dynamically to volatility, revealing when momentum is expanding, stabilizing, or reversing.
Unlike typical reactive signal tools, this model isolates only the most strong and meaningful trend transitions — those with the structural weight to establish or extend a new long-term directional phase. Each signal represents a filtered, high-conviction shift rather than a short-term fluctuation.
⚪ Trend Buffer (Noise Gate)
A precision filter that smooths the core trend output and suppresses false flips caused by short-term noise. It enhances visual consistency and provides the confirmation layer used to promote Regular signals to Plus strength when agreement occurs between buffer and core.
⚪ Trend Tracker
A trailing validation line that tracks directional health and trend persistence. It advances only in the direction of the active move, creating an adaptive stop-like reference. Tracker alignment helps identify trend exhaustion and contributes to Strong-grade signal confirmation.
⚪ Range Levels & Candles
Contextual zones that identify periods of compression or balance. When a valid range forms, candles are shaded within it, distinguishing ranging environments from trending conditions. These zones help anticipate breakouts and define natural support and resistance areas.
⚪ Live Structure (HH/HL & LL/LH with Peak Profit)
Displays real-time structural evolution — Higher Highs/Lows during uptrends and Lower Highs/Lows during downtrends. The optional Peak Profit label shows performance since the last regime change, offering an immediate view of current trend efficiency.
⚪ Timeframe Scanner
A compact multi-timeframe alignment panel that visualizes bullish or bearish trend states across user-selected intervals. It provides fast confirmation of directional consensus, helping traders act only when the broader structure supports their chosen bias.
█ How to Use
⚪ Range & Trend Line – Signal Generator
The Range & Trend Line is the core signal engine — its color shifts mark confirmed directional changes. This is where the system produces the graded Buy/Sell signals shown as ▲ / ▼ labels. Each grade reflects how many internal layers agree at the moment of signal creation:
Regular (▲ / ▼) – Triggered by a confirmed flip in the Range & Trend core. It appears when the base trend direction changes and is the earliest signal of potential reversal.
Plus (▲ + / ▼ +) – Requires the Trend Buffer to confirm the same direction. This upgrade indicates stronger trend agreement and higher reliability.
Strong (▲ ++ / ▼ ++) – These are high-conviction continuation signals and typically occur after structural confirmation.
How to trade them: Regular signals provide early awareness; Plus signals suggest confirmation; Strong signals mark trend maturity or high-probability continuations. Always trade in the direction of the prevailing trend. Use the Trend Buffer or Live Structure to confirm the dominant directional bias before acting on a signal.
⚪ Support and Resistance
The Range & Trend Line and the Buffer Line can act as dynamic support and resistance zones. Price often reacts around these levels, confirming whether the current move is continuing or losing strength.
Look for confirmation or rejection signals near these lines. Reactions around them often mark key decision points within the active trend.
⚪ Range Levels & Candles
Highlights when price enters structured consolidation zones. Candle coloring activates only inside validated ranges, helping to identify areas that show the typical characteristics of a ranging market. These zones visually separate balanced conditions from active trends and provide context for potential transitions.
Watch how price reacts around the upper and lower range levels. Look for false or confirmed breakouts, and expect price to move between these boundaries until a clear breakout develops. Range edges can also serve as practical entry or stop zones.
█ How It Works
⚪ Range & Trend Core
The main engine that defines the chart’s directional trend line. It adapts to changing market conditions, showing a smooth and reliable view of trend strength and direction.
Calculation: Builds a range-adaptive structure whose width adjusts with current volatility. The core moves toward new highs or lows but limits pullbacks to avoid false shifts. Several smoothing methods work together to create a steady, low-lag trend path.
⚪ Trend Buffer (Noise Gate)
A stabilizing layer that keeps the main trend line steady when price noise increases. It improves visual clarity and helps confirm true direction before a trend update appears.
Calculation: Uses a feedback-based update that reacts more when movement is strong and less when noise dominates. This lets the buffer ignore minor fluctuations while staying responsive to real trend changes.
⚪ Trend Tracker
A support line that follows the main move and helps confirm when a trend remains intact. It also serves as a guide for managing active positions.
Calculation: Applies a one-way trailing system that only moves in the direction of the trend. The offset adjusts with volatility, keeping a consistent distance that tightens or widens with market energy.
⚪ Buy/Sell Signal Engine (Regular / Plus / Strong)
The signal system that classifies entries by strength and confirmation level. It reacts to real-time trend changes while filtering weak reversals.
Calculation: Detects state flips in the Range & Trend Core, checks for agreement with the buffer, and rates each signal by historical pattern support. Higher-grade signals appear only when several layers confirm continuation strength.
⚪ Range Levels & Candles
Identifies short-term balance zones and highlights candles within those areas. These zones show where price pauses before the next directional move.
Calculation: Finds upper and lower range limits based on recent highs and lows, confirming only when several bars form a stable zone. Candle colors and level lines extend slightly forward to show likely reaction areas.
⚪ Swing Points & Peak Profit
Marks key turning points and measures performance since the last reversal. It helps track the strength and duration of each movement.
Calculation: Keeps a short memory of recent pivots and updates only when a new high or low replaces the last one. The percent distance from the last flip to the current bar defines the live Peak Profit reading.
⚪ Timeframe Scanner & Alert Aggregator
Combines directional data from multiple timeframes into a single view. Alerts trigger only when all selected timeframes agree.
Calculation: Gathers the trend state from each timeframe, converts it to a simple up or down value, and compares the results. When every layer matches your chosen direction, one clear, high-confidence alert is sent.
-----------------
Disclaimer
The content provided in my scripts, indicators, ideas, algorithms, and systems is for educational and informational purposes only. It does not constitute financial advice, investment recommendations, or a solicitation to buy or sell any financial instruments. I will not accept liability for any loss or damage, including without limitation any loss of profit, which may arise directly or indirectly from the use of or reliance on such information.
All investments involve risk, and the past performance of a security, industry, sector, market, financial product, trading strategy, backtest, or individual's trading does not guarantee future results or returns. Investors are fully responsible for any investment decisions they make. Such decisions should be based solely on an evaluation of their financial circumstances, investment objectives, risk tolerance, and liquidity needs.
Ücretli komut dosyası

Trend-Range IdentifierTrend trading algorithms fail in ranging market and Swing trading algorithm fail in trending market. Purpose of this indicator is to identify if the instrument is trending or ranging so that you can apply appropriate trading algorithm for the market.
Process:
ATR is calculated based on the input parameter atrLength
Range/Channel containing upLine and downLine is calculated by adding/subtracting atrMultiplier * atr to close price.
This range/channel will remain same until the price breaks either upLine or downLine.
Once price crosses one among upLine and downLine, then new upLine/downLine is calculated based on latest close price.
If price breaks upLine, the trend is considered to be up until the next line break or no lines are broken for rangeLength bars. During this state, candles are colored in lime and upLine/downLine are colored in green.
If price breaks downLine, the trend is considered to be down until the next line break or no lines are broken for rangeLength bars. During this state, candles are colored in orange and upLine/downLine are colored in red.
If close price does not break either upLine or downLine for rangeLength bars, then the instrument is considered to be in range. During this state, candles are colored in silver and upLine/downLine are colored in purple.
In ranging duration, we display one among Keltner Channel, Bollinger Band or Donchian Band as per input parameter : rangeChannel . Other parameters used for calculation are rangeLength and stdDev
I have not fully optimized parameters. Suggestions and feedback welcome.

SuperTrendRange by DGTSuperTrendRange study attempts to determine the state of the market
• whether a well-established bull/bear trend is present
• whether the market is trading in a range
SuperTrendRange (STR) takes into account the volatility of the market - further details regarding volatility can be found in the description of “Volatility Bands by DGT” study
Due to its similarities to SupertTrend (ST) and Parabolic SAR (SAR), I will try to explain by stating differences between them
SuperTrendRange uses both the ATR (Average True Range) and STDEV (Standard Deviation) as part of its calculations - unlike ST and SAR where they use only ATR
Sensitivity of the indicator is adjusted using the multiplier setting of both ATR and STDEV
Additionally, unlike ST, the source of the basis of SuperTrendRange can be selected among the assets price value or its moving average
Source and Length are adjustable too
The SuperTrendRange, like Parabolic SAR indicator, appears on a chart as a series of dots, either above, below or unlike Parabolic SAR both above and below of the asset's price
A dot placed
- below the price when the market is trending upward
- above the price when it is trending downward
- both above and below when the price starts moving sideways – this is a feature that both SuperTrend and Parabolic SAR misses, where they are known to produce false signals and losing trades, whereas SuperTrendRange emphasis the zones of the ranges occurring and in most cases are considered no trade recommended zones. Please note that the range width may vary depending on how the market is volatile. It is up to the users to trade if it fits their trading strategies
Dots plotted above and below can be assumed as Support and Resistance levels
Example usages – with trading opportunities
Gold Monthly Chart
Bitcoin Daily Chart
Disclaimer:
Trading success is all about following your trading strategy and the indicators should fit within your trading strategy, and not to be traded upon solely
The script is for informational and educational purposes only. Use of the script does not constitute professional and/or financial advice. You alone have the sole responsibility of evaluating the script output and risks associated with the use of the script. In exchange for using the script, you agree not to hold dgtrd TradingView user liable for any possible claim for damages arising from any decision you make based on use of the script

Rolling ATR Channel (Expo)Rolling ATR Channel (Expo) is a sophisticated indicator that identifies the underlying trend as well as identifies ATR based trading ranges. In a trending market, the price will be within the Upper or Lower band. If the market is in a trading range , the price will bounce between the upper and lower ATR zones, until the price breaks through and creates a new trend. The user will no longer have to guess in which state the market is in, the indicator displays it clearly.
So, the indicator displays real-time Range (ATR based) support and resistance zones as well as if the market is in a trend.
If you know the current market state, you have the ability to choose the most applicable market strategy.
Real-time
No repainting
Works on any market and in any timeframe
HOW TO USE
- Use the indicator to identify trading range support and resistance zones.
- Use the indicator to identify when the price breaks through the trading range.
- Use the indicator to identify if the market is in a trend.
INDICATOR IN ACTION
4 Hour chart
I hope you find this indicator useful , and please comment or contact me if you like the script or have any questions/suggestions for future improvements. Thanks!
I will continually work on this indicator, so please share your experience and feedback as it will enable me to make even better improvements. Thanks to everyone that has already contacted me regarding my scripts. Your feedback is valuable for future developments!
-----------------
Disclaimer
Copyright by Zeiierman.
The information contained in my scripts/indicators/ideas does not constitute financial advice or a solicitation to buy or sell any securities of any type. I will not accept liability for any loss or damage, including without limitation any loss of profit, which may arise directly or indirectly from the use of or reliance on such information.
All investments involve risk, and the past performance of a security, industry, sector, market, financial product, trading strategy, or individual’s trading does not guarantee future results or returns. Investors are fully responsible for any investment decisions they make. Such decisions should be based solely on an evaluation of their financial circumstances, investment objectives, risk tolerance, and liquidity needs.
My scripts/indicators/ideas are only for educational purposes!
-----------------
ACCESS THE INDICATOR
• Contact me on TradingView or use the links below

DTC_ZoneThis Indicator can be used for finding the supply and demand zone. Supply and demand has been fetched from the past 10 days volatility of the particular stock. And the main thing is the target and stop-loss were arrived based on the Fibonacci retracement.

TradeChartist Range Bands ™TradeChartist Range Bands is an exceptionally well designed Entry/Exit indicator that plots fluid Range Bands and dynamic Support/Resistance levels on chart, along with trade entries by using both trend following and mean reversion principles.
===================================================================================================================
How does ™TradeChartist Range Bands work?
The Indicator plots Range Bands with Upper, Lower and Mean, calculated using trading models that use both Trend Following and Mean Reversion principles . It is the Range Bands that decide the trade Entries as the breakouts above upper band generates long entries and the breakouts below the lower band generates the short entries.
The Range Bands Type (Automatic, Aggressive or Normal) can be chosen from the settings. Default is Automatic and it uses Aggressive for non 24 hr markets and Normal for 24 hr markets like Cryptocurrencies.
The width of the Range Bands can be changed using the Range Multiplier from the settings. Default is 1.618 , minimum value is 0.618 and maximum value is 2.0.
The frequency of the Trade Signals depends on both Range Bands type and Range Multiplier. So it is worth spending some time to test the indicator based on these 2 factors on the asset traded, to maximise the profit potential by optimising the type and multiplier value.
In addition to the Range Bands, the indicator also plots Dynamic Support and Resistance bands that are more sensitive to price action and helps the user determine growing support/resistance which is indicated by coloured dots. These dots normally appear when the Support or Resistance stays at the same level for a few bars.
The expansion and contraction of the Support and Resistance bands also help in visualising the price volatility, and an extremely narrow squeeze of these levels within the Range Bands normally signals a lucrative market move. This is usually followed by a breakout from the bands and will be signalled by the Trade Entry plots (BUY and SELL).
The Dynamic Support and Resistance levels can be enabled or disabled from the settings. The fill between these dynamic levels helps the user to visualise the Bull and Bear strength/power. This fill can also be disabled from the settings if not required.
The indicator has a nice Fibonacci levels generator companion that helps spot near support and resistance levels using Fibonacci Retracement tool.
There are 3 types of Fib plots that can be chosen from the settings - Auto-Fibs, Fibs based on Lookback, Fibs based on Price Input .
The Auto-Fibs feature is used as default and it automatically plots fib retracement based on nearby significant high/low (highest from previous up and down trends). This is normally based on nearby trade entries too. Occasionally, during choppy markets/sideways movement, the range of these levels can be quite small and if close price exceeds the 4.618 fib level, one of the other Fib plot options can be used. Alternatively, Plot fibs from current high/low can also be used.
Fibs based on lookback can be used by choosing the number of candles or days lookback to help the indicator automatically find the high and low of the period to generate fib levels. Similarly, Fibs based on price input requires, user to manually enter the high and low price points for the indicator to generate fib levels based on user input.
The indicator has two colour schemes for the Dynamic Support/Resistance fill and bar colours. The coloured bars and the fill will help visualise the price trend. This can be changed or disabled from the settings.
The Fib levels can be disabled by unchecking lines and labels from the styles tab of indicator settings.
Long and Short entry Alerts can be created by using Once Per Bar Close .
The indicator does not repaint. Alerts may display potential repaint warning, but this is because the code uses bar index for fib labels. For confidence in the indicator, it can be tested using bar replay to make sure the real-time and bar replay trade entries and plots stay on the same bar/timestamp.
The different elements of the indicator are shown below in the chart.
===================================================================================================================
™TradeChartist Range Bands can also be connected to ™TradeChartist Plug and Trade to generate Targets, Stop Loss Plot etc. and other alerts can also be created. Use Range Bands Trend Identifier to connect as an Oscillatory Signal to Plug and Trade. Example chart shown below.
===================================================================================================================
Example charts:
1. ADA-USDT 4hr chart using Aggressive type and 1.618 Range Multiplier
2. ADA-USDT 4hr chart using Normal type and 1.618 Range Multiplier
3. XAU-USD 15m chart using Normal type and 1.618 Range Multiplier - Fibs based on 3 days lookback
4. DJI 4hr chart using Normal type and 2.0 Range Multiplier
5. GBP-USD 15m chart using Normal type and 1.618 Range Multiplier
6. LINK-USDT 1hr chart using Normal type and 1.236 Range Multiplier
===================================================================================================================
Best Practice: Test with different settings first using Paper Trades before trading with real money
===================================================================================================================
This is not a free to use indicator. Get in touch with me (PM me directly if you would like trial access to test the indicator)
Premium Scripts - Trial access and Information
Trial access offered on all Premium scripts.
PM me directly to request trial access to the scripts or for more information.
===================================================================================================================

Hancock - Renko Brick ProductionThis is the accompanying script that shows how many renko bricks were produced in each direction per candle. It gives a basic indication of volatility, some might find it useful.
Happy trading
Hancock

Hancock - RenkoThis is the first release of Renko indicator.
Renko is plotted over candles and best calculates the number of Renko bricks printed up or down per candle which can be viewed from the data window. It plots the high and low of a the bricks, if numerous bricks are printed on a candle, as well as the open and close of a Renko brick.
This will be actively developed and improved over the next few months and i will be basing other indicators from this Renko.
Happy trading
Hancock

Kalihari_Brothers_ORBEasy to use ORB(Opening Range Breakout)..
Multiple Time frame (15minute,30minute,60minute ) and special strategy 12 PM 15min ORB...
Opening Range depend upon time frame market makes own high and low..
Whenever price breaks high of Opening Range make long position and simultaneously whenever price breaks low of Opening Range make short position..

Kalihari_Brothers_PRBBasic principle support ,resistance and flipping of support n resistance (support becomes resistance ,resistance becomes support)..
DRB- Previous Day Range High ( PDH ) and Low ( PDL )
WRB- Previous Week Range High (PWH) and Low (PWL)
MRB - Previous Monthly Range High (PMH) and Low (PML)
It gives Trending Market Signal for bullish (price breaks PDH range continuous in up direction and make support)
and similarly for bearish (price breaks PDL range continuous in down direction and make resistance)..
For sideways/Non-trending market stay with in a range not break high and low..(stay away from it)..
DRB act as minor support and resistance ..
WRB and MRB act as major support and resistance ...

cATRpillerThis indicator is used to identify range breakouts using an ATR multiplier. My first script, Im sure there are indies out there like this, but this my favorite way to identify breakouts and trends.
