eBacktesting - Learning: BreakoutseBacktesting - Learning: Breakouts highlights ranges & breakout behaviors in a clean, visual way.
It automatically:
- Detects consolidation ranges (tight price action) and draws a range box
- Marks a breakout only when a candle CLOSES outside the range (no wick-only breakouts)
Adds a label on the breakout candle (↑ bullish breakout / ↓ bearish breakout)
These indicators are built to pair perfectly with the eBacktesting extension, where traders can practice these concepts step-by-step. Backtesting concepts visually like this is one of the fastest ways to learn, build confidence, and improve trading performance.
Educational use only. Not financial advice.
Ranges

HTF Current/Average RangeThe "HTF(Higher Timeframe) Current/Average Range" indicator calculates and displays the current and average price ranges across multiple timeframes, including daily, weekly, monthly, 4 hour, and user-defined custom timeframes.
Users can customize the lookback period, table size, timeframe, and font color; with the indicator efficiently updating on the final bar to optimize performance.
When the current range surpasses the average range for a given timeframe, the corresponding table cell is highlighted in green, indicating potential maximum price expansion and signaling the possibility of an impending retracement or consolidation.
For day trading strategies, the daily average range can serve as a guide, allowing traders to hold positions until the current daily range approaches or meets the average range, at which point exiting the trade may be considered.
For scalping strategies, the 15min and 5min average range can be utilized to determine optimal holding periods for fast trades.
Other strategies:
Intraday Trading - 1h and 4h Average Range
Swing Trading - Monthly Average Range
Short-term Trading - Weekly Average Range
Also using these statistics in accordance with Power 3 ICT concepts, will assist in holding trades to their statistical average range of the chosen HTF candle.
CODE
The core functionality lies in the data retrieval and table population sections.
The request.security function (e.g., = request.security(syminfo.tickerid, "D", , lookahead = barmerge.lookahead_off)) retrieves high and low prices from specified timeframes without lookahead bias, ensuring accurate historical data.
These values are used to compute current ranges and average ranges (ta.sma(high - low, avgLength)), which are then displayed in a dynamically generated table starting at (if barstate.islast) using table.new, with conditional green highlighting when the current range is greater than average range, providing a clear visual cue for volatility analysis.

RTH and ETH RangesKey Functions :
Visualizes Regular Trading Hours (RTH) and Extended Trading Hours (ETH) price ranges
Tracks session highs, lows, and 50% levels where significant market reactions occur
Detects breakouts beyond previous session extremes
Trading Applications :
Exposes potential liquidity raids at session boundaries where smart money targets stop orders
Identifies critical price thresholds where institutional activity concentrates
Highlights divergences between RTH and ETH behavior that precede directional moves
Provides measurement of session volatility differences
Maps key price levels for objective entry and exit parameters
Reveals market dynamics at session transitions where institutional positioning changes

Midnight Opening Ranges[TDL]Midnight Opening Range Indicator for TradingView
Description:
The Midnight Opening Range Indicator as taught by Micheal J. Huddleston is a powerful tool designed for traders who want to analyze price action during the critical midnight to 00:30 timeframe. This indicator highlights the opening range for both the current day and previous days, providing valuable insights into market behavior during this specific period. It also calculates and displays deviations from the opening range, as well as allows for custom opening prices to be set, making it highly adaptable to your trading strategy.
Key Features:
Today's Opening Range (00:00 - 00:30):
The indicator plots the high and low of the price range between 00:00 and 00:30 for the current day.
This range is highlighted on the chart, making it easy to identify the initial market movement and potential support/resistance levels.
Previous Days' Opening Ranges:
The indicator also displays the opening ranges for previous days, allowing you to how price reacts off of previous days ranges not just todays.
This feature helps in identifying patterns or recurring behaviors in the market in which price uses this range and previous days ranges throughout the trading day.
Deviations from the Opening Range:
The indicator calculates and plots deviations from the opening range, both above and below the high and low of the range.
These deviations can be used to identify potential breakout or reversal points, giving you an edge in anticipating market moves.
Custom Opening Prices:
The indicator allows you to set custom opening prices, which can be useful if you want to analyze the market based on a specific reference point rather than the default midnight opening.
This feature is particularly useful for traders who follow alternative trading sessions or have specific entry criteria.
Customizable Visuals:
The indicator offers customizable colors and styles for the opening range, deviations, and custom opening prices, allowing you to tailor the visual representation to your preferences.
How to Use:
Identify Key Levels: Use the highlighted opening range to identify key support and resistance levels for the day.
Monitor Deviations: Watch for price movements beyond the opening range deviations to spot potential breakouts or reversals.
Previous Range Data: Use previous days to identify areas of potential AMD.
Set Custom Prices: Adjust the custom opening price to align with your trading strategy or session preferences.
Ideal For:
Day Traders: Perfect for traders who focus on the early hours of the market to capture initial momentum.
Swing Traders: Useful for identifying key levels that could influence price action over several days.
Algorithmic Traders: Can be integrated into automated trading systems to trigger trades based on the opening range and deviations.
Conclusion:
The Midnight Opening Range Indicator is an essential tool for any trader looking to gain an edge in the market by focusing on the critical midnight to 00:30 timeframe. With its ability to highlight opening ranges, calculate deviations, and accommodate custom opening prices, this indicator provides a comprehensive view of market behavior during this pivotal period. Whether you're a day trader, swing trader, or algorithmic trader, this indicator will help you make more informed trading decisions.

Roman's Ranges(GOLD FUTURES)This indicator provides the user with Gold Future's previous day’s range and how long it took for the price to reach its first extreme for the day. This information is used to predict the most probable daily direction trend and estimate how long you should expect to hold your winning trade. The distance and time are based on the market open candle (6:30 am). It measures from the retracement wick of the candle to the last 5m close of the day’s first extreme low or high point. It also includes that distance in pts.
Previous market data does not guarantee future results, however, you can leverage the knowledge of the previous day’s ranges to set reasonable take profit levels and when your target is not met automatically, you know how long it took on the previous day to reach the day’s first low/high. If you are nearing that amount of time and your trade is not as profitable as expected, it is easier to get out with less profits using this estimated time rather than hoping the market closes in your favor.
Markets go through cycles and it can be difficult to trade them all if you have a fault expectation how how far the price is expected to move. Price tends to deviate slowly from the average ranges slightly day after day, but you can expect an average range to prevail throughout the week +/- 3 points. It can be very easy to be stuck on 5-point take-profit levels that you don’t pay attention to the average range being twice or three times that distance. The same can be said for the opposite scenario with having higher profit expectations than reasonably possible.
This indicator and my statements are not financial advice. This is meant for educational purposes only.

Previous Day and Week RangesI've designed the "Previous Day and Week Ranges" indicator to enhance your trading strategy by clearly displaying daily and weekly price levels. This tool shows Open-Close and High-Low ranges for both daily and weekly timeframes directly on your trading chart.
Key Features :
Potential Support and Resistance: The indicator highlights previous day and week ranges that may serve as key support or resistance levels in subsequent trading sessions.
Customizable Display Options: Offers the flexibility to show or hide daily and weekly ranges based on your trading needs.
Color Customization: Adjust the color settings to differentiate between upward and downward movements, enhancing visual clarity and chart readability.
This indicator is ideal for traders aiming to understand market dynamics better, offering insights into potential pivot points and zones of price stability or volatility.

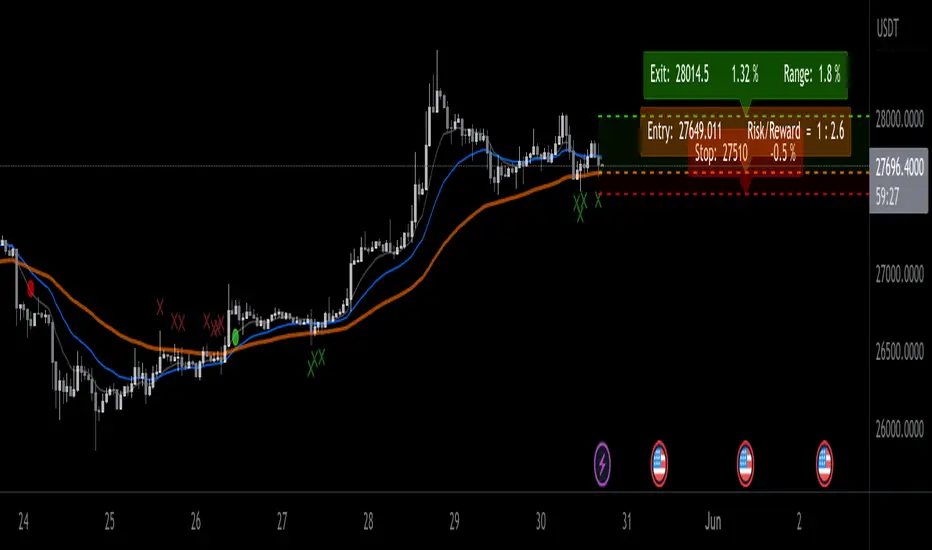
EMA ProHi Traders!
This Improved EMA Cross Pro Indicator does a few things that Ease Up Our Charting.
Personally it Saved me Tons of Time searching for structure highs / lows, measuring ranges and distances from my entry to stop or take profit.
It's like having most of your trade in front of you, charted for you.
Works Across Assets & Time Frames.
The Functions
1. Signals EMA Crosses - green for Bull Cross & Red for Bear Cross
2. Signals Touches to the 55 EMA
a. In a Bull Cross it will only signal touches and closes Above the 55
b. In a Bear Cross it will only signal touches and closes Under the 55
3. Plots Current Horizontals:
a. The current position of the 55
b. The last High & Low
4. Calculation:
a. % from the 55 to the High & Low
b. Risk / Reward Ratio ("Bad Risk Management" message appears if ratio is not favorable)
c. Over Range between the Low and the High
5. Labels - Current prices for all horizontals marked as Entry, Exit & Stop
Notes:
* This Indicator is Interchanging between bull and bear crosses, it recognizes the trend and adapts its high and low output.
* You Can and Should make your personal changes. everything can be changed in the settings inputs.
* You can Turn On & Off most functions in the settings inputs.
BYBIT:BTCUSDT.P
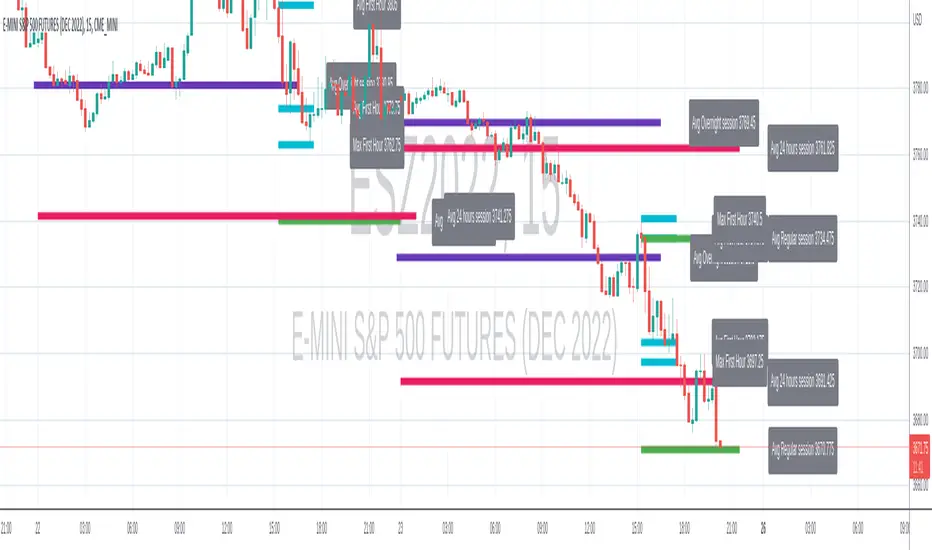
Range-AnalysisMarkets usually tend to stay within a range during a specific time frame (for example first hour of the regular trading session, the whole regular trading session). For traders before initiating a trade it can be helpful to determine the range potential left for the targeted time frame. So they can decide to either try to ride the current trend further or fade the current trend in the case there is no range potential left for the specific time frame. This could be especially helpful for example in the E-Mini S&P future during the first hour.
The script calculates the average range for the last x days of the session defined and plots a line at the expected range extremes based on that average (for example: RangeExtremeHigh would be currentSessionLow+average Range of the last x days.
Any feedback is appreciated.
High Low Open Mid Ranges & Levels (Multi-Timeframe)This indicator automatically plots the chosen timeframe's high, low, mid point and open. These levels on higher timeframes act as support and resistance levels on lower timeframes, helping find entries, stoploss and profit targets.
Most common timeframes to choose are Daily, 1W, 1M, and 3M. Other timeframes that are good include, 2D, 2W and 2M.
For example, you can see in the snapshot below, we are on the 4hr TF showing those levels from the 2W. This historical 2W zone (open and mid) was (and currently still is) resistance. You can see it also provided a good entry to go short.
This is also useful for intraday scalping. Below, we are on the 15min TF with levels set on the 2D timeframe. You can see how the Open and Mid levels acted as resistance, providing good entries on range trades, with take profit set at the previous 2D low.
There is also a table which tells you all the main TFs high, low, open, and mid levels. They are the most important ones to look out for.
This indicator should not be used in isolation; it is best to pair it up with other TA such as orderblocks, S/D zones, S&R or overlay indicators.

All past LevelsContains all past levels that we need
1. Previous Monthly High
2. Previous Monthly Low
3. Previous Weekly High
4. Previous Weekly Low
5. Previous Daily High
6. Previous Daily Low
7. Previous Monthly Range Average (PMH+PML)/2
8. Previous WeeklyRange Average (PWH+PWL)/2
9. Previous Daily Range Average (PDH+PDL)/2
10. Monthly Open
11. Weekly Open
12. Daily Open
MA Cross + KillzonesCombines oscarvs' BTC Killzones with four EMAs and the trader's 13/49 golden cross as well as the investor's 50/200 golden cross. Note that the killzones highlight the first two hours of market action in each of the three main crypto markets, so this time period will have to be adjusted for daylight savings time in April and in November.

Currency Pairs High Low RangeIndicator gives the High-Low range of 18 currency pairs. There is a High Ave which is the average of the top four (you may need to adjust which ones are in the average) as well as the bottom four Low Ave. The picture is of a weekly chart with the indicator set at 12 week average of the High-Low range with a .7 (70%) multiplier. When I am looking for week long trades with lots of movement I pick my pairs based on the most actives with a 70% capture of the range as a guide line of when to exit. Sometime when I am not in the mood for volatility I go with the ones in the Low Ave area. Further, when I day trade I set the indicator to a 1Day chart and move the percent to 20% or 30% as a guideline to tell when to get out of a trade.

3BBands (3 Spirolinas)The script combines 3 single Bollinger bands into one script for easy plotting and range modification. It can be used for analyzing a market with multiple time frames and ranges using Fibonacci series as the range.
