Predictive Ranges [LuxAlgo]The Predictive Ranges indicator aims to efficiently predict future trading ranges in real-time, providing multiple effective support & resistance levels as well as indications of the current trend direction.
Predictive Ranges was a premium feature originally released by LuxAlgo in 2020.
The feature was discontinued & made legacy, however, due to its popularity and reproduction attempts, we deemed it necessary to release it open source to the community.
🔶 USAGE
The primary purpose of this indicator is to provide potential support & resistance levels on the chart by estimating future trading ranges.
When the price reaches one of the upper/lower levels of the Predictive Ranges we can expect the price to reverse.
If the price exits the predicted range, new levels are given in real-time & they do not repaint. Higher "Factor" values allow returning longer term and wider ranges less susceptible to be exited.
🔹 Estimating Trend Directions
Users are able to easily estimate trend directions by looking at the central levels of the predictive ranges, which represent an estimate of the price central tendency.
If this central level increases it means the price is up-trending, if it is decreasing price is down-trending.
🔶 SETTINGS
Length: ATR Length used for the indicator calculation. Higher values will tend to return ranges of equal width.
Factor: Control the ranges width. Higher values will return less frequent ranges, each having a higher width.
Timeframe: Indicator timeframe output.
Source: Input source of the indicator. It is recommended to use input sources on the same scale as the price.
Rangebreakout

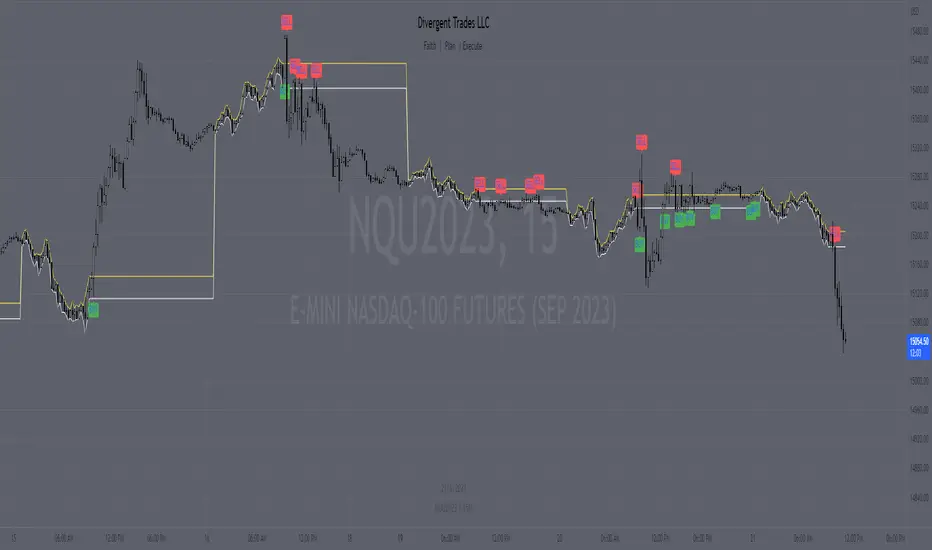
Range H/L Buy and Sell SignalThe "Range H/L Buy and Sell Signal" indicator is designed to identify potential buy and sell signals based on a specified price range and market volatility. This indicator can be used in the TradingView platform to assist traders in making informed decisions.
The indicator allows customization of several parameters to adapt to different trading strategies. These parameters include the start and end times for the price range, the volatility threshold, and the desired breakout conditions.
To begin, the indicator calculates the range start and end timestamps based on the provided hours and minutes. This defines the time period within which the indicator will analyze price movements.
Next, the indicator determines the highest high (High) and lowest low (Low) within the specified price range. These levels represent the upper and lower boundaries of the range and act as potential breakout points.
Volatility is also taken into account to filter out false signals. The indicator calculates the true range and the average true range over a period of 14 bars. The true range measures the price range from the current high to low, while the average true range provides an indication of market volatility.
Based on the breakout conditions and the volatility threshold, buy and sell signals are generated. A buy signal occurs when the closing price crosses above the High and the true range is greater than the volatility threshold multiplied by the average true range. Conversely, a sell signal is triggered when the closing price crosses below the Low and the true range exceeds the volatility threshold multiplied by the average true range.
The indicator visually displays the High and Low levels as plotted lines on the chart. Additionally, it marks the buy signals with green labels labeled "BUY" below the corresponding bars and the sell signals with red labels labeled "SELL" above the bars.
It is important to note that this indicator should be used in conjunction with other technical analysis tools and indicators for comprehensive market analysis. Trading always carries risks, and it is crucial to exercise caution and conduct thorough analysis before making any trading decisions.
Divergent Trades LLC:
Disclaimer: The information provided by the Divergent Trades LLC indicator is for educational and informational purposes only. It should not be considered financial advice or a recommendation to buy, sell, or trade any financial instrument. Divergent Trades LLC is not responsible for any losses incurred as a result of using this indicator. Trading in the financial markets carries a high level of risk and may not be suitable for all investors. Before making any investment decisions, please consult with a financial advisor and do your own due diligence. Past performance is not indicative of future results. By using the Divergent Trades LLC indicator, you acknowledge that you have read and understand this disclaimer and agree to its terms and conditions.
Day's First Candle High & Low and + or - 10 pointThis code is an indicator that calculates and plots the high and low of the first candle of the day, along with parallel lines. The purpose of the indicator is to help traders identify potential support and resistance levels for the day.
The code checks if a new day has started and, if so, calculates the high and low of the first candle of the day. It then plots the high and low as well as parallel lines that are 200 ticks (10 points) above and below the first candle's high and low, respectively.
The resulting plot shows the first candle's high and low, as well as the upper and lower boundaries that may act as support and resistance levels throughout the trading day.

Zazzamira 50-25-25 Trend System Alerts OnlyPublishing my trading system script. It consist of several conditions to happen in order to open a trade. Work best on ES/MES 5 minute timeframe.
I like to use it with this settings:
- UTC -6 (don't tick Exchange Timezone)
and rest as default
To enter a trade, the following conditions must be met: Entry 1: the opening range (8:30AM - 9:15AM UTC-6) must be defined and the price must close above or below the opening range on the 5-minute timeframe. This entry condition defines the trade direction (above = long / below = short). Once the opening range is defined, the Trend-Based Fib Extension is applied from the range high to the range low (and vice versa). Fib levels are required for Exit conditions. Entry 2: the 8 - 27 - 67 - 97 EMAs must be defined. If the EMAs value order is 8 > 27 > 67 > 97, long-only trades are allowed. If the EMAs value order is 8 < 27 < 67 < 97, short-only trades are allowed. This entry condition filters fake breakouts of Entry 1. Entry 3: no trades are allowed after 12:59 UTC-6 (2PM EST). Entry 4: if Entry 1, Entry 2, and Entry 3 conditions are valid and the price hasn't reached the 23.6% Fib line, an entry order can be set at the range high/long with 4 contracts. To exit a trade, the following conditions must be met: Exit 1 (Stop loss): set a trailing stop based on 2.1x ATR (14) from entry. Exit 2: take 50% profits at the 23.6% Fib and leave trailing stop untouched. Exit 3: if Exit 2 triggers, take 50% (25% of total entry) off at 61.8% Fib, leaving Exit 2 trailing stop values valid. Exit 4: exit the full position at the FIB 100% value. Exit 5: all trades must be closed at 3pm UTC-6 (4PM EST). So basically Take Profit are 50%-25%-25% of position.
Code has been written by © Hiubris_Indicators who has been an amazing coder and gave me the possibility to make this script public so a really big shoutout to him.
This indicator only works for alerts, please check version without alerts to backtest or tweaks. This indicator is meant to be used to automate the system via webhooks

Average HL Range - SATThis indicator dynamically display consolidation range base on three series ( high, low and close). it also display range breakout when a close occurs outside of the range. HeikinAshi and Diffrent Timeframe data can be requested to reduce the noise from the market. All setting are configurable : entryprice, takeprofits, Risk: REward, Dark Mode

Range Band (Expo)█ Overview
Range Band (Expo) measures an asset's volatility and price movements to plot the most relevant price range. Identifying ranges in trading is extremely important for traders to assess the current market and make informed decisions about when to enter and exit positions.
By identifying ranges, traders can identify support and resistance levels , and use these levels to determine when to enter and exit a trade. Ranges also help traders to identify potential entry and exit points and set stop-loss and take-profit levels. Additionally, ranges can help traders to identify potential trends and reversals .
█ How to use
Identify potential trading opportunities
For example, if the price is bouncing between the upper and lower range bands, it may indicate that traders could potentially profit from short-term contrarian trades. Similarly, if the price is trading near the upper or lower range band, it may indicate that traders could potentially profit from long-term trend trades.
Price Ranges and SR Levels
Range bands help traders identify price ranges that are likely to be profitable. It is a graphical representation of price movement and is typically used to identify support and resistance levels. Range bands are also used to identify potential entry and exit points.
Trends
Range bands are used in to identify trends.
Reversals
Range bands are used in technical analysis to identify potential reversal points.
Overbought and Oversold
When the price reaches the upper range band, it may indicate that the asset is overbought and that the price is likely to fall. When the price reaches the lower range band, it may indicate that the asset is oversold and that the price is likely to rise.
-----------------
Disclaimer
The information contained in my Scripts/Indicators/Ideas/Algos/Systems does not constitute financial advice or a solicitation to buy or sell any securities of any type. I will not accept liability for any loss or damage, including without limitation any loss of profit, which may arise directly or indirectly from the use of or reliance on such information.
All investments involve risk, and the past performance of a security, industry, sector, market, financial product, trading strategy, backtest, or individual's trading does not guarantee future results or returns. Investors are fully responsible for any investment decisions they make. Such decisions should be based solely on an evaluation of their financial circumstances, investment objectives, risk tolerance, and liquidity needs.
My Scripts/Indicators/Ideas/Algos/Systems are only for educational purposes!

CAT Month Opening RangeA trading range which is formed during the first three trading day of any month sets an important "Month Opening Range".
The lowest price made during the first three trading days can be considered the Monthly Support level (see the green line drawn by the indicator).
The highest price made during the first three trading days can be considered the Monthly Resistance level (see the red line drawn by the indicator).
In an Up trending market price tends to break over the upper edge of the Month Opening Range and keep moving higher at the very least until the middle of that month.
In an Up trending market once price broke out of the Month Opening Range, the Monthly Resistance level tends to work as a support.
In a Down trending market price tends to break under the lower edge of the Month Opening Range and keep moving higher at the very least until the middle of that month.
In a Down trending market once price broke under the Month Opening Range, the Monthly Support level tends to work as a resistance
There are may ways to use that instrument:
(1) Trend Confirmation.
The first three days of a month tends to bring volatile trading. The market sets boundaries for the following four trading weeks.
Once the range has been set, swing traders may wait for the market to break out of the range and consider that direction of the prevailing trend direction.
(2) Short "Failed Breakout" setup
Quite often price breaks out of the Month Opening Range on the fourth or fifth trading day of a month but then drops back into the range.
That failed breakout quite often is followed by decline back down to the Month Support level (the lower edge of the Month Opening Range).
(3) Long "Failed Breakdown" setup
Quite often price breaks down under the Month Support on the fourth or fifth trading day of a month but then pops back up over the Monthly Support.
That failed breakdown quite often is followed by a rally targeting to retest the Monthly Resistance (the red line).
The indicator generates signals, trade set-ups and alerts that are for educational and hypothetical purposes only and shall not be considered trade recommendations.
Any signals or trading setups drawn by the indicator is not to be construed as an offer to sell or the solicitation of an offer to buy, nor is it to be construed as a recommendation to buy, hold or sell (short or otherwise) any security. All users of the indicator must determine for themselves what specific investments to make or not make and are urged to consult with their own independent financial advisors with respect to any investment decision.

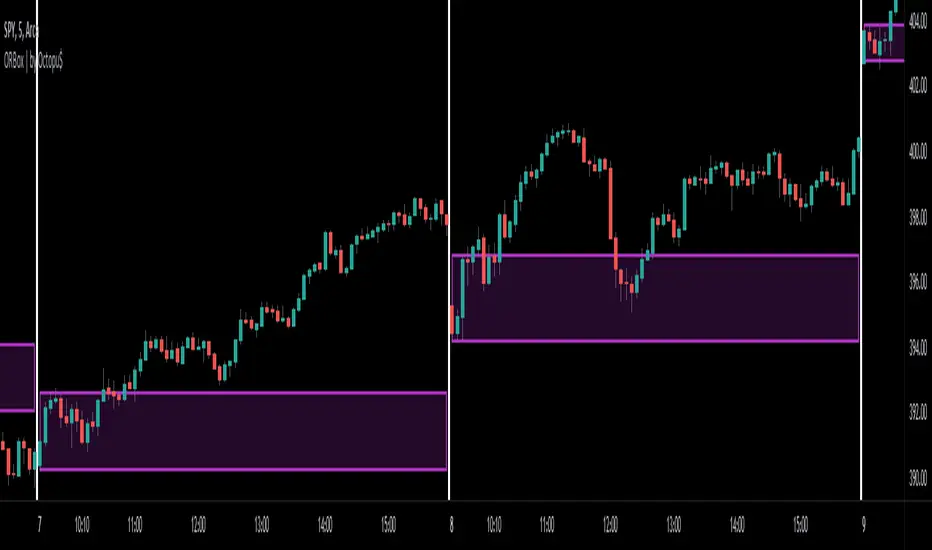
ORBox | by Octopu$📈 ORBox | by Octopu$
ORBox is a Box for the Opening Range Breakout
The Box is added automatically according to the User preferences through GUI
This Indicator includes a Dropdown selection for which Range for the Breakout you want to use
ORBox has built-in Alerts for when the Breakout happens according to your preferences
Works in any Timeframe with any Ticker
(Using SPY 5m just as an example:)
www.tradingview.com
SPY
Features:
• Opening Breakout Range (ORB)
• Dropdown menu selection to choose which TF to watch
• Built-in Alerts for Momentum Awareness
Options:
• Customization for Box Colors and Sizes
• Display ORB for Current Day or Previous
Notes:
v1.0
ORBox Indicator release
Changes and updates can come in the future for additional functionalities or per requests.
Did you like it? Shoot me a message! I'd appreciate if you dropped by to say thanks.
- Octopu$
🐙
Support and Resistance V1 This script is based on Range Support and Resistance .
It works by taking the range of the day,week and month calculating them and plotting 3 layers of Support and Resistance , as soon as it gets non directional /range bound , bar color turns GRAY if its in Bullish Trend and Pink if its in Bearish Trend .. As soon as bar turns Aqua it defines BULLISH Trend and RED bar color defines Bearish Trend . This way you can easily visualize the areas of support and resistance .
-----------------
Disclaimer
Copyright by FaizanNawazz.
The information contained in my scripts/indicators/strategies/ideas does not constitute financial advice or a solicitation to buy or sell any securities of any type. I will not accept liability for any loss or damage, including without limitation any loss of profit, which may arise directly or indirectly from the use of or reliance on such information.
All investments involve risk, and the past performance of a security, industry, sector, market, financial product, trading strategy, or individual’s trading does not guarantee future results or returns. Investors are fully responsible for any investment decisions they make. Such decisions should be based solely on an evaluation of their financial circumstances, investment objectives, risk tolerance, and liquidity needs.
My scripts/indicators are only for educational purposes!
Happy Trading!

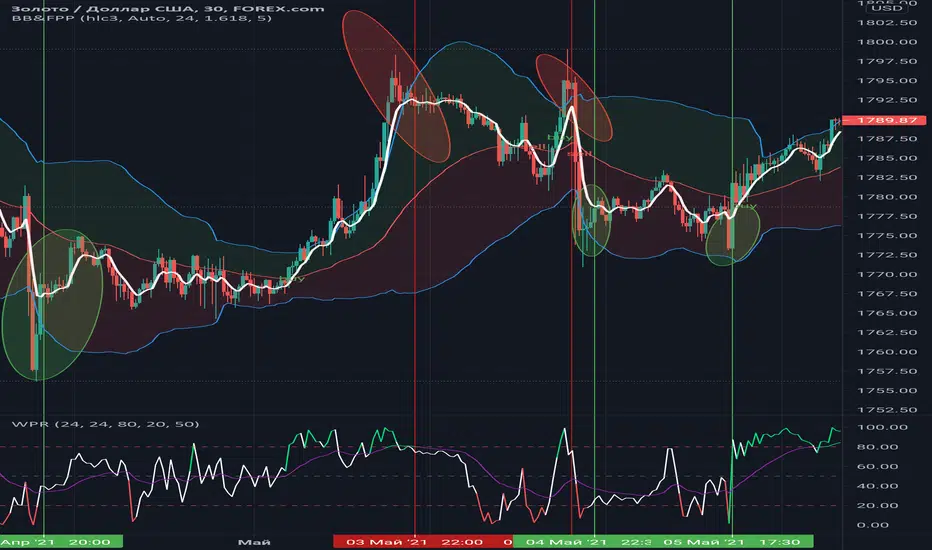
Williams %RHi! WPR is the Williams percentage range indicator in my design. The main idea is that the intersection of the indicator and the moving average in the overbought and oversold zones + color highlighting gives more clear visual signals for making trading decisions based on this indicator.
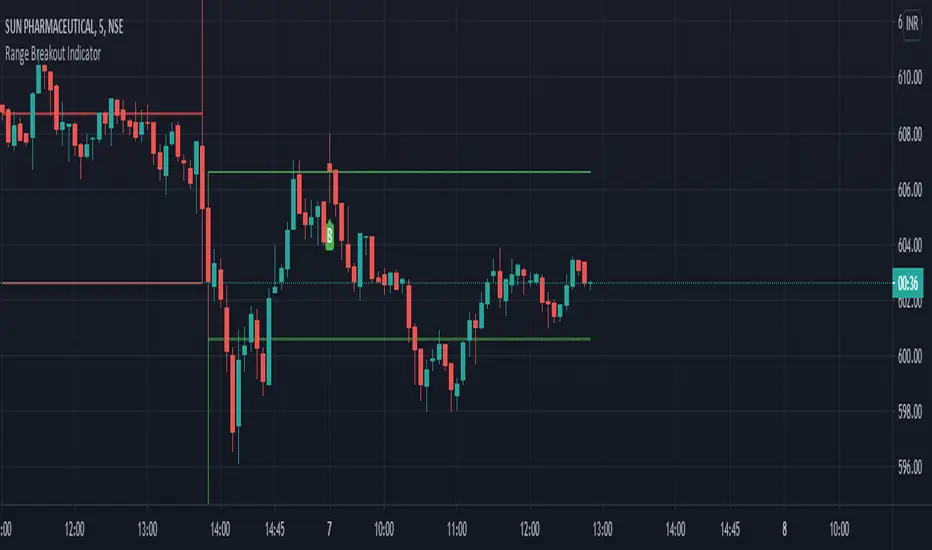
Range Breakout Indicator with trailing SLDear Traders,
This is a simple range breakout indicator where we are creating a range based on high and low of two consecutive volatile candles.
The logic is,
1) If the second candle traverse 1% up from the previous candle low (or)
2) If the second candle traverse 1% down from the previous candle high
then, the range is formed based on this high and low and
3) Buy signal will be given if the price crosses above the High
4) Sell signal will be given if the price crosses below the Low
The indication comes along with the Entry Indication, Exit Indication along with trailing SL
Option provided for changing the session time, target %, SL % and trailing SL %.
Happy Trading!
P.S: Please DM for access.
Range & Trend (Zeiierman)█ Overview
Range & Trend (Zeiierman) is a trend-first mapping of price that fuses an adaptive Range & Trend Line, a Trend Buffer (noise gate), a volatility-aware Trend Tracker, and optional Range Levels & Candles to reveal where trend is establishing, compressing, or handing off to a ranged regime.
Execution is guided by graded Buy/Sell labels (Regular / Plus / Strong), structural HH/HL & LL/LH markers with optional Peak Profit readouts, and a multi-TF Timeframe Scanner for alignment.
⚪ Why This One Is Unique
Unlike single-source trend lines, this version layers two orthogonal stabilizers:
a Range & Trend core that adapts its band size to volatility and dispersion, and
a dynamic smoothing buffer that dampens insignificant fluctuations, ensuring only meaningful trend movements affect signal output.
Signals are graded (Regular / Plus / Strong) based on contextual conditions, allowing traders to gauge the conviction behind each trend event. Range Candles add regime context by coloring bars only when a statistically consistent range structure forms, highlighting potential consolidation or transitional market phases. A lightweight Timeframe Scanner completes the workflow, broadcasting alignment from intraday to daily without adding chart clutter.
█ Main features
⚪ Range & Trend Line – Signal Generator
Adaptive directional mapping forms the foundation of the system. It highlights the active trend through color transitions and generates graded Buy/Sell labels (Regular / Plus / Strong) to reflect the strength of confirmation. The line responds dynamically to volatility, revealing when momentum is expanding, stabilizing, or reversing.
Unlike typical reactive signal tools, this model isolates only the most strong and meaningful trend transitions — those with the structural weight to establish or extend a new long-term directional phase. Each signal represents a filtered, high-conviction shift rather than a short-term fluctuation.
⚪ Trend Buffer (Noise Gate)
A precision filter that smooths the core trend output and suppresses false flips caused by short-term noise. It enhances visual consistency and provides the confirmation layer used to promote Regular signals to Plus strength when agreement occurs between buffer and core.
⚪ Trend Tracker
A trailing validation line that tracks directional health and trend persistence. It advances only in the direction of the active move, creating an adaptive stop-like reference. Tracker alignment helps identify trend exhaustion and contributes to Strong-grade signal confirmation.
⚪ Range Levels & Candles
Contextual zones that identify periods of compression or balance. When a valid range forms, candles are shaded within it, distinguishing ranging environments from trending conditions. These zones help anticipate breakouts and define natural support and resistance areas.
⚪ Live Structure (HH/HL & LL/LH with Peak Profit)
Displays real-time structural evolution — Higher Highs/Lows during uptrends and Lower Highs/Lows during downtrends. The optional Peak Profit label shows performance since the last regime change, offering an immediate view of current trend efficiency.
⚪ Timeframe Scanner
A compact multi-timeframe alignment panel that visualizes bullish or bearish trend states across user-selected intervals. It provides fast confirmation of directional consensus, helping traders act only when the broader structure supports their chosen bias.
█ How to Use
⚪ Range & Trend Line – Signal Generator
The Range & Trend Line is the core signal engine — its color shifts mark confirmed directional changes. This is where the system produces the graded Buy/Sell signals shown as ▲ / ▼ labels. Each grade reflects how many internal layers agree at the moment of signal creation:
Regular (▲ / ▼) – Triggered by a confirmed flip in the Range & Trend core. It appears when the base trend direction changes and is the earliest signal of potential reversal.
Plus (▲ + / ▼ +) – Requires the Trend Buffer to confirm the same direction. This upgrade indicates stronger trend agreement and higher reliability.
Strong (▲ ++ / ▼ ++) – These are high-conviction continuation signals and typically occur after structural confirmation.
How to trade them: Regular signals provide early awareness; Plus signals suggest confirmation; Strong signals mark trend maturity or high-probability continuations. Always trade in the direction of the prevailing trend. Use the Trend Buffer or Live Structure to confirm the dominant directional bias before acting on a signal.
⚪ Support and Resistance
The Range & Trend Line and the Buffer Line can act as dynamic support and resistance zones. Price often reacts around these levels, confirming whether the current move is continuing or losing strength.
Look for confirmation or rejection signals near these lines. Reactions around them often mark key decision points within the active trend.
⚪ Range Levels & Candles
Highlights when price enters structured consolidation zones. Candle coloring activates only inside validated ranges, helping to identify areas that show the typical characteristics of a ranging market. These zones visually separate balanced conditions from active trends and provide context for potential transitions.
Watch how price reacts around the upper and lower range levels. Look for false or confirmed breakouts, and expect price to move between these boundaries until a clear breakout develops. Range edges can also serve as practical entry or stop zones.
█ How It Works
⚪ Range & Trend Core
The main engine that defines the chart’s directional trend line. It adapts to changing market conditions, showing a smooth and reliable view of trend strength and direction.
Calculation: Builds a range-adaptive structure whose width adjusts with current volatility. The core moves toward new highs or lows but limits pullbacks to avoid false shifts. Several smoothing methods work together to create a steady, low-lag trend path.
⚪ Trend Buffer (Noise Gate)
A stabilizing layer that keeps the main trend line steady when price noise increases. It improves visual clarity and helps confirm true direction before a trend update appears.
Calculation: Uses a feedback-based update that reacts more when movement is strong and less when noise dominates. This lets the buffer ignore minor fluctuations while staying responsive to real trend changes.
⚪ Trend Tracker
A support line that follows the main move and helps confirm when a trend remains intact. It also serves as a guide for managing active positions.
Calculation: Applies a one-way trailing system that only moves in the direction of the trend. The offset adjusts with volatility, keeping a consistent distance that tightens or widens with market energy.
⚪ Buy/Sell Signal Engine (Regular / Plus / Strong)
The signal system that classifies entries by strength and confirmation level. It reacts to real-time trend changes while filtering weak reversals.
Calculation: Detects state flips in the Range & Trend Core, checks for agreement with the buffer, and rates each signal by historical pattern support. Higher-grade signals appear only when several layers confirm continuation strength.
⚪ Range Levels & Candles
Identifies short-term balance zones and highlights candles within those areas. These zones show where price pauses before the next directional move.
Calculation: Finds upper and lower range limits based on recent highs and lows, confirming only when several bars form a stable zone. Candle colors and level lines extend slightly forward to show likely reaction areas.
⚪ Swing Points & Peak Profit
Marks key turning points and measures performance since the last reversal. It helps track the strength and duration of each movement.
Calculation: Keeps a short memory of recent pivots and updates only when a new high or low replaces the last one. The percent distance from the last flip to the current bar defines the live Peak Profit reading.
⚪ Timeframe Scanner & Alert Aggregator
Combines directional data from multiple timeframes into a single view. Alerts trigger only when all selected timeframes agree.
Calculation: Gathers the trend state from each timeframe, converts it to a simple up or down value, and compares the results. When every layer matches your chosen direction, one clear, high-confidence alert is sent.
-----------------
Disclaimer
The content provided in my scripts, indicators, ideas, algorithms, and systems is for educational and informational purposes only. It does not constitute financial advice, investment recommendations, or a solicitation to buy or sell any financial instruments. I will not accept liability for any loss or damage, including without limitation any loss of profit, which may arise directly or indirectly from the use of or reliance on such information.
All investments involve risk, and the past performance of a security, industry, sector, market, financial product, trading strategy, backtest, or individual's trading does not guarantee future results or returns. Investors are fully responsible for any investment decisions they make. Such decisions should be based solely on an evaluation of their financial circumstances, investment objectives, risk tolerance, and liquidity needs.
Ücretli komut dosyası

ORB- Range break outThis script has below features
> Option to choose the bar number for considering break out
> Option to choose the targets based on the candle size
> Option to choose the budget and based on that it will show the quantity to trade
> SL is the candle range
> Can use it in any time frame

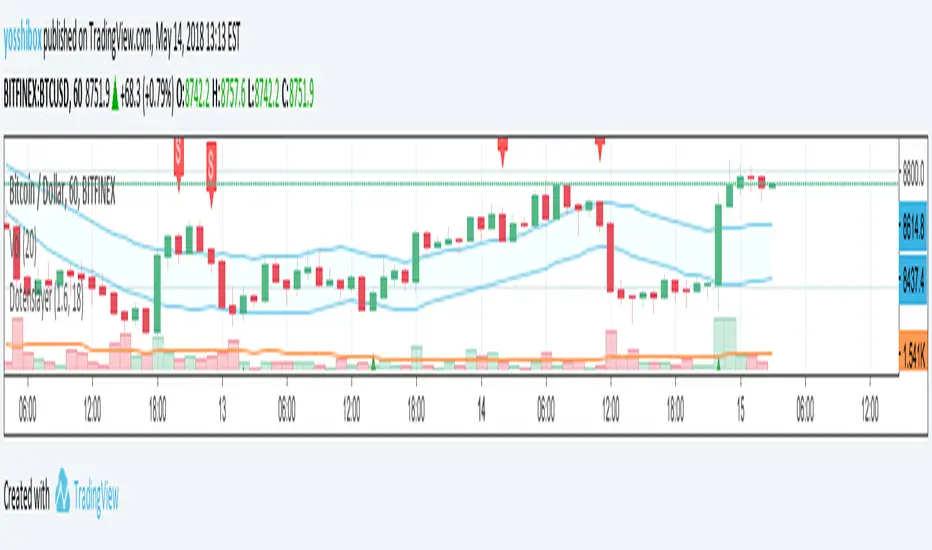
Dotenslayer : An open range breakouts method indicator for botThis script shows the long and short points of certain Japanese bots like 'DotenKun' which use open range breakouts method.
Searching recent 18 bars as default and shows the range calculated with a factor (default k = 1.6). You can edit this condition by yourself.
When filled the long or short conditions, also shows the indicator on the price chart to help your trading on BTC.
Also, this script can make alarm events related to those conditions.
This script only works for BTCUSD, XBTUSD, BTCJPY, FXBTCJPY with 1H time span.
Disclaimer :
I don't own the source code of the certain bots and I didn't directly reference the source code of it.
So which means, I don't guarantee this script works as same as the bots works.
Also, I didn't mean to disturb their trading bot businesses.
Your donations are welcome! :
BTC : 327MqYGfHJFC7LRijGwQZXdTAyFwvYCzyv
ETH : 0x5E270c3667E65ba6158D292a98c5b54F81AfCAf1