Financial Radar Chart by zdmreRadar chart is often used when you want to display data across several unique dimensions. Although there are exceptions, these dimensions are usually quantitative, and typically range from zero to a maximum value. Each dimension’s range is normalized to one another, so that when we draw our spider chart, the length of a line from zero to a dimension’s maximum value will be the similar for every dimension.
This Charts are useful for seeing which variables are scoring high or low within a dataset, making them ideal for displaying performance.
How is the score formed?
Debt Paying Ability
if Debt_to_Equity < %10 : 100
elif < 20% : 90
elif < 30% : 80
elif < 40% : 70
elif < 50% : 60
elif < 60% : 50
elif < 70% : 40
elif < 80% : 30
elif < 90% : 20
elif < 100% : 10
else: 0
ROIC
if Return_on_Invested_Capital > %50 : 100
elif > 40% : 90
elif > 30% : 80
elif > 20% : 70
elif > 10% : 50
elif > 5% : 20
else: 0
ROE
if Return_on_Equity > %50 : 100
elif > 40% : 90
elif > 30% : 80
elif > 20% : 70
elif > 10% : 50
elif > 5% : 20
else: 0
Operating Ability
if Operating_Margin > %50 : 100
elif > 30% : 90
elif > 20% : 80
elif > 15% : 60
elif > 10% : 40
elif > 0 : 20
else: 0
EV/EBITDA
if Enterprise_Value_to_EBITDA < 3 : 100
elif < 5 : 80
elif < 7 : 70
elif < 8 : 60
elif < 10 : 40
elif < 12 : 20
else: 0
FREE CASH Ability
if Price_to_Free_Cash_Flow < 5 : 100
elif < 7 : 90
elif < 10 : 80
elif < 16 : 60
elif < 18 : 50
elif < 20 : 40
elif < 22 : 30
elif < 30 : 20
elif < 40 : 15
elif < 50 : 10
elif < 60 : 5
else: 0
GROWTH Ability
if Revenue_One_Year_Growth > %20 : 100
elif > 16% : 90
elif > 14% : 80
elif > 12% : 70
elif > 10% : 50
elif > 7% : 40
elif > 4% : 30
elif > 2% : 20
elif > 0 : 10
else: 0
Radar

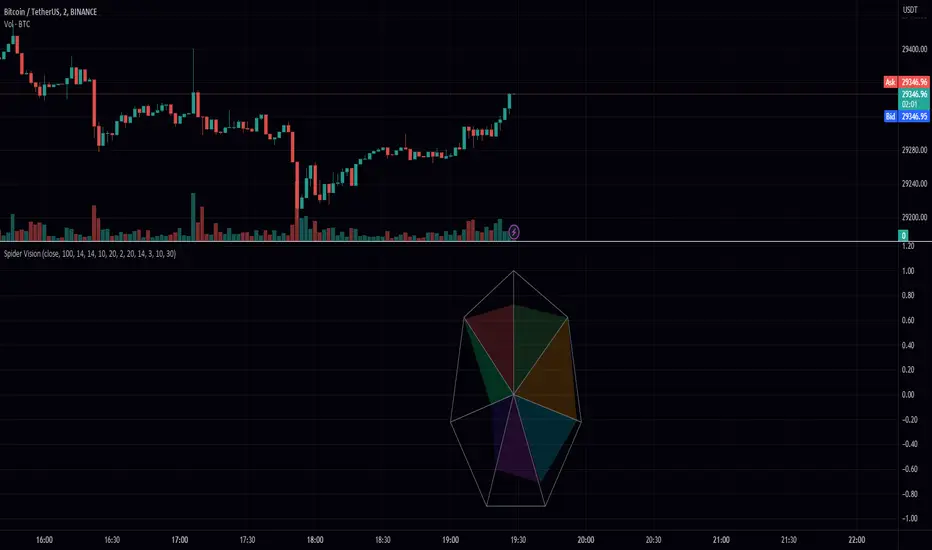
Spider VisionSpider Vision is an indicator that I created for trading view, which consists of a spider chart with 7 indicators built into it. This chart provides a visual representation of how these indicators are behaving, allowing traders to quickly assess the current market conditions.
The chart displays the following indicators:
RSI (Relative Strength Index): This is a momentum indicator that measures the strength of a security's price action. When the RSI is above 70, it is considered overbought, and when it is below 30, it is considered oversold.
Stochastic: This is another momentum indicator that compares the closing price of a security to its price range over a given time period. When the stochastic is above 80, it is considered overbought, and when it is below 20, it is considered oversold.
Momentum: This is a simple indicator that measures the change in a security's price over a given time period. When the momentum is positive, it indicates that the price is increasing, and when it is negative, it indicates that the price is decreasing.
BBW (Bollinger Bands Width): This indicator measures the width of the Bollinger Bands, which are a popular technical analysis tool used to identify potential trends and reversals. When the BBW is high, it suggests that the market is volatile, and when it is low, it suggests that the market is quiet.
DTO (Detrended Price Oscillator): This indicator measures the difference between the price of a security and its moving average. When the DTO is positive, it indicates that the price is above its moving average, and when it is negative, it indicates that the price is below its moving average.
Chop Zone: This indicator measures the choppiness of the market by comparing the average true range (ATR) to the difference between the high and low prices over a given time period. When the chop zone is high, it suggests that the market is choppy, and when it is low, it suggests that the market is trending.
Chaikin Oscillator: This is an oscillator that measures the accumulation/distribution of a security. When the Chaikin Oscillator is positive, it indicates that there is buying pressure in the market, and when it is negative, it indicates that there is selling pressure.
To use this indicator, traders can simply add it to their TradingView chart and adjust the input parameters to suit their trading style. The scale parameter can be used to adjust the size of the spider chart, while the color parameters can be used to customize the appearance of the chart. Traders can also adjust the length of each indicator to suit their preference.
Overall, the Spider Vision indicator provides a convenient way for traders to quickly assess the current market conditions and make more informed trading decisions.
Strat Radar_vtStrat Radar is a visual tool to trade "TheStrat" methodology.
TheStrat is a simple yet powerful model to view the market. From one bar to the next, there are only three possible scenarios or three types of candles:
type 1 - an inside bar. Market is in consolidation.
type 2 - a directional bar (2 up or 2 down). Market is trending.
type 3 - an outside bar. This is a broadening formation and market is taking liquidity from both upside and downside.
So by looking at candle type and combination, one can visualize what price is doing in the market.
Strat Radar makes it possible for user to see candle type and sequence for all major time frames – from a 5m bar to a yearly bar - all in one chart! And even better, it allows user to see not just one bar but last three bars!
Certain candle combination creates high probability trade setups, for example 2-1-2 or 2-2 reversals, so by looking at Strat Radar, user can quickly determine whether there are any good trading opportunities. The simple and visual layout makes it easy to go through a watch list and use Strat Radar as a scanner. There is no need to flip through multiple time frame charts.
Features:
Show candle type and color for twelve time frames from 5m to yearly bar
Show candle type and color for last three bars of each time frame
Location of candle number and candle color have specific meaning:
For non-directional bars ( 1 and 3):
Below candle means close > open
Above candle means close < open
For directional bar 2:
Below candle means: 2 up
Above candle means: 2 down
Candle color: green - close>open, red – close < open
A built-in trend strength system that can be turned on or off
A reversal marker that can be turned on or off. It is based on a combination of Strat candle sequence and trend strength
Since candle type and combination are clearly shown for each time frame, it is easy to determine whether is Full Time Frame Continuity (FTFC).
Strat Radar_vt is a light version of the full indicator and covers:
- most futures market
- 30 stocks in Dow Index
- Index and sector ETFs : SPY , QQQ , DIA, IWM , XLE , XLF , XLU , GDX , XLK , XLV , XLY , XLB , ITB , XRT , SMH , IBB , KRE , XLC , GDXJ , KBE
- Some key stocks: AAPL , AMZN , FB , GOOGL , TSLA , NVDA , NFLX
- Forex pairs: DXY , AUDCAD , AUDJPY , AUDNZD , AUDUSD , EURCAD , EURGBP , EURJPY , EURUSD , GBPJPY , GBPUSD , NZDUSD , USDCAD , USDJPY
Full version works on all stocks and assets. If you like this indicator and require the full version, please contact the author.

MTF Radar_vtMTF Radar is like your car dashboard for trading. It is your X-ray machine and, in one glance, you know what price is doing in all major time frames, from 5m to 1Q, without having to flip through multiple charts. Simple and visual!
The Sqz column indicates whether a stock is in consolidation(i.e. in squeeze) or in expansion (fired). Color denotes different compression levels: tight - black, medium - red, low - orange, green - fired.
T1 and T2 are two different trend systems:
T1 - green = bullish trend, red = bearish trend, gray = side ways, yellow - trend change
T2 - green = bullish trend, red = bearish trend, gray = side ways
T1 is a more sensitive system compared to T2.
Momo column shows squeeze momentum bars with matching color.
P+: momentum is positive and increasing. Light blue.
P-: momentum is positive and decreasing. Dark blue.
N+: momentum is negative and increasing. Yellow.
N-: momentum is negative and decreasing. Dark blue.
MTF Radar_vt is a light version of the full indicator and covers:
- most futures market
- 30 stocks in Dow Index
- Index and sector ETFs : SPY, QQQ, DIA, IWM, XLE, XLF, XLU, GDX, XLK, XLV, XLY, XLB, ITB, XRT, SMH, IBB, KRE, XLC, GDXJ, KBE
- Some key stocks: AAPL, AMZN, FB, GOOGL, TSLA, NVDA, NFLX
- Forex pairs: DXY,AUDCAD,AUDJPY,AUDNZD,AUDUSD,EURCAD,EURGBP,EURJPY,EURUSD,GBPJPY,GBPUSD,NZDUSD,USDCAD,USDJPY
Full version works on all stocks and assets. If you like this indicator and require the full version, please contact the author.
Credits:
-> John Carter - creator of TTM Squeeze and TTM Squeeze Pro
-> Lazybear's interpretation of the TTM Squeeze: Squeeze Momentum Indicator

Screener - Multi Timeframe [WYCKOFF ARSENAL]Screener - Multi Timeframe WYCKOFF ARSENAL
The general idea of The Wyckoff Method is that the trader can see the market as well-structured periods of Accumulation , Markup , Distribution and Markdown .
The price of an asset depends on its supply and demand .
There is more than one stock available for trading, and there is more than just Bitcoin on the Cryptocurrency market.
This means that one may choose to trade more than one asset and this perspective opens up a world of opportunities in which Supply and Demand are the masters.
For example, you have invested some money in a cryptocurrency, and you wait for it to Markup already.
But it is still in a long period of accumulation - it doesn't move much.
You should leave it and find another crypto that is moving.
To aid in the discovery of such opportunities, a Market Screener is available.
Method used: The Wyckoff Method of course.
The indicators used:
• Optimism Pessimism
• Force
• Technometer
• Momentum
The Wyckoff Arsenal Indicators can be used individually, and they are very useful when trading a single pair.
But the Market Screener can scan for opportunities in a wide range of pairs, or same asset but different trading platforms.
The indicators are based on volume, so the symbols must have volume data for the Screener to work.
Multiple indicator instances can be used to track a specific asset, like Bitcoin.
This way, all Bitcoin data available on TradingView could be used instead of data coming from a single trading platform.
Alerts: Overbought/Oversold conditions, Bollinger Bands crossings, Divergence detection.
