PoiBox# PoiBox: Advanced Market Structure and POI Visualization Tool
PoiBox is a comprehensive market structure analysis tool designed to identify high-probability trading zones through advanced internal market structure (IDM) detection and points of interest (POI) calculation.
## How It Works
The indicator uses a multi-step approach to analyze price action:
1. **Market Structure Identification**: The script identifies significant highs and lows within your selected time range to determine the overall market structure direction (up or down).
2. **IDM Pattern Detection**: It then analyzes internal market structure patterns within this range, focusing on significant price movements that create trading opportunities.
3. **POI Calculation**: Using adaptive ATR measurements across multiple timeframes, the indicator calculates precise POI zones where price is likely to react. These zones are calibrated based on the volatility profile of each identified structure.
4. **Timeframe Correlation**: The script automatically determines which timeframe best matches each structure's size, providing valuable context for your trading decisions.
5. **Technical Implementation**: The indicator uses a sophisticated algorithm to analyze price swings, identify pivot points, and calculate market structure connections. It maintains a database of significant highs/lows and uses these to determine trend direction and potential reversal zones.
## Display Modes
PoiBox offers three powerful display options:
- **Main BOS**: Shows only the most significant breakout structure with its associated POI zone
- **Leg**: Displays the largest price leg within the selected range along with percentage-based POI zones
- **All IDMs**: Reveals all detected internal market structures and their POI zones
## Advanced Features
- **QM Mode**: Visualizes important market structure relationships with dashed lines connecting significant highs and lows
- **Trick Display**: Identifies nested market structures (tricks) within larger patterns, perfect for precision entries
- **Customizable POI Labels**: Control which price labels appear to maintain chart clarity
- **Extensive Color Settings**: Fully customizable colors for all visual elements
- **Safety Functions**: Includes built-in buffer management and error prevention algorithms to ensure stable performance across all timeframes and market conditions
## Trading Examples
**Downtrend Example:**
When PoiBox identifies a downtrend structure (Higher High → High → Low → Lower Low), it creates POI zones based on the market structure. As shown in the chart, these zones provide excellent entry opportunities when price returns to test previous structure. In this example, entering at the red POI zone with a stop above the zone and target at the QM level resulted in a 3.45 risk/reward trade.
**How to Read QM Lines:**
The dashed lines connecting High → Low → Higher High → Lower Low reveal the market's true structure. These connections help you anticipate where price might head next. When price breaks below a significant Low and creates a Lower Low, it confirms the downtrend continuation and provides a trading opportunity when price retests the broken structure.
**POI Zone Interpretation:**
- Red zones indicate bearish POI areas (ideal for short entries)
- Green zones indicate bullish POI areas (ideal for long entries)
- Yellow zones highlight the identified market structure
## Practical Application Example
In the GBP/USD example shown in the chart:
1. PoiBox identified a downtrend structure with Higher High → High → Low → Lower Low
2. The yellow box shows the main market structure area
3. The red POI zone appeared when price returned to test previous structure
4. Entry was taken at the POI zone with stop loss above structure
5. Target was placed at the QM level, resulting in a 3.45 risk/reward ratio trade
6. The dashed QM lines showed the overall market flow and direction
This demonstrates how PoiBox automatically identifies optimal entry and exit points based on market structure, without requiring manual analysis of each price swing.
## Mathematical Approach
PoiBox uses several mathematical concepts to determine market structure and calculate POI zones:
1. **Adaptive ATR Integration**: The script analyzes ATR (Average True Range) across multiple timeframes (M1, M5, M15, H1, H4, D1, W1, MN1) to determine the appropriate volatility context for each structure.
2. **Height-to-ATR Ratio**: The indicator calculates the ratio between structure height and the closest matching ATR value to determine the structure's timeframe context.
3. **Dynamic POI Calculation**: POI values are calculated using the formula:
`POI = factor * (atr_trigger + atr_double_trigger)`
where `factor` is derived from the structure's height-to-ATR ratio.
4. **Self-Adjusting Limits**: If the calculated POI value exceeds certain thresholds relative to structure height, the script automatically applies proportional adjustments to maintain optimal zone sizing.
## What Makes PoiBox Unique
While many indicators use common concepts like support/resistance or trend analysis, PoiBox stands apart through its:
1. **Adaptive POI Calculation**: Unlike static indicators, PoiBox automatically calibrates POI zones based on each market structure's volatility profile by analyzing ATR across multiple timeframes.
2. **Smart Timeframe Detection**: The indicator automatically determines the most relevant timeframe for each structure, eliminating guesswork and helping you align your trading with the appropriate market cycles.
3. **QM Visualization System**: Our proprietary QM visualization method reveals hidden market structure relationships that standard indicators cannot detect, giving you an edge in anticipating price movements.
4. **Nested Pattern Recognition**: The "Trick" detection feature identifies high-probability setups where smaller patterns form within larger ones, creating precise entry opportunities missed by conventional tools.
5. **Self-Adjusting Analysis**: PoiBox dynamically adapts to changing market conditions without requiring manual parameter adjustments, saving you time and increasing accuracy.
These innovations combine to create a truly original trading system that transforms complex market structure concepts into clear, actionable signals.
## How To Use
1. Define your analysis area using the time range selectors (X1 and X2)
2. Choose your preferred display mode based on your trading style
3. Enable QM Mode for additional market structure context if needed
4. Use the POI zones as potential entry and exit areas for your trades
5. Reference the automatically detected timeframe indicators to align your trading with the appropriate timeframe
### Settings Explanation
**Display Settings:**
- Display Mode: Choose between Main BOS, Leg, or All IDMs visualization
- QM Mode: Enable to see market structure connections with dashed lines
**Trick Settings:**
- Trick Display: Show the main trick or all nested patterns
- Trick POI: Control which POI zones appear for trick patterns
**Label Settings:**
- Leg POI %: Customize percentage-based POI zones in Leg mode
- POI Labels: Control which price labels appear on your chart
**Time Range:**
- X1 and X2: Define the analysis area for market structure detection
**Colors:**
- TF Color: Color for timeframe labels
- H/L Color: Color for high/low labels
- QM Lines: Color for market structure connection lines
- Trick Color: Color for nested pattern visualization
This indicator is designed for traders who understand market structure concepts and want a powerful tool that automatically identifies high-probability trading zones based on structural price patterns and volatility-adjusted measurements.
Quasimodo

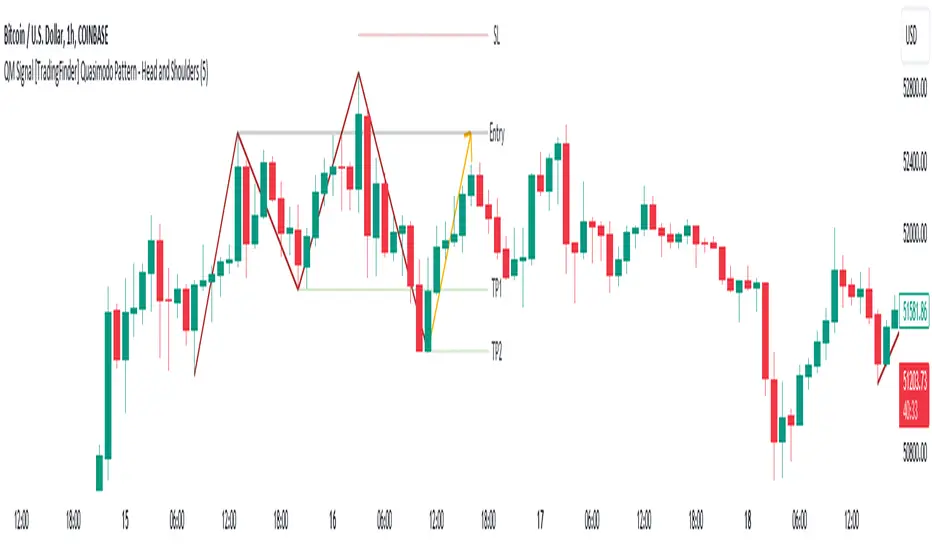
QM Signal [TradingFinder] Quasimodo Pattern - Head and Shoulders🔵 Introduction
One of the patterns in "RTM" is the "QM" pattern, also known as "Quasimodo". Its name is derived from the appearance of "Hunchback of Notre-Dame" from Victor Hugo's novel. It is a type of "Head and Shoulders" pattern.
🔵 Formation Method
🟣 Upward Trend
In an upward trend, the left shoulder is formed, and the price creates a new peak higher than the left shoulder peak . After a decline, it manages to break the previous low and move upward again. We expect the price to return approximately between and to form the "QM" pattern.
🟣 Downward Trend
In a downward trend, with a price decline, a new valley is created, forming the left shoulder, and the price forms a new valley lower than the left shoulder valley . After a price increase, it manages to break the previous high and move downward again. We expect the price to return approximately between and to form the "Quasimodo" pattern.
Note: The "QM" pattern is a specific type of head and shoulders pattern in which in the first move, the previous support is broken and it's the best condition for price reversal.
🔵 Entry Conditions for "Buy" and "Sell"
🟢 Buy
Buy Position : When a complete "QM" pattern is formed in a downtrend; we expect the price to reach the left shoulder area (with confirmation) during the retracement to enter the "BUY" position.
Profit Target in Buy Scenario : Expecting a move to the peak that broke it and the highest point in the current "Swing".
Stop Loss : Below the "Head," which is the lowest point.
🔴 Sell
Sell Position : When a "QM" pattern is formed in an uptrend, we look for entry into the "Sell" position as the price retraces to the left shoulder area.
Profit Target in Sell Scenario : Expecting a move to the price floor that has been broken and the entire "Swing" or .
Take Profit : Above the highest point or above the area will be the "SL" region.
Note : Certainly, no method alone guarantees trading capability and requires different confirmations. This indicator only detects the "QM" pattern, and the rest of the analysis will be the responsibility of the user.
Note : These profit and loss limits are based on market movements and will be provided as approximate and supportive.
Smart Money BusterAfter daytrading for a while i came into conclusion that price action trading is the most successful way to trade for me and this project was for me to simplify my way of trading at the beginning. Eventually it got big and turned into a very useful helper indicator for me to setup on different pairs for alerts and only look at the charts to decide for entry when the alerts come from 120 different pairs that i set it up. Since i always looked at indicators for a way to make my job simpler and give me more time to do more important things for me rather than drawing lines on different pairs eveyday i think it got to a point where it works to my liking and making me gain time, thus more money.
This indicator uses smart money concepts like Market Structure, Order Blocks, Quassimodo Levels, Structure Breaks, Pumps and Dumps, Imbalances(In the works will be added in first update) to help trader catch what the whales are thinking and how to enter in the right time for swing trading, catching bottoms and tops.
Here are some of the features as of release:
Detects Market Structure and draws zig-zag lines and keeps note of pivot points.
Detects Order blocks and draws boxes when the conditions met
Detects the quassimodo levels and changes the color of the box to signal double confluence meaning stronger signal
Draws structure break lines
Setting to set structure break percentage before drawing boxes to get the boxes drawn if you want to be more 'sure' about the Order Block Levels.
Setting to change depth and backstep values for zigzags to be able to let you fit the system for different time frames.
Setting to set MSB trigger point between High and Low, Close and Open or hl2 values.
Setting to set Signal Triggering Range between Start, Middle and End meaning eg. if you set it to Middle it will wait for MSB trigger point to hit the middle of the box before giving you a signal.
Setting for changing HH-LL pivot points lookback count, 5 as default. Increasing this value will make you compare your pivot points with more data, really useful in lower time frames where will be a lot of zig-zags and highs and lows giving you a method to avoid false signals. Recommended to keep it lower values on 30 min and higher and increase it in lower Timeframes according to market volatility.
Setting to add a Box limit where the box of order block will be set invalid after certain candles and it still didn't trigger. Default value of 0 means it's disabled.
Setting to set Candle volatility percentage value to avoid big candles getting opposite signals on fast pump or dump schemes and bust those market makers schemes. Gotta say this came out really handy in crypto markets :)
As an end you can set alerts for 'Buy' , ' Sell ', ' Buy and Sell' together or if you wish you can connect it to bots via webhook as an entry. Although haven't connected to any bots myself as i think the best method of trading is human and machine working together. Since we have the creativity and out of the box thinking and machines have the ability to brute force calculation and huge bandwith that we don't currently have. At least until Elon Musk turns is into a cyborg, which i am not very eager about.
Planned Features:
- Add ability to detect imbalances(fair value gaps) to add third confluence to detect dragon fruit entries. This will make the system work with triple confluence.
- Add more settings so humans can command the ai better.
- Maybe a strategy version after i write my own dynamic take profit algorithm to give system ability make quantitative decisions based on current position profit levels.
- Although i think i fixed almost all the important bugs if there ever comes up one bugs will take priority for updates.
- And some things i may decide to add later. I will keep working on this project since it works well for me.
And like always, happy trading.

Quasimodo Pattern by EmreKbThis indicator show the quasimodo patterns on the chart. Quasimodo pattern (QML) is the reversal pattern. This looks like head and shoulder pattern but this have two difference. On the quasimodo, second neck should be lower/higher (lower for the bearish, higher for the bullish) and quasimodo has no second shoulder. Usually QML line is an entry and head point is a stoplos.
Zigzag length is a length for the zigzag calculation.

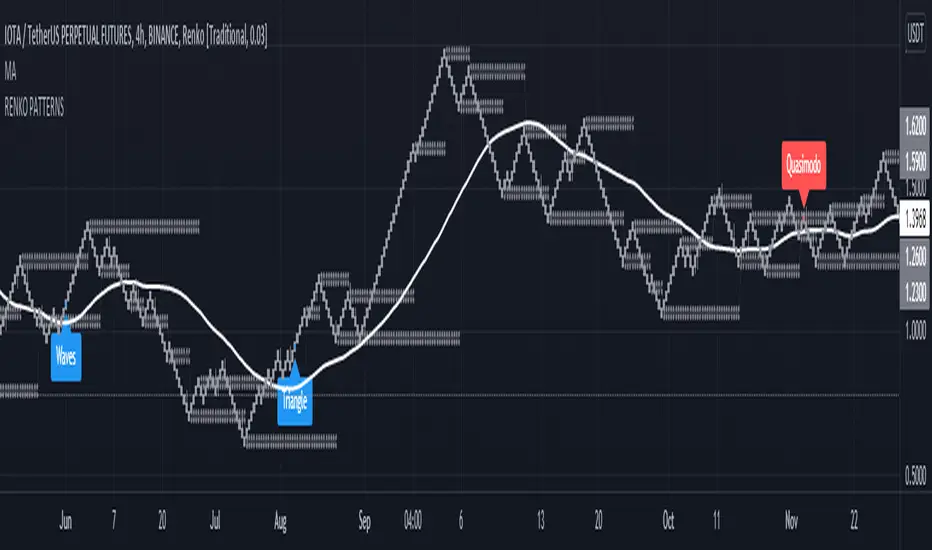
Head and Shoulders - Quasimodo etc Pattern Recognition RENKODisclaimer: Only use this pattern recognition on a RENKO chart. Renko charts plot different than traditional candles and therefore do not represent all price moves. There is a possibility of repainting while using ATR based renko charts so past results are not a 100% accurate representation of future results. Use this indicator as a part of your strategy and not as your only means of obtaining gains in the market.
Hello traders, it has been said time and time again that algorithmic software is unable to identify complex market structure like head and shoulders, quasimodo, triangle patterns and other methods humans use to base their trading decisions on. With this indicator I intend to completely crush that assumption and prove that it actualy is possible. Ofcourse an indicator is less likely to find all variation on a chart pattern and a human is probably still your best bet in finding these patterns early.
That is wy this indicator does not only use textbook patterns and has 7 variation on head and shoulders build into it. I will keep updating this indicator if I see it missed some crucial patterns. Right now it has a total of 38 patterns build into it with them being grouped under specific names. Feel free to turn off any pattern you do not like to see.
Renko patterns solve the problem of time and chaos in the markets which have been the biggest hurdle in pattern recognition software as the amount of variations to account for is just too great a number. With this script using renko it will soon be able to identify any pattern in the market and I plan to add Wyckoff to it in the future, right now I have a beta version of Wyckoff build into it but planning to add better version of it in the future. The amount of variations on Wyckoff is quite extreme so it will take a very long time to get an optimised Wyckoff identification system.
If you do not want to miss patterns I recommend to use a multi chart aproach so that you can find patterns in multiple renko brick sizes at the same time to find more entrys.
Feel free to comment any pattern you want me to add and let's make the most dedicated pattern recognition software on this platform.
Regards
HonestCowboy