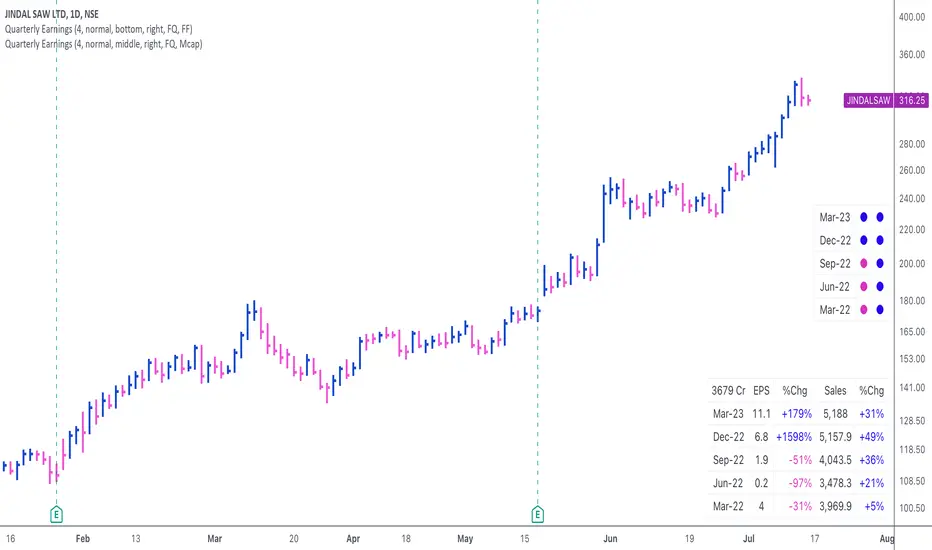
Quarterly EarningsThis script displays quarterly earnings per share (EPS) and sales data, and their year-on-year percentage change.
The script builds upon the Volume Price and Fundamentals script by Mohit_Kakkar08 and improves upon the array functions to keep the code light-weight & the output as accurate as possible. This script uses diluted EPS data for calculating the quarterly earnings. New quarters are auto-generated by the script as the earnings data gets updated in Tradingview every quarter.
Features:
⦿ View quarterly earnings per share (EPS) and sales data.
⦿ The percentage change is a YoY (year on year) comparison of the current quarter to the same quarter of the previous year.
⦿ Option to change the data from Quarterly (FQ) to Yearly (FY) .
⦿ Long mode : Option to increase the number of previous quarters displayed in the table (default is the past 4 quarters) to any number.
⦿ Location & size of the table can be changed.
⦿ Option for a 1-click dark mode
⦿ Option for a ' Mini mode ' where the values are replaced by traffic lights for a quick visual:
🟢 or 🔵 YoY increase in earnings/sales
🔴 or 🟣 YoY decrease in earnings/sales
🟡 or 🟠 YoY earnings/sales unchanged
⚪️ No data available
⦿ The top-left cell has the option to display either the free float (FF) or the marketcap (Mcap) of the stock.
Please note that sometimes the Tradingview data reflected in the script output might differ a bit from MarketSmith. Also make sure you are viewing the 'consolidated' data there.
This script was developed as a collaboration between me & @EquityCraze .
Quarterlyresult
Financial MetricsGives a sneak peak into some of the important financial ratios described below:
1. P/E : price to earnings ratio (Green when P/E<15)
2. PEG: Price to earnings growth ratio (Green when PEG<1)
3. P/S: Price to sales ratio (Green when P/S<2)
4. EV/FCF: Enterprise Value to Free Cashflow ratio
5. OPM: Operating Profit Margin % (Green when OPM>15%)
6. D/E: Debt to equity ratio (Green when D/E<1)
7. ROE: Return on equity % (Green when ROE>15%)
8. Div_Yield: Dividend yield
Disclaimer: All the limits defined are based on the widely accepted general values, but are subjective to particular sector or group of stocks. For example IT stocks command higher valuation than cyclical stocks like metal. So Compare with other stocks of the same sector to reach any conclusion.
