Forecasting Quadratic Regression [UPDATED V6] Forecasting Quadratic Regression applies a second-degree polynomial regression model to price data, offering a non-linear alternative to traditional linear regression. By fitting a quadratic curve of the form:
y=a+bx+cx2
the indicator captures both directional trend and curvature, allowing traders to detect momentum shifts earlier than with straight-line models.
🔹 Core Features
Fits a quadratic regression curve to user-defined lookback periods
Extends the fitted curve forward to generate forecast projections
Calculates slope curvature to highlight trend acceleration or deceleration
Adapts dynamically as new bars are added
🔹 Trading Applications
Identify potential reversal zones when the curve inflects (2nd derivative sign change)
Forecast near-term mean reversion targets or extended trend continuations
Filter trades by measuring momentum curvature rather than linear slope
Visualize higher-order structure in price beyond standard regression lines
⚠️ Note: This model is statistical and assumes past curvature informs short-term future price paths. It should be combined with confirmation signals (volume, oscillators, support/resistance) to reduce false inflection points.
Quadratic-regression

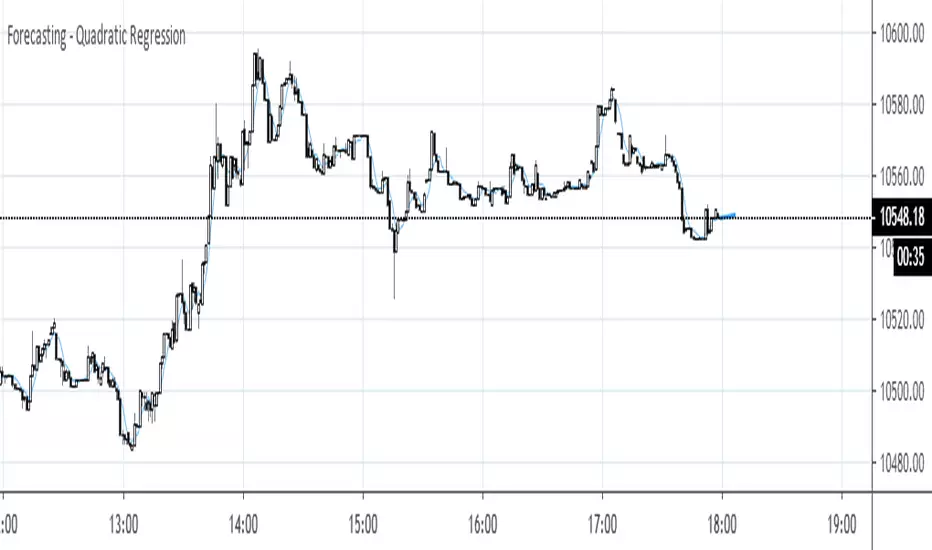
Forecasting - Quadratic RegressionThis script is written totally thanks to Alex Grover (). Here it is implemented in conjunction with the seasonal forecast I showed in one of my previous posts. It takes the calculated QReg curve and extends its last section (Season) into the future (Forecasted periods).
Quadratic Regression Slope [DW]This is a study geared toward identifying price trends using Quadratic regression.
Quadratic regression is the process of finding the equation of a parabola that best fits the set of data being analyzed.
In this study, first a quadratic regression curve is calculated, then the slope of the curve is calculated and plotted.
Custom bar colors are included. The color scheme is based on whether the slope is positive or negative, and whether it is increasing or decreasing.

Quadratic RegressionA quadratic regression is the process of finding the equation that best fits a set of data.This form of regression is mainly used for smoothing data shaped like a parabola.
Because we can use short/midterm/longterm periods we can say that we use a Quadratic Least Squares Moving Average or a Moving Quadratic Regression.
Like the Linear Regression (LSMA) a Quadratic regression attempt to minimize the sum of squares (sum of the squared difference between a set of data and an estimator), this is why
those kinds of filters have low lag .
Here the difference between a Least Squared Moving Average ( green ) and a Quadratic Regression ( red ) of both period 500
Here it look like the Quadratic Regression have a best fit than the LSMA
