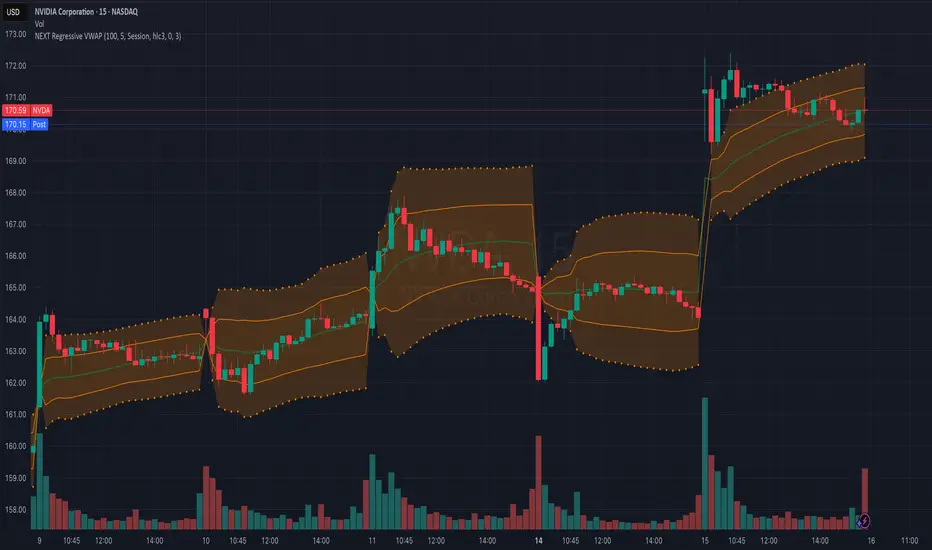
NEXT Regressive VWAPOverview:
This version of the Volume-Weighted Average Price (VWAP) indicator features an extended algorithm, which, in addition to volume and price, also incorporates regression analysis. The result is a more responsive, often leading VWAP slope with a degree of statistical predictability built in. Just like with the original VWAP, NEXT Regressive VWAP offers two optional Standard Deviation bands that parallel it. These can be set to any deviation level, with the default being 1 and -1, indicating one standard deviation above and one below Regressive VWAP, respectively.
Below is a screenshot comparing NEXT Regressive VWAP (green) to the original VWAP (blue) on CME_MINI:ES1! M3 chart.
Application and Strategy Ideas:
Price above NEXT Regressive VWAP is interpreted to have a bullish bias, and below, bearish. You can use TradingView's native Set Alert functionality to be notified, in real-time, when price crosses Regressive VWAP, and/or any of its standard deviation bands. Another popular "probability play" strategy is to scalp price when it crosses under the upper band (short) and crosses over the lower band (long). The screenshot below visualizes such a strategy on NASDAQ:QQQ M1 chart:
Input Parameters:
There are 3 groups of input.
Regression Settings
Length - controls the length of time (in bars) for regression analysis with higher values yielding smoother, more responsive values.
Regression Weighting - controls the degree of regression analysis incorporated into VWAP, with 5 being average, 0-4 less, 6-10 more. The higher the value, the more responsive the Regressive VWAP curve.
VWAP Settings
Anchor Period - controls the origin of VWAP calculations, start of session being the default.
Source - data used for calculating the VWAP, typically HLC/3, but can be used with other price formats and data sources as well.
Offset - shifting of the VWAP line forward (+) or backward (-).
Standard Deviation Bands Settings
Calculate Bands - checking this will add 2 bands, each equidistant (by the amount of Multiplier) from the NEXT Regressive VWAP line.
Bands Multiplier - standard deviation multiplier, with 1 being the default
Signals and Alerts:
Here is how to set price (close) crossing NEXT Regressive VWAP alerts: open a chart, attach NEXT Regressive VWAP, and right-click on chart -> Add Alert. Condition: Symbol e.g. ES (close) >> Crossing >> Regressive VWAP >> VWAP >> Once Per Bar Close.
Probability
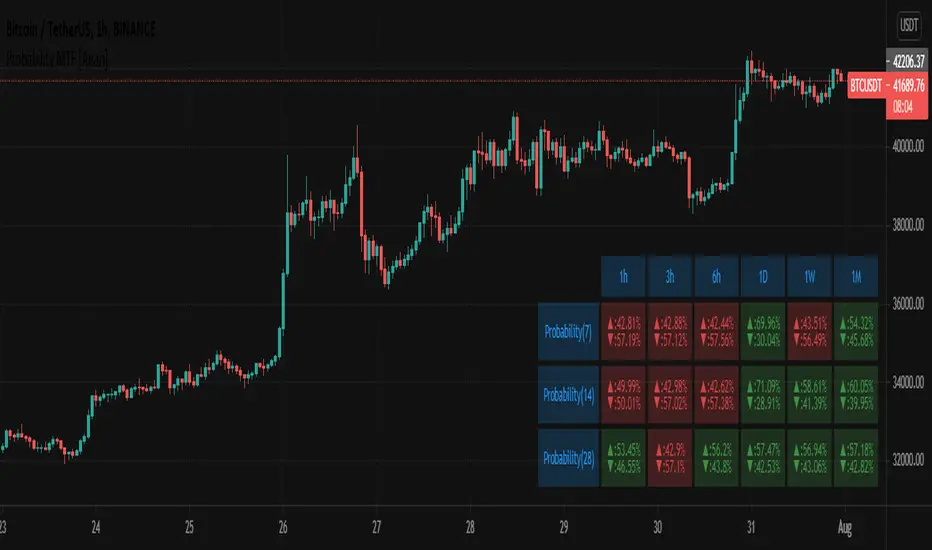
Probability MTF [Anan]█ OVERVIEW
Probability is simply how likely something is to happen.
Whenever we’re unsure about the outcome of an event, we can talk about the probabilities of certain outcomes—how likely they are.
The best example for understanding probability is flipping a coin, There are two possible outcomes—heads or tails..
In our case, the coin is (Green/Red) Candles
So:
Probability of an event = (# of ways it can happen) / (total number of outcomes)
P(A) = (# of ways A can happen) / (Total number of outcomes)
So:
The probability of the next candle is green (Up)= (# of past green candles) / (total both candles sum "length")
The probability of the next candle is red (Down)= (# of past red candles) / (total both candles sum "length")
█ FEATURES
- Fully control of Probability (Source / Length)
- Show / Hide / customize three rows of Probability.
- Multi-timeframe Table.
- Full control of displaying any row or any column.
- Full control of Table position and Size and Colors.
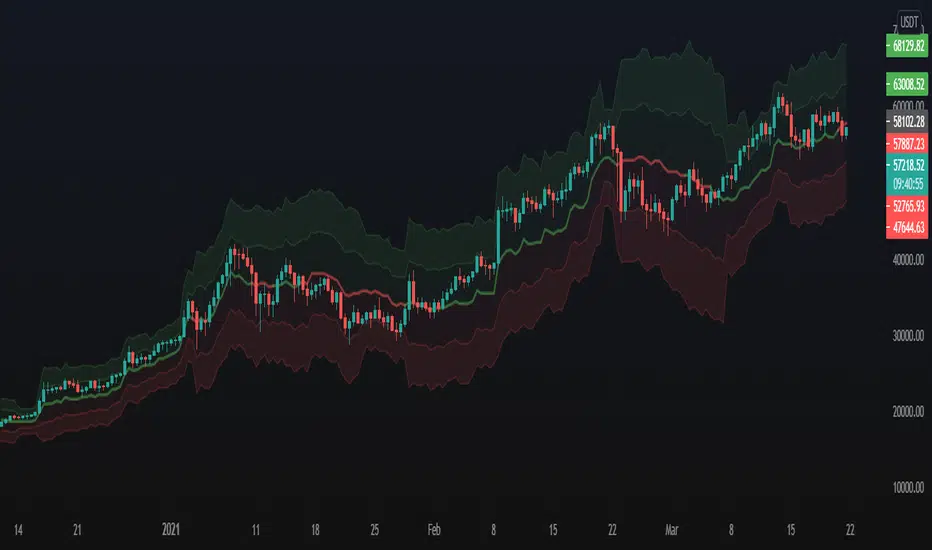
xGhozt Prophecies - A Forecast on the FuturexGhozt Prophecies - A Forecast on the Future, is an indicator based on past statistics and different dates.
The indicator goes back in time and checks all the candles of your selected time frame, and gives you the statistical potential outcome of the next candle. It has been created in order to anticipate potential violent moves from the markets when key dates arrive. On March 12, 2020, Bitcoin dropped by nearly 50% in one single day. Many crypto traders were left with a PTSD that emerged on March 11, 2021, as many anticipated another crash on March 12, 2021. Therefore I created this indicator to show you how a candle behaved in the past, on a certain date.
You can replicate the model on any given time frame, on any asset, and you can even pre-select important dates in the indicator settings box to keep an eye on these dates at any given time.
You can therefore check how an asset behave on Mondays, or on the last day of the month, or how the 1h candle behave on this asset, on a Tuesday. Many combinations are available.

Implied TargetThis script attempts to estimate the targets that the current price may reach based on an exponentially weighted volatility model.
Overall, with the assumption of normal distribution of log return, which might not always hold true, it calculates the estimated range within which the current candles will close. One, two, and three sigma will give the probability of around 68%, 95% and 99% respectively.
This can be used to give you a better sense of what is possible with the current level of volatility , thus assist in risk management and position sizing.
Like with any indicators, it is recommended that you use this script as a confirmation to your strategy, and not take the estimated range blindly to carry out, for instance, mean-reversion trade. Again, it is merely an estimation with volatility at its core.
May you be on the right side of the trade.

Probability Of Expiring ConeThis script attempts to give forecasts over the range of the closed price based on the exponentially weighted volatility.
Overall, with the assumption of normal distribution of log return, which might not always hold true, it calculates the approximate/ estimated probability that the current candles will close within the plotted shape. One, two, and three sigma will give the probability of around 68%, 95% and 99% respectively.
This can be used to give you a better sense of what is likely with the current level of volatility, thus assist in risk management and position sizing.
May you be on the right side of the trade.

Probability Distribution HistogramProbability Distribution Histogram
During data exploration it is often useful to plot the distribution of the data one is exploring. This indicator plots the distribution of data between different bins.
Essentially, what we do is we look at the min and max of the entire data set to determine its range. When we have the range of the data, we decide how many bins we want to divide this range into, so that the more bins we get, the smaller the range (a.k.a. width) for each bin becomes. We then place each data point in its corresponding bin, to see how many of the data points end up in each bin. For instance, if we have a data set where the smallest number is 5 and the biggest number is 105, we get a range of 100. If we then decide on 20 bins, each bin will have a width of 5. So the left-most bin would therefore correspond to values between 5 and 10, and the bin to the right would correspond to values between 10 and 15, and so on.
Once we have distributed all the data points into their corresponding bins, we compare the count in each bin to the total number of data points, to get a percentage of the total for each bin. So if we have 100 data points, and the left-most bin has 2 data points in it, that would equal 2%. This is also known as probability mass (or well, an approximation of it at least, since we're dealing with a bin, and not an exact number).
Usage
This is not an indicator that will give you any trading signals. This indicator is made to help you examine data. It can take any input you give it and plot how that data is distributed.
The indicator can transform the data in a few ways to help you get the most out of your data exploration. For instance, it is usually more accurate to use logarithmic data than raw data, so there is an option to transform the data using the natural logarithmic function. There is also an option to transform the data into %-Change form or by using data differencing.
Another option that the indicator has is the ability to trim data from the data set before plotting the distribution. This can help if you know there are outliers that are made up of corrupted data or data that is not relevant to your research.
I also included the option to plot the normal distribution as well, for comparison. This can be useful when the data is made up of residuals from a prediction model, to see if the residuals seem to be normally distributed or not.

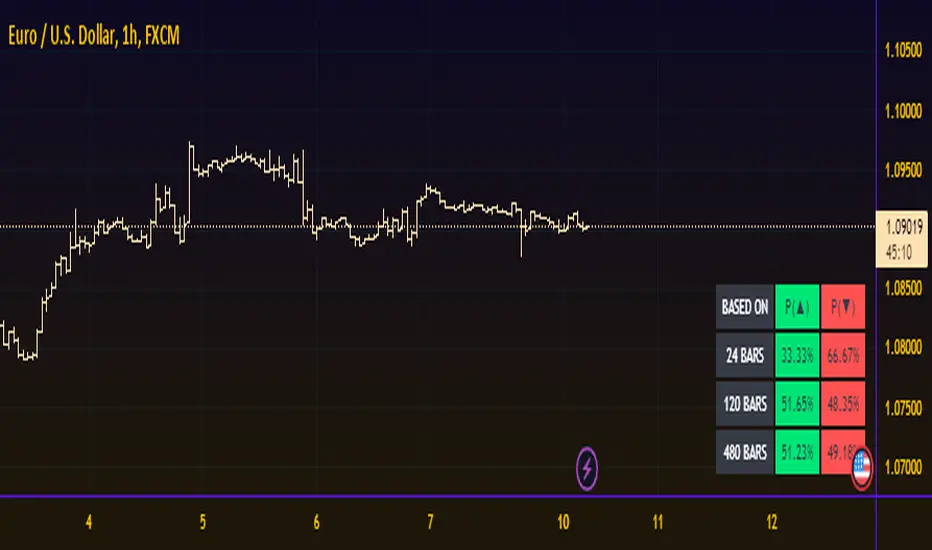
Probability TableThe script is inspired by user NickbarComb, I suggested checking out his Price Convergence script.
Basically, this script plots a table containing the probability of the current candle closing either higher or lower based on user-define past period.
Hope that it will be helpful.
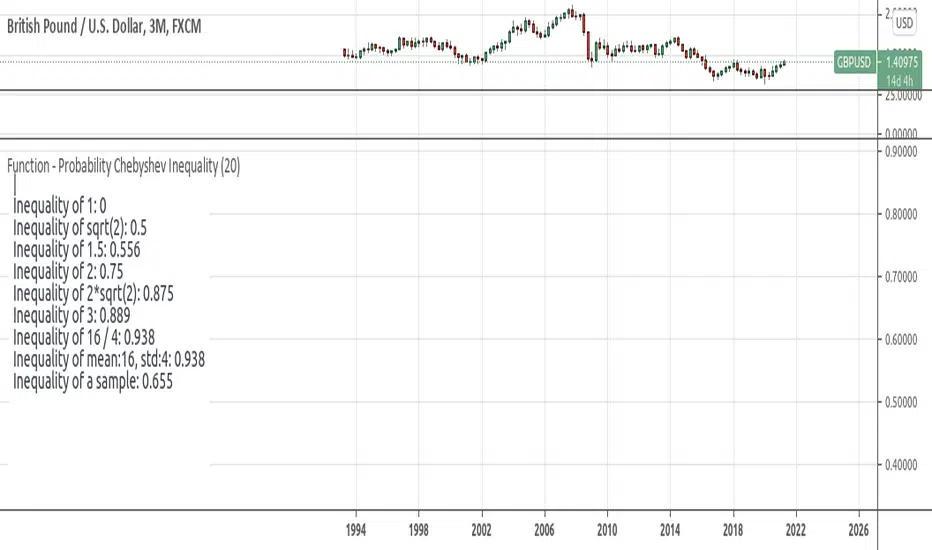
Function - Probability Chebyshev Inequalityfunction to calculate Chebyshev Inequality. wich can be used to compute the probability that we will diverge from what we expect to obtain.
reference:
- www.omnicalculator.com
- github.com
- statisticstopics.wordpress.com
- en.wikipedia.org
Function - Entropy Gini Indexfunction to retrieve Gini Impurity / Gini Index.
reference:
- victorzhou.com
- en.wikipedia.org

Function - Shannon Entropyfunctions for shannon's entropy
reference:
- en.wiktionary.org
- machinelearningmastery.com

test - event distributiondisplays the distribution of the outcome of a event over the last event.
similar to this script:

Pivot ProbabilitiesThis indicator gives traders historical probabilities based on how often price closed between any two pivot points.
What are the features? (as of release)
Get the historical statistics of how often price closed between any two pivot points.
Manually set your own pivot point resolution to any higher timeframe. So get the historical statistics from any pivot point you'd like.
Why would someone use this?
Reversion: We can more clearly see between which pivots price has highest probability of mean reversion towards.
Risk Management: By adding the statistics between groups of pivots, we can have a better idea of what the normal trading range for pivot points on any given asset should be. Making it easier to identify which pivot points are more likely to have extreme price movements go past.
Could you add an option to show probabilities for "x" style of pivot points?
I plan on adding more types of pivot points in the future. Check out if there are any updates to this indicator that include the pivots you're looking for. Otherwise, tell me what you're looking for in the comments here.
Why don't I see any pivot points on my chart when I apply this indicator?
This indicator does not draw pivot points on your chart. It strictly draws probabilities. So feel free to use it in combination with your favorite one.


test - delta distributiona test case for the KDE function on price delta.
the KDE function can be used to quickly check or confirm edge cases of the trading systems conditionals.

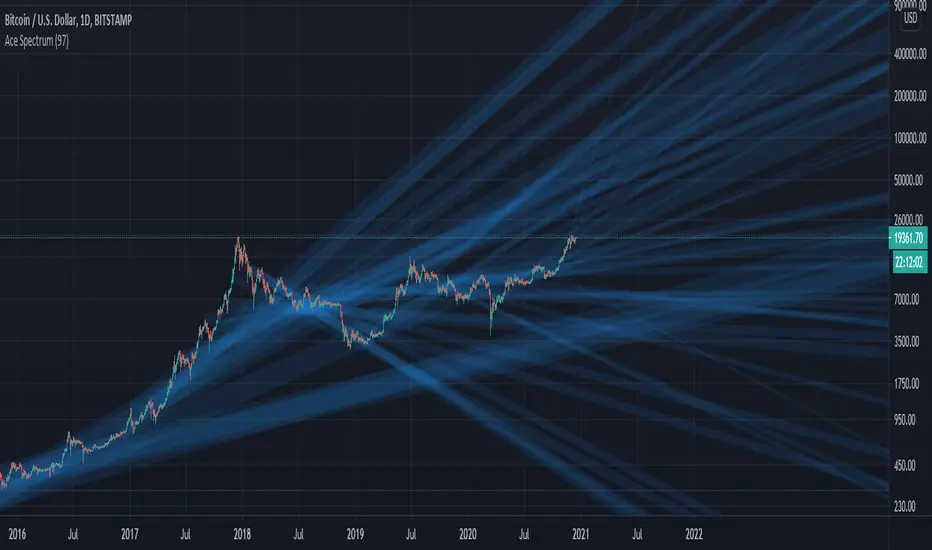
Chobotaru Indicator V1Now can be used by everyone.
Chobotaru Indicator has two functions:
1. Probability cloud, giving the probability of stock or future to move to a certain price.
2. Help traders understand where to take profit and where to put a stop-loss.
You don’t need knowledge about options trading, this indicator is for all traders/investors.
What does the indicator do?
The indicator is based on the partial differential equations from the mathematical model of options, the Black-Scholes model. Using these equations and market parameters the indicator shows on the chart the probability that the stock/future will touch a certain price until a specific date.
How the indicator does it?
The algorithm solves the partial differential equations using the following values:
Instrument price - The current price of the stock or futures contract
The interest rate – default zero – can be found by searching in google: “U.S. Department of the treasury daily yield curve rates”, Use the 3-month value. This value has a low impact on the model so you only need to update it when there is a major change in the percentile. (Example, in January 2021 the 3 months “risk-free rate” is 0.08, you can enter 0 in the indicator.
Days to expire (minus trading holidays) – You need to choose an option and take from it the other values that are needed. We recommend taking options that close to 30 days, but it is the user choice.
Example: On the 22 of January 2021, PLTR has an option that has 35 days left. The option will expire on the 26 of February 2021, if there are trading holidays like in this case, the user needs to subtract them, on the 15 of February we have Washington's Birthday, the input is 35-1=34.
Implied volatility - Annualized asset price volatility , specific as a positive decimal number. IV 10% => input 0.1, you can find it in the option chain, if you don’t know what it is, you can ask your broker where you can find it on your trading platform. For example, the IV of PLTR on the 22 of January 2021 is 120.67% the input is 1.2067
Date – Entering the date of entry.
How the indicator helps traders and how to use it?
After you enter the inputs correctly, you will see colorful lines, each line representing the probability for the price to touch there in the current market conditions until a specific date.
To see what percentage each color represents in the indicator press “style”. For example, red lines are a 50% chance for the price to touch there in the chosen period.
It also helps the trader to see what range the stock is expected to move and what range is not probable in this period (according to the options prices).
As you can see, the probability cloud is expanding. This is because as time passes, the probabilities of reaching far away prices are increasing.
Note: this indicator may not work on IPO

The Bayesian Q OscillatorFirst of all the biggest thanks to @tista and @KivancOzbilgic for publishing their open source public indicators Bayesian BBSMA + nQQE Oscillator. And a mighty round of applause for @MarkBench for once again being my superhero pinescript guy that puts these awesome combination Ideas and ES stradegies in my head together. Now let me go ahead and explain what we have here.
I am gonna call it the Bayesian Q Oscillator I suppose. The goal of the script is to solve an issue both indicators on their own suffer from. QQE signals are not new and often the problem has always been false signals for them. They are good for scalping but the difference between a quality move and a small to nearly nonexistent move following a signal is not so clear. Kivanc made his normalized version to help reduce this problem by adding colors to his histogram type verision that would essentially represent if price was a trending move or in a ranging structure. As you can see I have kept this Idea but instead opted for lines as the oscillator. two yellow line (default color) is a ranging sideways area and when there is red or green it is trending up or down. I wanted to take this to the next level with combining the Bayesian probability oscillator that tista put together.
The Bayesian indicator is the opposite for its issue as it is a probability indicator that shows which candle or price movement is more likely to come next. Red rising means possibly down move soon and green means up soon. I will not go into the complex details of this indicator but will suggest others take a look at his and others to understand the idea behind them. The point I am driving at is that it show probabilities or likelyhood without the most effecient signal device to match it. This original was line form and now it is background filled colors.
The idea. is that you can potentially get some stronger and more accurate reversal signals with these two paired together. when you see a sell signal or cross with the towering or rising red... maybe it is a good jump potentially. The same for green. At the same time it is a double added filter effect from just having yellow represent it is ranging... but now if you get a buy signal (example) and have yellow lines (example) along wi5h a red rising or mountain color background... it not only is an indication of ranging, but also that there is potentially even a counter move coming based on the probabilities. Also if you get into a good trade and see dual yellow qqe crosses with no color represented by the bayesian background... it is possible it might only be noise.
I have found them to work decently in the 1 hour timframe. Let me know your experience.
I hope everyone takes a look at the originals to understand them. Full credit goes to those guys for this to be here. Let me know how it is working out for you.
Here are the original links.
bayesian
Normalized QQE

Chobotaru IndicatorChobotaru Indicator has two functions:
1. Probability cloud, giving the probability of stock or future to move to a certain price.
2. Help traders understand where to take profit and where to put a stop-loss.
You don’t need knowledge about options trading, this indicator is for all traders/investors.
What does the indicator do?
The indicator is based on the partial differential equations from the mathematical model of options, the Black-Scholes model. Using these equations and market parameters the indicator shows on the chart the probability that the stock/future will touch a certain price until a specific date.
How the indicator does it?
The algorithm solves the partial differential equations using the following values:
Instrument price - The current price of the stock or futures contract
The interest rate – default zero – can be found by searching in google: “U.S. Department of the treasury daily yield curve rates”, Use the 3-month value. This value has a low impact on the model so you only need to update it when there is a major change in the percentile. (Example, in January 2021 the 3 months “risk-free rate” is 0.08, you can enter 0 in the indicator.
Days to expire (minus trading holidays) – You need to choose an option and take from it the other values that are needed. We recommend taking options that close to 30 days, but it is the user choice.
Example: On the 22 of January 2021, PLTR has an option that has 35 days left. The option will expire on the 26 of February 2021, if there are trading holidays like in this case, the user needs to subtract them, on the 15 of February we have Washington's Birthday, the input is 35-1=34.
Implied volatility - Annualized asset price volatility, specific as a positive decimal number. IV 10% => input 0.1, you can find it in the option chain, if you don’t know what it is, you can ask your broker where you can find it on your trading platform. For example, the IV of PLTR on the 22 of January 2021 is 120.67% the input is 1.2067
Date – Entering the date of entry.
How the indicator helps traders and how to use it?
After you enter the inputs correctly, you will see colorful lines, each line representing the probability for the price to touch there in the current market conditions until a specific date.
To see what percentage each color represents in the indicator press “style”. For example, red lines are a 50% chance for the price to touch there in the chosen period.
It also helps the trader to see what range the stock is expected to move and what range is not probable in this period (according to the options prices).
As you can see, the probability cloud is expanding. This is because as time passes, the probabilities of reaching far away prices are increasing.
How to access the indicator?
Use the link below to obtain access to the indicator
Note: this indicator may not work on IPO

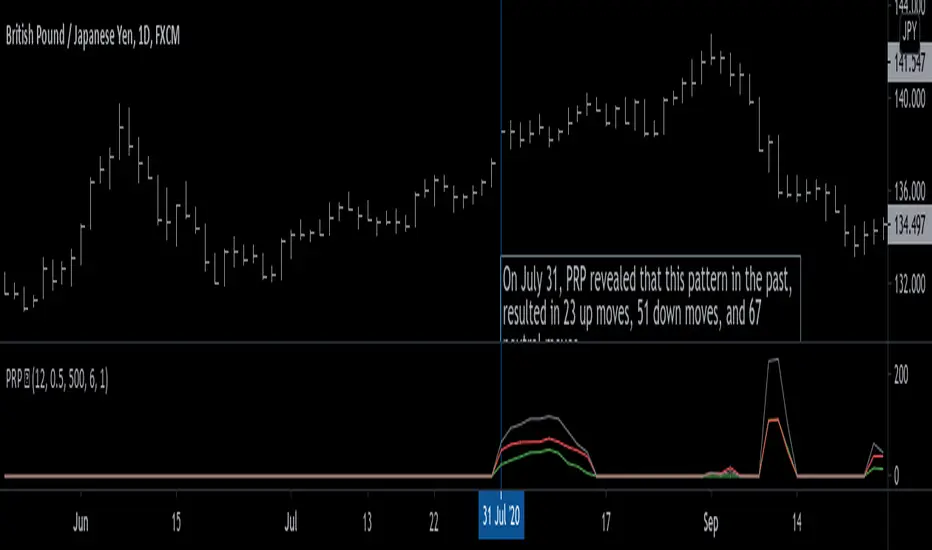
Pattern Recognition Probabilities [racer8]Brief 🌟
Pattern Recognition Probabilities (PRP) is a REALLY smart indicator. It uses the correlation coefficient formula to determine if the current set of bars resembles that of past patterns. It counts the number of times the current pattern has occurred in the past and looks at how it performed historically to determine the probability of an up move, down move, or neutral move.
I'd like to say, I'm proud of this indicator 😆🤙 This is the SMARTEST indicator I have ever made 🧠🧠🧠
Note: PRP doesn't give you actual probabilities, but gives you instead the historical occurrences of up, down, and neutral moves that resulted after the pattern. So you can calculate probabilities based on these valuable statistics. So for example, PRP can tell you this pattern has historically resulted in 55 up moves, 20 down moves, and 60 neutral moves.
Parameters 🌟
You can adjust the Pattern length, Minimum correlation, Statistics lookback, Exit after time, and Atr multiplier parameters.
Pattern length - determines how long the pattern is
Minimum correlation - determines the minimum correlation coefficient needed to pass as a similiar enough pattern.
Statistics lookback - lookback period for gathering all the patterns in the past.
Exit after time - determines when exit occurred (number of periods after pattern) ; is the point that represents the pattern's result.
Atr multiplier - determines minimum atr move needed to qualify whether result was an up/down move or a neutral move. If a particular historical pattern resulted in a move that was less than the min atr, then it is recorded as a neutral move in the statistics.
Thanks for reading! 🙏
Good luck 🍀 Stay safe 😷 Drink lots of water💧
Enjoy! 🥳 and Hit the like button! 👍
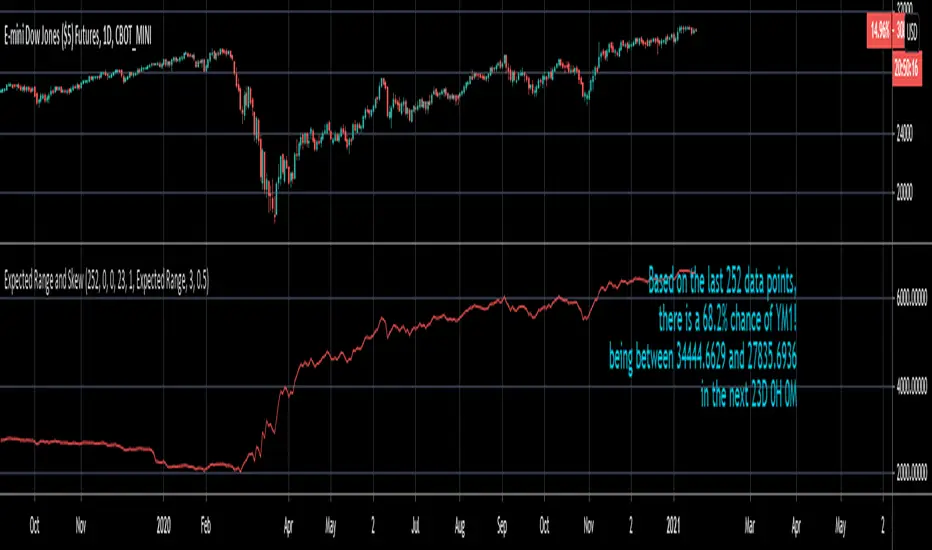
Expected Range and SkewThis is an open source and updated version of my previous "Confidence Interval" script. This script provides you with the expected range over a given time period in the future and the skew of that range. For example, if you wanted to know the expected 1 standard deviation range of MSFT over the next 20 days, this will tell you that. Additionally, this script will also tell you the skew of the expected range.
How to use this script:
1) Enter the length, this will determine the number of data points used in the calculation of the expected range.
2) Enter the amount of time you want projected forward in minutes, hours, and days.
3) Input standard deviation of the expected range.
4) Pick the type of data you want shown from the dropdown menu. Your choices are either the expected range or the skew of the expected range.
5) Enter the x and y coordinates of the label (optional). This is useful so it doesn't impede your view of the plot.
Here are a few notes about this script:
First, the expected range line gives you the width of said range (upper bound - lower bound), and the label will tell you specifically what the upper and lower bounds of the expected range are.
Second, this script will work on any of the default timeframes, but you need to be careful with how far out you try to project the expected range depending on the timeframe you're using. For example, if you're using the 1min timeframe, it probably won't do you any good trying to project the expected range over the next 20 days; or if you're using the daily timeframe it doesn't make sense to try to project the expected range for the next 5 hours. You can tell if the time horizon you're trying to project doesn't work well with the chart timeframe you're using if the current price is outside of either the upper or lower bounds provided in the label. If the current price is within the upper and lower bounds provided in the label, then the time horizon that you're projecting over is reasonable for the chart timeframe you're using.
Third, this script does not countdown automatically, so the time provided in the label will stay the same. For example, in the picture above, the expected range of Dow Futures over the next 23 days from January 12th, 2021 is calculated. But when tomorrow comes it won't count down to 22 days, instead it will show the range over the next 23 days from January 13th, 2021. So if you want the time horizon to change as time goes on you will have to update this yourself manually.
Lastly, if you try to set an alert on this script, you will get a warning about it possibly repainting. This is because of the label, not the plot itself. The label constantly updates itself, which triggers the warning. I tested setting alerts on this script both with and without the inclusion of the label, and without the label the repainting warning did not occur. So remember, if you set an alert on this script you will get a warning about it possibly repainting, but this is because of the label constantly updating, not the plot itself.
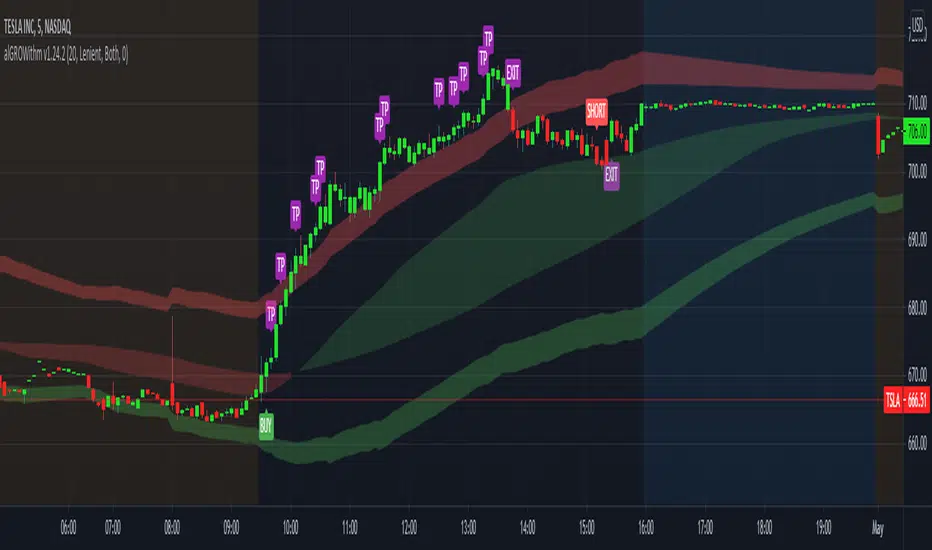
alGROWithm PremiumIntroducing the alGROWithm indicator!
Years of trading experience and endless hours of screen time has undeniably proven to me that the most fundamental rule of any market is: price moves from supply to supply and demand to demand. Specifically, this means that a breakout of a supply zone , the probability of it reaching the next supply zone before starting consolidate is very high. Similarly, a breakdown from previous demand zone will likely continue to the next demand zone . The identification method of these supply and demand channels is one of the features that sets this indicator apart from other available tools.
What separates alGROWithm from other available tools?
- Proprietary method for identifying supply & demand channels combined with a directional bias computation based on recent historical prices
- Only signaling precise entries based on supply & demand that maximize R/R
- Tracking open positions and displaying a trading plan directly on the chart immediately after signaling entry points
- Indicating precise exit levels to help you avoid exiting too early or trading by emotion
What are the features included in alGROWithm?
Trading Plan Lines : These are the Buy/Short/Take Profit/Exit lines plotted directly on the chart
Show Long Signals : These are the green "BUY" labels that appear on the chart when alGROWithm identifies a critical breakout to the next supply level
Show Short Signals : These are the red "SHORT" labels that appear on the chart when alGROWithm identifies a critical breakdown to the next demand level
Show Take Profit Signals : These are the purple "TP" labels that appear on the chart when alGROWithm identifies that the subsequent supply/ demand level has been hit
Show Exit/Stop Loss Signals : These are the purple "EXIT" labels that appear on the chart when alGROWithm identifies that the trade has run its course and it's time to exit
Show Dashboard : This is a dashboard that is displayed to the right of the latest candle, and contains the following information:
- Current Position : "Long", "Short", or "None"
- Next Profit Target : Only displays if there is an active Position
- Current Bias : alGROWithm computes a directional bias based on recent historical prices. Text will say "Long" or "Short"
- Long/Short Bias Until : alGROWithm's bias will change if this price is hit. Note that these are not BUY or SELL levels - this simply indicates whether things are looking up or down
- Enter Short/Long At : Only displays if Current Position = "None"
Note that you can enable/disable any of these chart overlays at anytime through the indicator settings.
The alGROWithm indicator works on any timeframe, any market, and standard OR Heikin Ashi candlesticks .
I have been working very hard on this indicator and I personally use it on a daily basis with options trading. I am so excited to share the wealth with you!
You can use the link below to visit our website and gain access to the script.
Probability Bands [Anan]Hello Friends,,,
===================================
This indicator is based on Bayes' Theorem and is fully based on probabilities.
===================================
Formula For Bayes' Theorem:
P(Bull|Bear) = P(Bear∣Bull) * P(Bull) / P(Bear)
where:
Bull and Bear are events and P is probability
P(Bull|Bear) is the posterior probability, the probability of Bull after taking into account Bear
P(Bear∣Bull) is the conditional probability or likelihood, the degree of belief in Bear given that proposition of Bull belief (Bull true)
P(Bull) is the prior probability, the probability of Bull belief
P(Bear) is the prior probability, the probability of Bear belief
===================================
The indicator output one trend lines and (Bull/Bear) Signal :
Bull/Bear Probability Trend :
when the price is above mid line ==> Up Trend
when the price is below mid line ==> Down Trend
And by using ATR deviation multipliers, we can get (Bullish/Bearish) zones
===================================
Disclaimer:
This script is for informational and educational purposes only.
Use of the script does not constitutes professional and/or financial advice.
You alone the sole responsibility of evaluating the script output and risks associated with the use of the script.
===================================
Probability Function [racer8]It's my birthday today! Just turned 20, so I decided to make another indicator. There's not very many indicators on TV that calculate pure probability. Many indicators on TV have the word "Probability" in their titles but they don't actually calculate probability...I call them "false titles". This indicator aims to change that. This is the indicator that every option trader dreams of having. Even if you're not an options trader, it's still very interesting to know the probability of a price movement.
Probability Function calculates the probability of a data point (price) falling within a certain number of standard deviations away from the mean.
So for example, setting the parameter to 2 standard deviations will calculate the probability of price staying within a 2-standard-deviations-channel away from the mean (or moving average). This description is exactly what Bollinger Bands are...which makes it a direct application of this indicator, and Bollinger Bands are used by many traders.
The indicator's formula is an approximation of the integral of the standard normal distribution function. It uses one parameter called "Standard deviation multiple" (SDM). An input of 1 stdev yields 68%, 2 stdevs yields 95%, 3 stdevs yields approx 99.7%, and so on eventually converging to 100%...and it makes sense the bigger the stdev channel, the more likely price will stay within it.
Enjoy and hit the like button!
