Portfolio TrackerPortfolio Tracker – Manual Position Dashboard
This indicator provides a clean, non-intrusive dashboard for tracking open equity positions directly on your chart.
You can manually enter up to 20 positions (symbol, quantity, and buy price), and the dashboard will automatically compute:
- Invested amount per position
- Live market price
- Current market value
- Profit / Loss (absolute)
- Profit / Loss (%)
- Portfolio-level totals
The dashboard updates on the latest bar only, ensuring stable values and minimal redraw overhead.
Visuals :
- Supports up to 20 simultaneous positions
- Clear green / red P&L highlighting per position
- Portfolio totals calculated in real time
- Adjustable dashboard size (Small / Normal / Large)
- User-selectable dashboard position (top/bottom, left/right)
No trading logic, no signals, no repainting — tracking only
Portfoliotracker

ETF Builder & Backtest System [TradeDots]Create, analyze, and monitor your own custom “ETF-like” portfolio directly on TradingView. This script merges up to 10 different assets with user-defined weightings into a single composite chart, allowing you to see how your personalized portfolio would have performed historically. It is an original tool designed to help traders and investors quickly gauge risk and return profiles without leaving the TradingView platform.
📝 HOW IT WORKS
1. Custom Portfolio Construction
Multiple Assets : Combine up to 10 different stocks, ETFs, cryptocurrencies, or other symbols.
User-Defined Weights : Allocate each asset a percentage weight (e.g., 15% in AAPL, 10% in MSFT, etc.).
Single Composite Value : The script calculates a weighted “ETF-style” price, effectively simulating a merged portfolio curve on your chart.
2. Performance Tracking & Return Analysis
Automatic History Capture : The indicator records each asset’s starting price when it first appears in your chosen date range.
Rolling Updates : As time progresses, all asset prices are continually evaluated and the portfolio value is updated in real time.
Buy & Hold Returns : See how each asset—and the overall portfolio—performed from the “start” date to the most recent bar.
Annualized Return : Automatically calculates CAGR (Compound Annual Growth Rate) to help visualize performance over varying timescales.
3. Table & Visual Output
Performance Table : A comprehensive table displays individual asset returns, annualized returns, and portfolio totals.
Normalized Chart Plot : The composite ETF value is scaled to 100 at the start date, making it easy to compare relative growth or decline.
Optional Time Filter : You can define a specific date range (Start/End Dates) to focus on a particular period or to limit historical data.
⚙️ KEY FEATURES
1. Flexible Asset Selection
Choose any symbols from multiple asset classes. The script will only run calculations when data is available—no need to worry about missing quotes.
2. Dynamic Table Reporting
Start Price for each asset
Percentage Weight in the portfolio
Total Return (%) and Annualized Return (%)
3. Simple Backtesting Logic
This script takes a straightforward Buy & Hold perspective. Once the start date is reached, the portfolio remains static until the end date, so you can quickly assess hypothetical growth.
4. Plot Customization
Toggle the main “ETF” plot on/off.
Alter the visual style for tables and text.
Adjust the time filter to limit or extend your performance measurement window.
🚀 HOW TO USE IT
1. Add the Script
Search for “ETF Builder & Backtest System ” in the Indicators & Strategies tab or manually add it to your chart after saving it in your Pine Editor.
2. Configure Inputs
Enable Time Filter : Choose whether to restrict the analysis to a particular date range.
Start & End Date : Define the period you want to measure performance over (e.g., from 2019-12-31 to 2025-01-01).
Assets & Weights : Enter each symbol and specify a percentage weight (up to 10 assets).
Display Options : Pick where you want the Table to appear and choose background/text colors.
3. Interpret the Table & Plots
Asset Rows : Each asset’s ticker, weighting, start price, and performance metrics.
ETF Total Row : Summarizes total weighting, composite starting value, and overall returns.
Normalized Plot : Tracks growth/decline of the combined portfolio, starting at 100 on the chart.
4. Refine Your Strategy
Compare how different weights or a new mix of assets would have performed over the same period.
Assess if certain assets contribute disproportionately to your returns or volatility.
Use the results to guide allocations in your real trading or paper trading accounts.
❗️LIMITATIONS
1. Buy & Hold Only
This script does not handle rebalancing or partial divestments. Once the portfolio starts, weights remain fixed throughout the chosen timeframe.
2. No Reinvestment Tracking
Dividends or other distributions are not factored into performance.
3. Data Availability
If historical data for a particular asset is unavailable on TradingView, related results may display as “N/A.”
4. Market Regimes & Volatility
Past performance does not guarantee similar future behavior. Markets can change rapidly, which may render historical backtests less predictive over time.
⚠️ RISK DISCLAIMER
Trading and investing carry significant risk and can result in financial loss. The “ETF Builder & Backtest System ” is provided for informational and educational purposes only. It does not constitute financial advice.
Always conduct your own research.
Use proper risk management and position sizing.
Past performance does not guarantee future results.
This script is an original creation by TradeDots, published under the Mozilla Public License 2.0.
Use this indicator as part of a broader trading or investment approach—consider fundamental and technical factors, overall market context, and personal risk tolerance. No trading tool can assure profits; exercise caution and responsibility in all financial decisions.

Portfolio [Afnan]🚀 Portfolio - Advanced Portfolio Management Indicator 📊
A game-changing portfolio management tool designed to help traders stay on top of their positions and manage risk efficiently. This indicator combines detailed tracking, real-time analytics, and visual clarity to ensure traders are well-equipped for the dynamic world of financial markets.
📈 Key Features 💡
Track up to 14 positions with ease
Real-time Profit & Loss (P&L) updates and risk metrics
Visual representation of entry, stop-loss (SL), and target levels
Alerts for stop-loss breaches and target achievements
Comprehensive portfolio summaries for quick analysis
Customizable options to suit individual trading styles
🔍 Main Components ⚙️
📊 1. Position Tracking
Detailed position data: entry, stop-loss, target levels, and more
Real-time risk-reward ratios
Insights into position size and exposure percentages
Continuous updates on P&L in real-time
📉 2. Visual Indicators
Clear visual markers for entry, SL, and target prices
Price labels with detailed percentage changes
Indicators that show the current position's market status
💼 3. Portfolio Summary
Aggregate account values and exposure
Summarized P&L metrics across all positions
Risk management insights for better decision-making
Daily performance tracking to evaluate strategies
⚠️ 4. Alert System
Instant notifications for stop-loss breaches
Alerts when target prices are hit
Alerts operate for the current chart symbol
⚡ Customization Options 🎨
Show or hide specific data columns
Adjust the table's position and size for better visibility
Personalize color schemes and text styles
Switch between full portfolio view and single symbol focus
📱 How to Use 📝
Input your positions in the indicator's settings
Enable or disable specific positions dynamically
Customize display preferences to your liking
Set up alerts for proactive risk management
Monitor all your trading activities in one comprehensive dashboard
📌 Important Notes ℹ️
Compatible with any trading symbol
Updates seamlessly during market hours
Alerts are specific to the currently active chart symbol
Maximum capacity: 14 simultaneous positions
Created by: @AfnanTAjuddin
⚠️ Disclaimer ⚠️
This indicator is a tool for informational purposes only. Ensure all calculations are verified and consult a financial professional before making investment decisions.
🎯 "Stay disciplined, trade smart, and let data guide your decisions." 📊

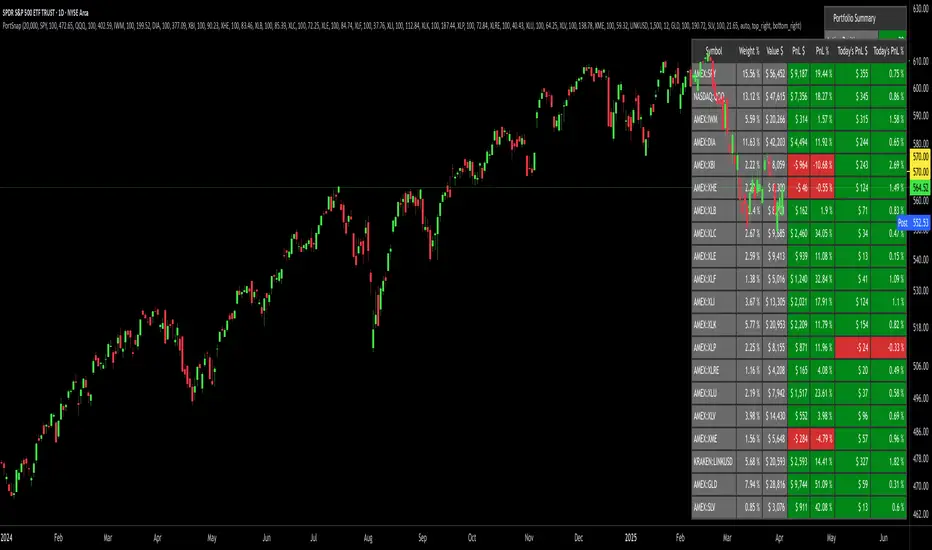
Portfolio SnapShot v0.3Here is a Tradingview Pinescript that I call "Portfolio Snapshot". It is based on two other separate scripts that I combined, modified and simplified - shoutout to RedKTrader (Portfolio Tracker - Table Version) and FriendOfTheTrend (Portfolio Tracker For Stocks & Crypto) for their inspiration and code. I was using both of these scripts, and decided to combine the two and increase the number of stocks to 20. I was looking for an easy way to track my entire portfolio (scattered across 5 accounts) PnL on a total and stock basis. PnL - that's it, very simple by design. The features are:
1) Track PnL across multiple accounts, from inception and current day.
2) PnL is reported in two tables, at the portfolio level and individual stock level
3) Both tables can be turned on/off and placed anywhere on the chart.
4) Input up to 20 assets (stocks, crypto, ETFs)
The user has to manually calculate total shares and average basis for stocks in multiple accounts, and then inputs this in the user input dialog. I update mine as each trade is made, or you can just update once a week or so.
I've pre-loaded it with the major indices and sector ETFs, plus URA, GLD, SLV. 100 shares of each, and prices are based on the close Jan 2 2024. So if you don't want to track your portfolio, you can use it to track other things you find interesting, such as annual performance of each sector.
Portfolio TableA tool to manage your invested assets (stocks, crypto currencies, ...).
- Show profit of every asset as well as the total profit.
- Show/hide a bought price line on the chart if the current selected ticker is on your portfolio.

Portfolio Tracker For Stocks & CryptoThis is a portfolio tracker that will track individual, overall and daily profit/loss for up to 12 assets. You can set the size of your buys and price of your buys for accurate, up to date profit and loss data right on your chart. It works on all markets and timeframes.
HOW TO USE
Go into the indicator settings and you will see all of the available settings. The first is the ability to turn the tracker info table on or off from the chart, so it saves your portfolio info but let’s you remove it from the chart while trading. Second is the option to move the position of the info table to suit your preference.
Next we get into setting up your portfolio tickers, order size and price. Each ticker lets you set which stock/crypto you bought, then set how much you purchased and then what price you purchased them at.
Go through and set up all of your assets and then turn off any tickers that you don’t need. Once that is all done, your portfolio will be shown on the chart with all the data.
FEATURES
Top Section
The portfolio tracker has 2 sections. The top section shows each ticker in your portfolio individually with the following data:
- Ticker Name
- Weight of that asset compared to your total portfolio in %
- Current value of that position in $
- Profit or loss value from purchase price in %
- Todays change in value from yesterday’s close in %
The $ Value, PnL % and Today % will all change colors from green to red depending if they are in profit or not.
Bottom Section
The bottom section of the tracker will give you info for your portfolio as a whole. It has the following data:
- Total cost of your entire portfolio in $
- Current value of your entire portfolio in $
- Current profit or loss of your entire portfolio in $
- Current profit or loss of your entire portfolio in %
- Todays change of your entire portfolio value compared to yesterday’s close in %
The $ Value, PnL $, PnL % and Today % will all change colors from green to red depending if they are in profit or not.

Portfolio PerformanceThis indicators will help you to compute portfolio performance and display results with a stats table and a nice monthly chart.
In this script you can do following:
Compose portfolio with up to 15 instruments
Change Initial capital / date range / rebalancing period
Compare portfolio performance with a benchmark
Compute basic stats
Compute instruments contribution
Display monthly performance of portfolio and benchmark
Change style for almost everything you see on your chart
Hope it will be useful for you!
Thanks to @MUQWISHI for helping me coding it.
Disclaimer
Please remember that past performance may not be indicative of future results.
Due to various factors, including changing market conditions, the strategy may no longer perform as well as in historical backtesting.
This post and the script don’t provide any financial advice.

Portfolio Performance - Effects of RebalancingFunction:
- Can be used to evaluate the performance of a portfolio containing 2 assets over a set time interval
- Shows the % return of the portfolio over the time interval defined by the user
- Includes a threshold rebalancing algorithm to show the effects that rebalancing has on the portfolio over the long term
- Created to evaluate of the performance of portfolios containing different weightings of stocks and bonds over time assuming that the user would rebalance the portfolio when asset weights crossed a threshold
Instructions:
- To be used with dividends adjustments turned on
- Add this script to a symbol. e.g. AMEX:SPY
- Click the chart to define the entry time and the exit time. i.e. the time interval
- Define the initial investment of the portfolio. Default setting is $100,000
- Define the second asset to be included in the portfolio. e.g. BATS:AGG
- The strategy comes pre-populated with a portfolio that has a weight of 80% asset 1 and 20% asset 2. i.e. 80% AMEX:SPY and 20% BATS:AGG if the symbols mentioned above were chosen
- The 7 lines show the weighted % return of each portfolio over the time period defined by the user
- Each line (except the blue) is the return based on a different rebalancing threshold. The default settings are 1%, 2.5%, 5%, 10%, 15%, 20%, 30%
- The blue line is the % return of a portfolio that was made up of 100% asset 1 over the time interval. i.e. 100% AMEX:SPY
- Asset weights and rebalancing thresholds are adjustable via the settings
- Each plot can be turned on and turned off via a tick box in the settings

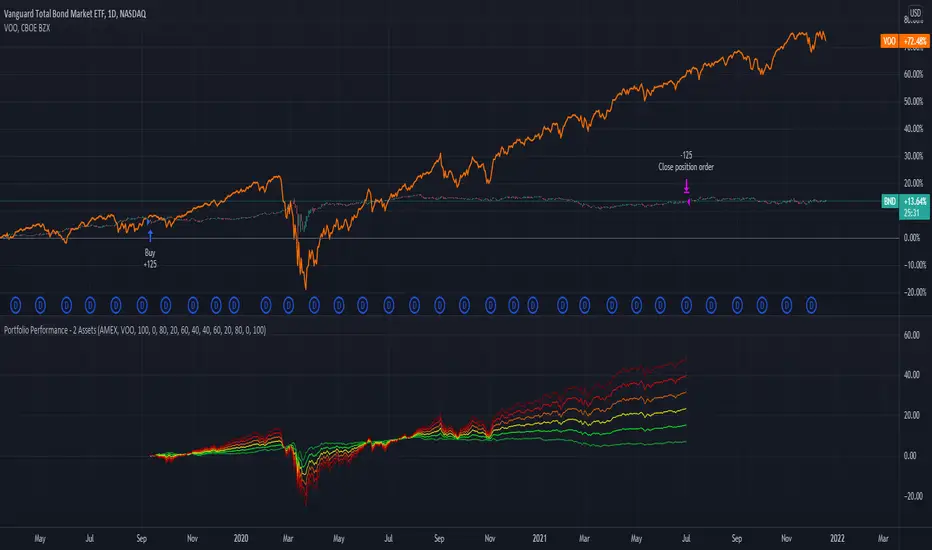
Portfolio Performance - 2 AssetsFunction:
- Can be used to evaluate the performance of portfolios containing 2 assets over a set time interval
- Created to evaluate of the performance of portfolios containing different weightings of stocks and bonds over time
- Shows the % return of each portfolio over the time interval defined by the user
- Capable of showing the risk adjusted % return of each portfolio over the time interval defined by the user (setting turned off by default)
Instructions:
- To be used with dividends adjustments turned on
- Add this script to a symbol. e.g. NASDAQ:BND
- Click the chart to define the entry time and the exit time. i.e. the time interval
- Define the second asset to be included in the portfolio. e.g. AMEX:VOO
- The strategy comes pre-populated with 6 portfolios with the most common stock/bond weightings (100% stocks/0% bonds, 80% stocks/20% bonds, 60% stocks/40% bonds, et cetera)
- The 6 lines show the weighted % return of each portfolio over the time period defined by the user
- All asset weights are adjustable via the settings
- Each plot can be turned on and turned off via a tick box in the settings
- There are 6 plots that show the risk adjusted returns of each portfolio (setting turned off by default)
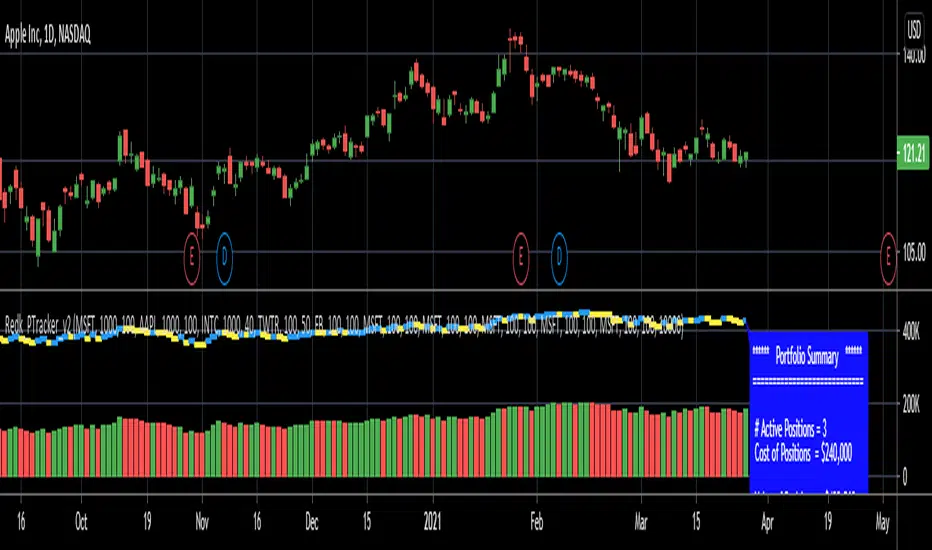
RedK_Portfolio Tracker v2: few enhancements and display optionsThis is an update for the PTracker v1 that I published couple of days ago. wanted to publish this as a separate script to get a chance to show how the new Portfolio Summary Infobox can be displayed on the price chart as an option. In my opinion, that info box is the most important element in this tool and that's the piece i was most looking for.
quick note here: you can track your portfolio (if not so many positions) by entering something like (without the brackets) in TradingView's chart symbol area - TradingView will resolve these symbols and chart the total -- there's a nice post by our friend @boji1 about this in a lot more details - however, that wouldn't show the stats that i need to look at to track my portfolio on daily basis.
i also made couple of other enhancements, like adding the ability to include "free cash" in the portfolio - While this free cash value will impact the Total P/L and P/L %, as part of the overall portfolio (and the denominator), it will not impact the "cost of positions" or the (current) "value of positions" -- also "Cash" will not count towards the total 10 positions that we can track with this tool.
Using Portfolio Tracker as a floating panel on the price chart
====================================================
By default, when the Portfolio Tracker is added to the chart, it will occupy its own lower panel like the picture above.
if your charts are already busy (like mine :)) - you most probably already have a couple of lower studies and it's crowded there.
in this case, you can use the Object Tree tool after adding the PTracker, to drag it onto the price panel, or you can also do that by right-clicking on the infobox and choose to move up to the price panel.
when you do that, remember to also use the Style settings of PTracker to hide both Portfolio and PnL plots, and choose Scale = no scale - this way you get the infobox to work like a floating panel on the price chart
here's a screenshot that shows this scenario - also shows how the infobox color can be easily changed from the PTracker settings to suit your chart background and for best visibility
i hope this is useful in your trading - i look forward to @TradingView team surprising us with a real portfolio tracking capability soon :)
good luck.